
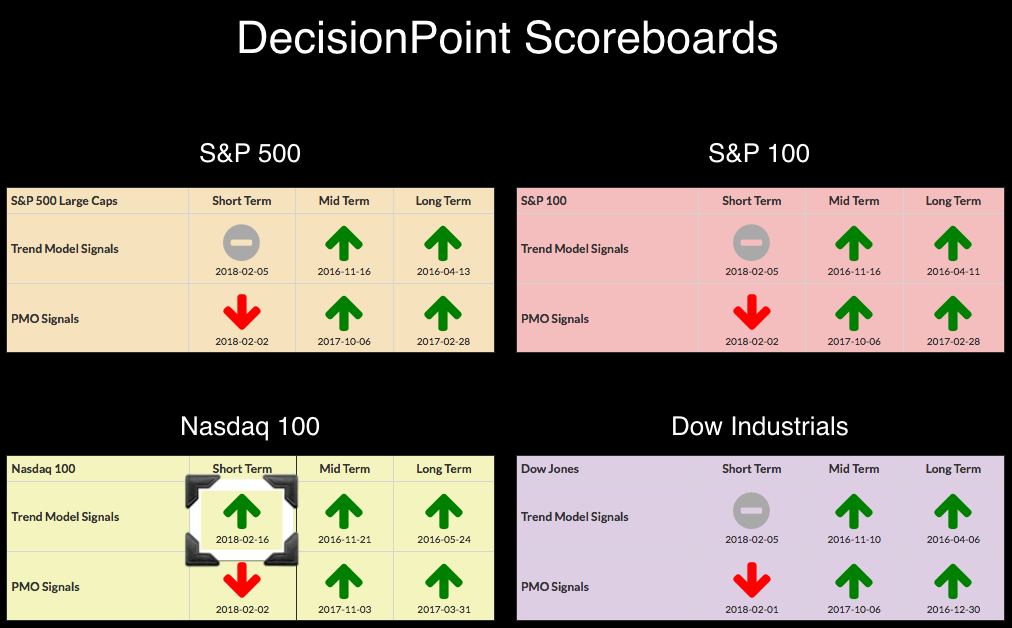
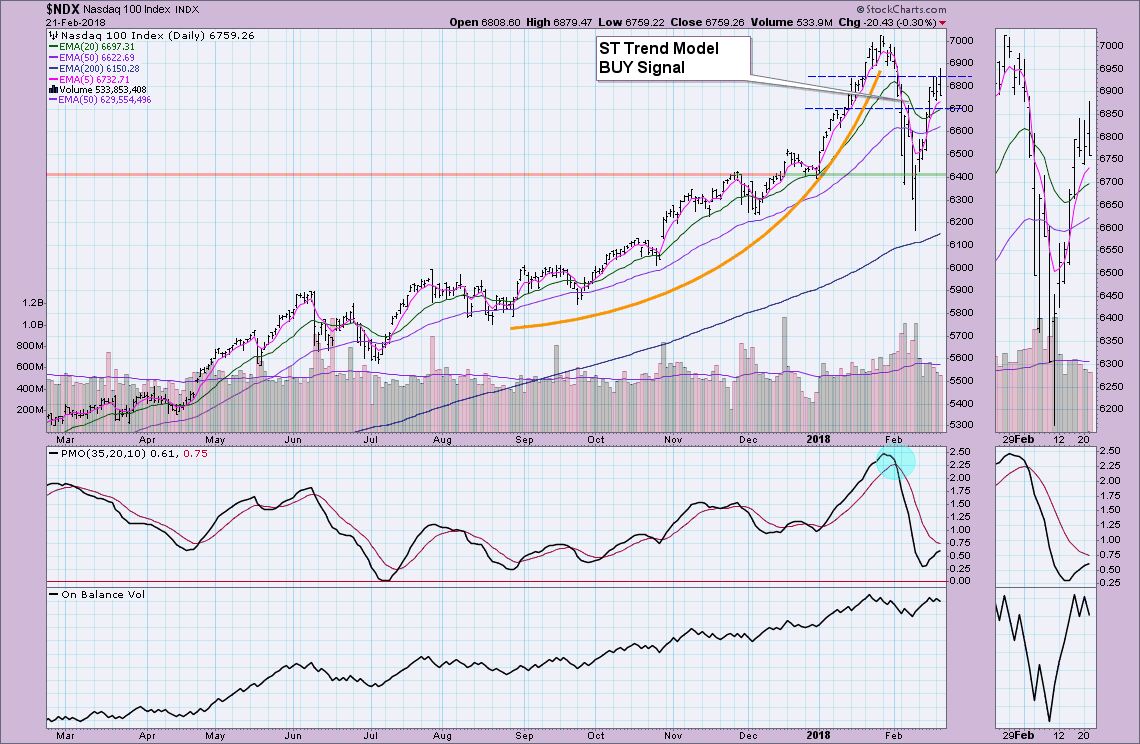
The NDX switched back to a Short-Term Trend Model BUY Signal on the DecisionPoint Scoreboards. The 5-EMA crossed above the 20-EMA which triggered the signal (the chart is below the scoreboards for your review).
The purpose of the DecisionPoint Alert Update is to quickly review the day's action, internal condition, and Trend Model status of the broad market (S&P 500), the U.S. Dollar, Gold, Crude Oil, and Bonds. To ensure that using this reference will be quick and painless, we are as brief as possible, and sometimes we let a chart speak for itself.
STOCKS
IT Trend Model: BUY as of 11/15/2016
LT Trend Model: BUY as of 4/1/2016
I had noted on the MarketWatchers LIVE show this morning that price had broken out of the declining trend channel, but I also said that it appeared to be more of a drift out of the channel and therefore not so impressive. After the FOMC minutes, price began to dive until eventually, we've ended up back in the declining trend channel.
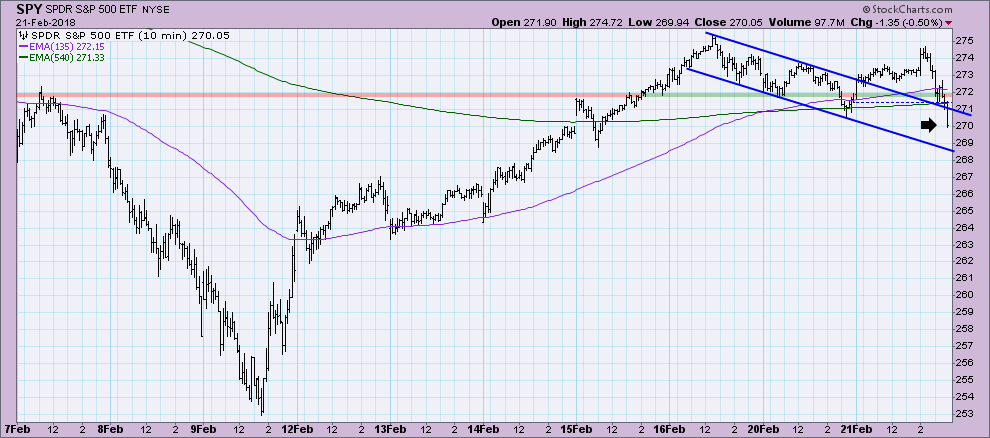
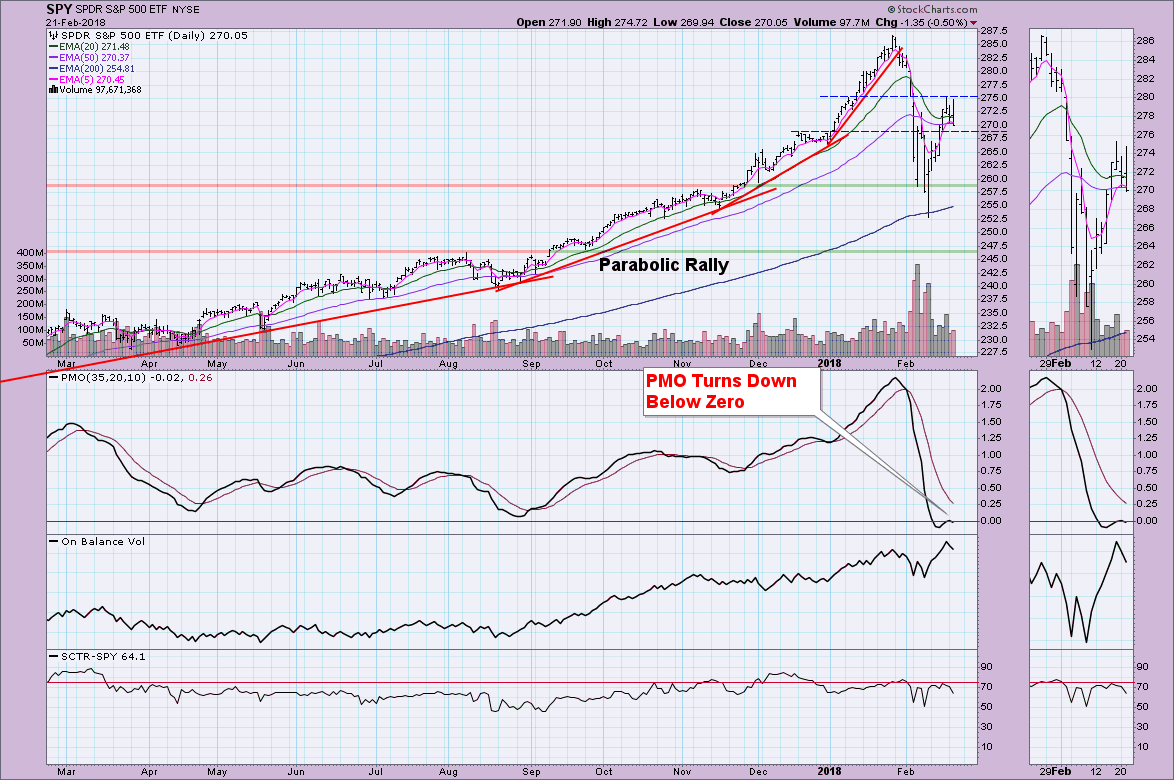
I believe if we are lucky, price will consolidate in the current channel without the need for a pullback. The PMO which had been rising, turned back down today which suggests consolidation will likely give way to a pullback.
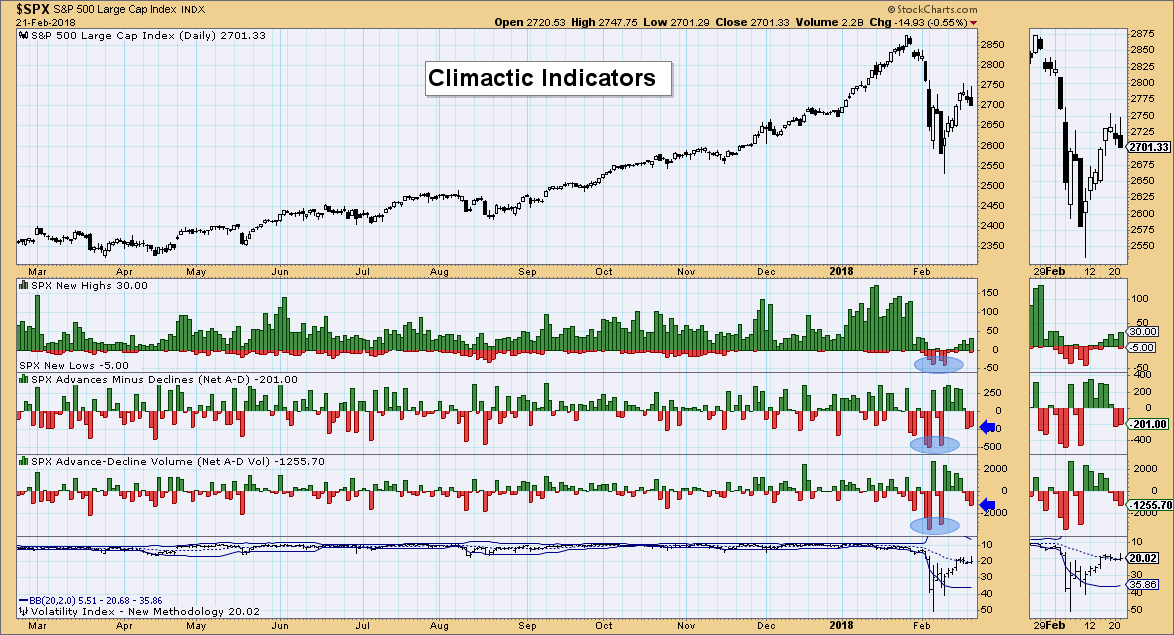
Climactic Indicators:
We're seeing some elevated breadth readings, but we've seen far more climactic readings and at this point the VIX is still sitting comfortably on it's average. I read these indicators as neutral.
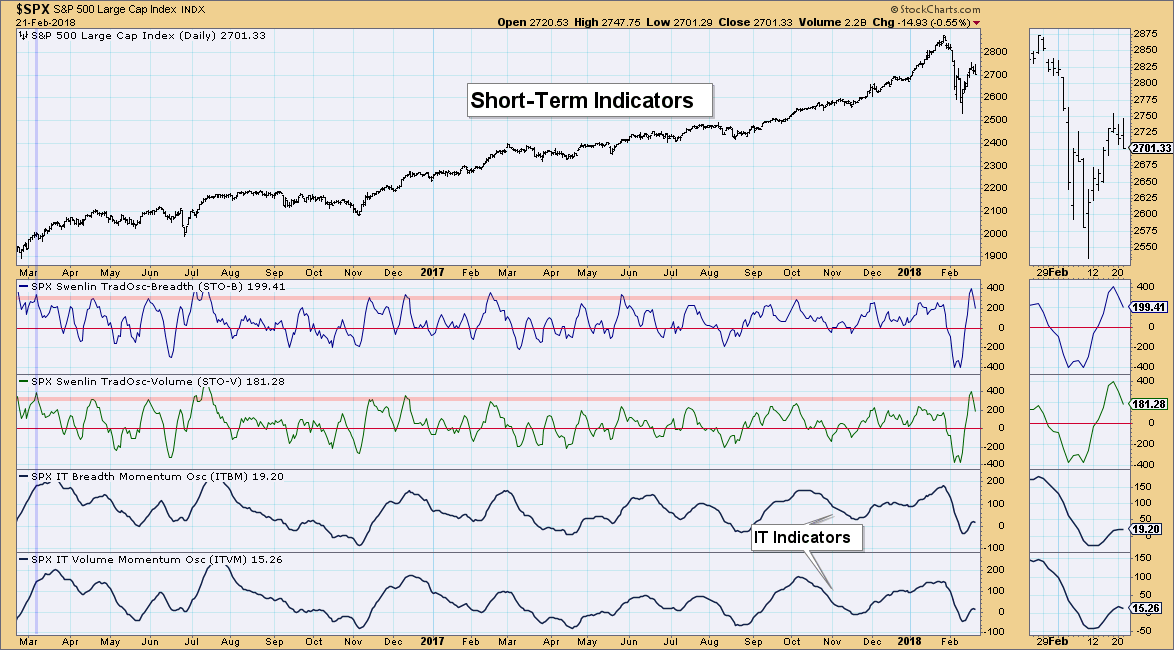
Short-Term Indicators:
After reaching extremely overbought territory, the Swenlin Trading Oscillators (STOs) are tumbling lower. They are still very overbought and bearishly in decline.
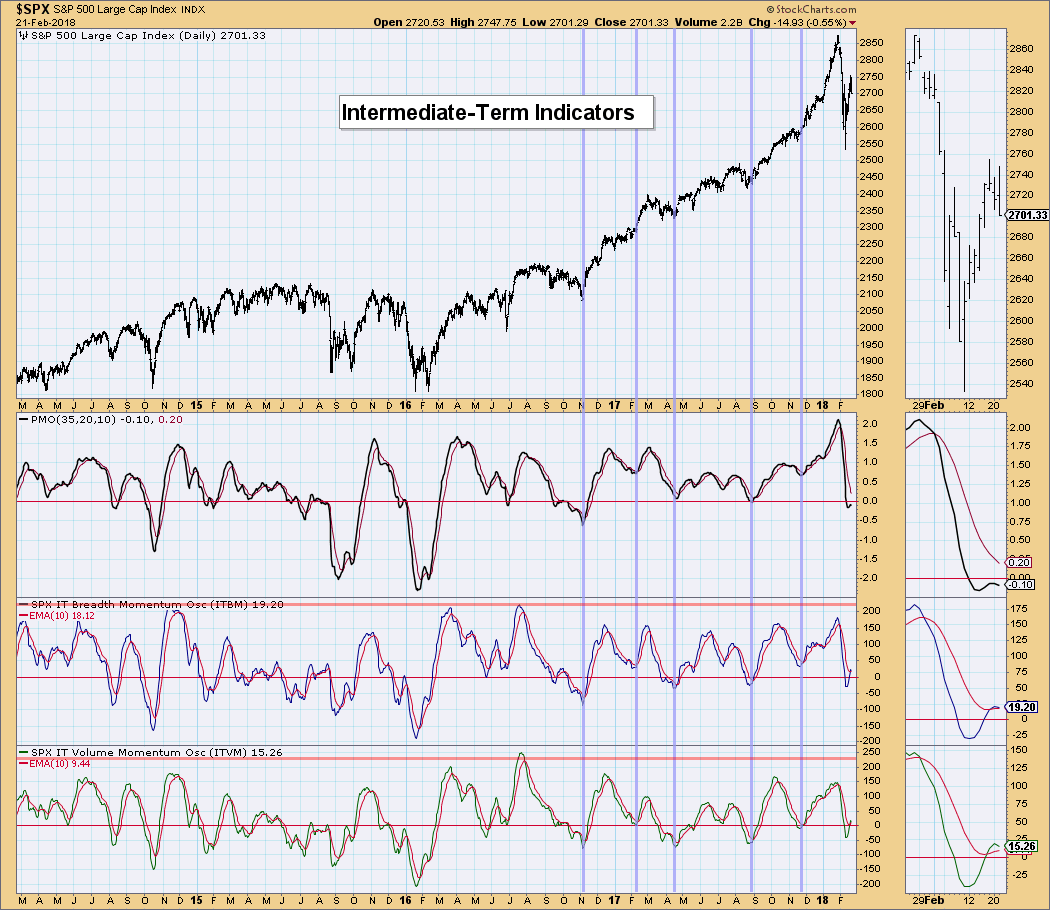
Intermediate-Term Indicators:
I had liked these indicators crossing above their signal lines, but today they've started to sour along with the PMO. The bottom on the ITBM/ITVM is bullish and until we see more than a twitch lower, I would read these as bullish for the market so far.
Conclusion:
I believe that short-term indicators are telling us to look for more pullback. The IT indicators are still favorable, but they're weakening. They'll need reevaluation when the ST indicators have reached neutral territory.
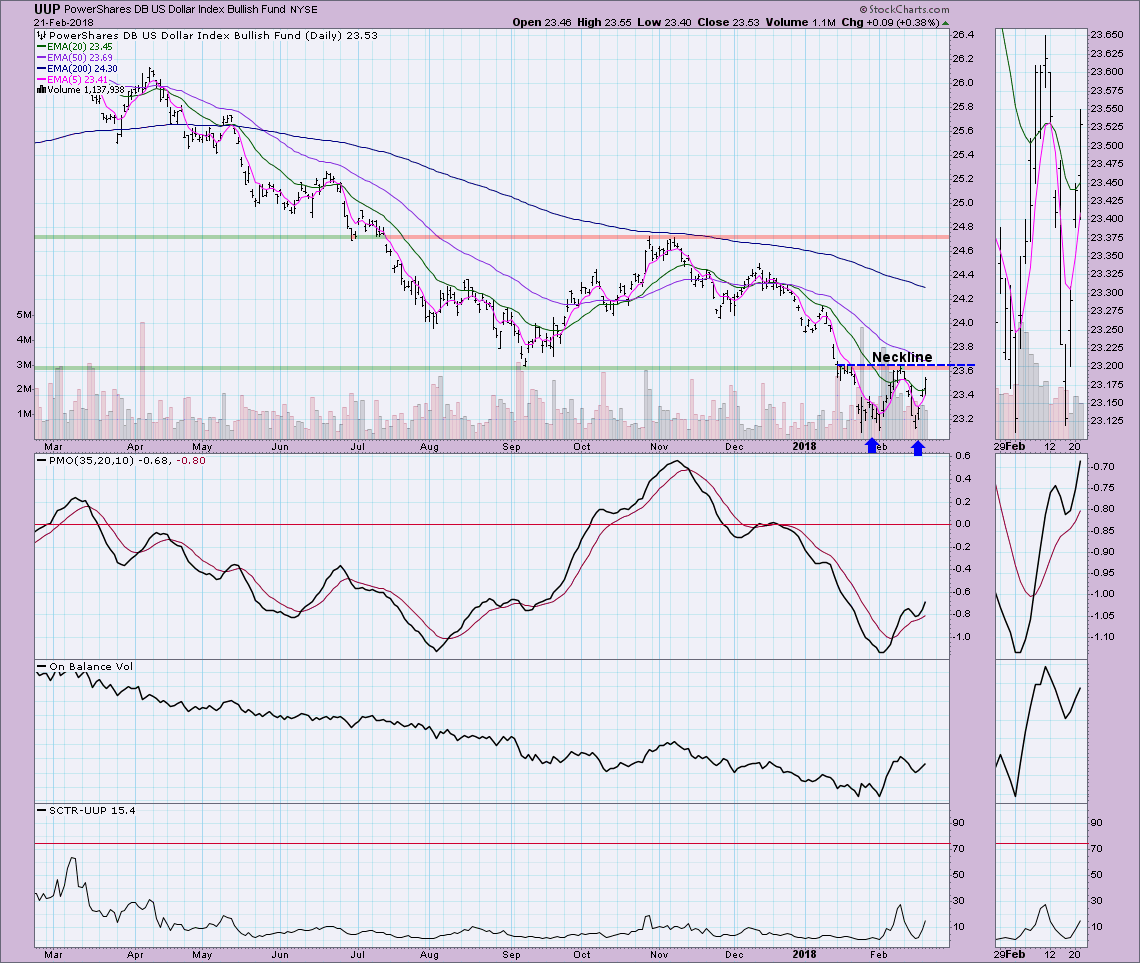
DOLLAR
IT Trend Model: SELL as of 12/21/2017
LT Trend Model: SELL as of 05/24/2017
I'm seeing a promising double-bottom formation on UUP. I have to play by bear market rules given that UUP is in a 'bear market' configuration (50-EMA < 200-EMA) so I don't have complete confidence in the formation. If it plays out as expected, we should see a breakout above the neckline and move about the size of the pattern. That would give UUP an upside target around $24.20-$24.30. The PMO is encouraging.
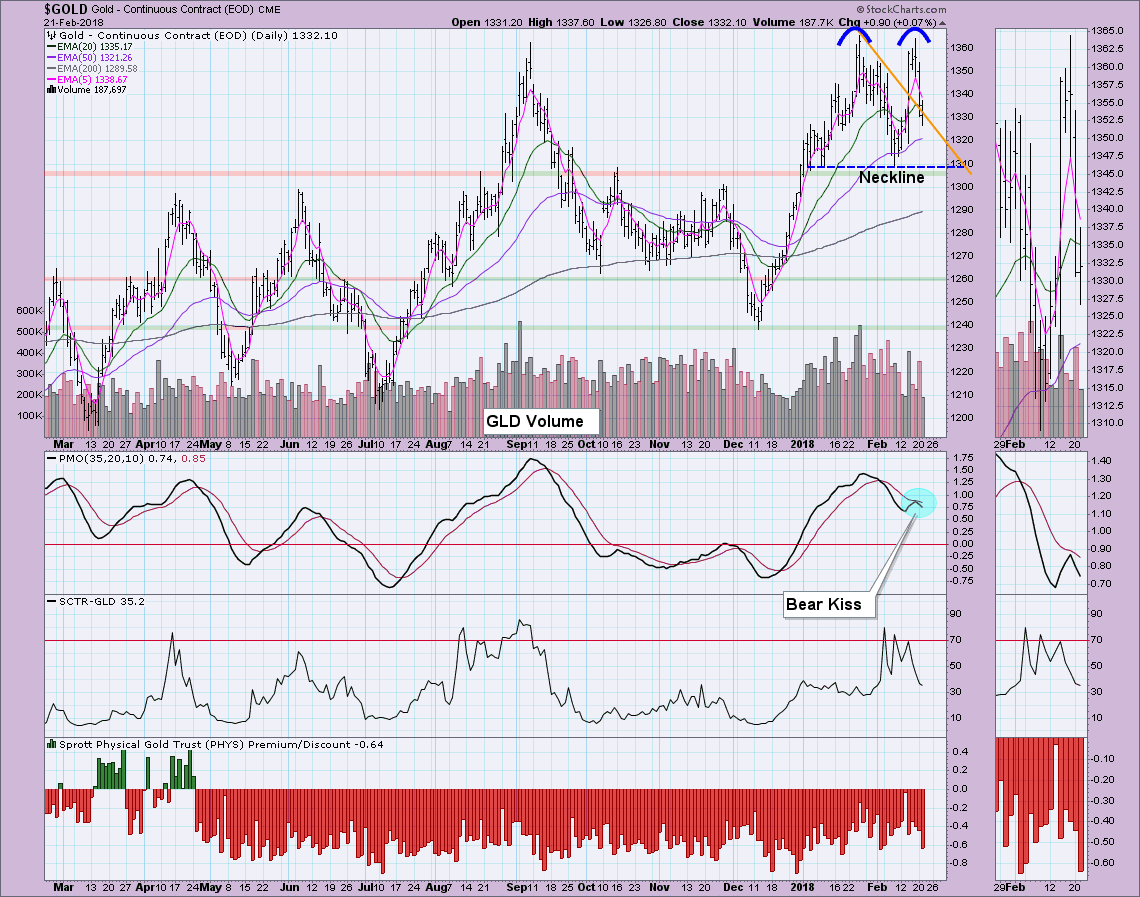
GOLD
IT Trend Model: BUY as of 1/2/2018
LT Trend Model: BUY as of 4/12/2017
I think we are looking at a double-top on Gold. If I'm right, the pattern would execute on a penetration of the neckline. The minimum downside target would be around 1260 which lines up with October lows and the end of February 2017 top. Gold is subject to changes based on the Dollar and if the Dollar rallies I suspect it will, that would grease the slide lower.
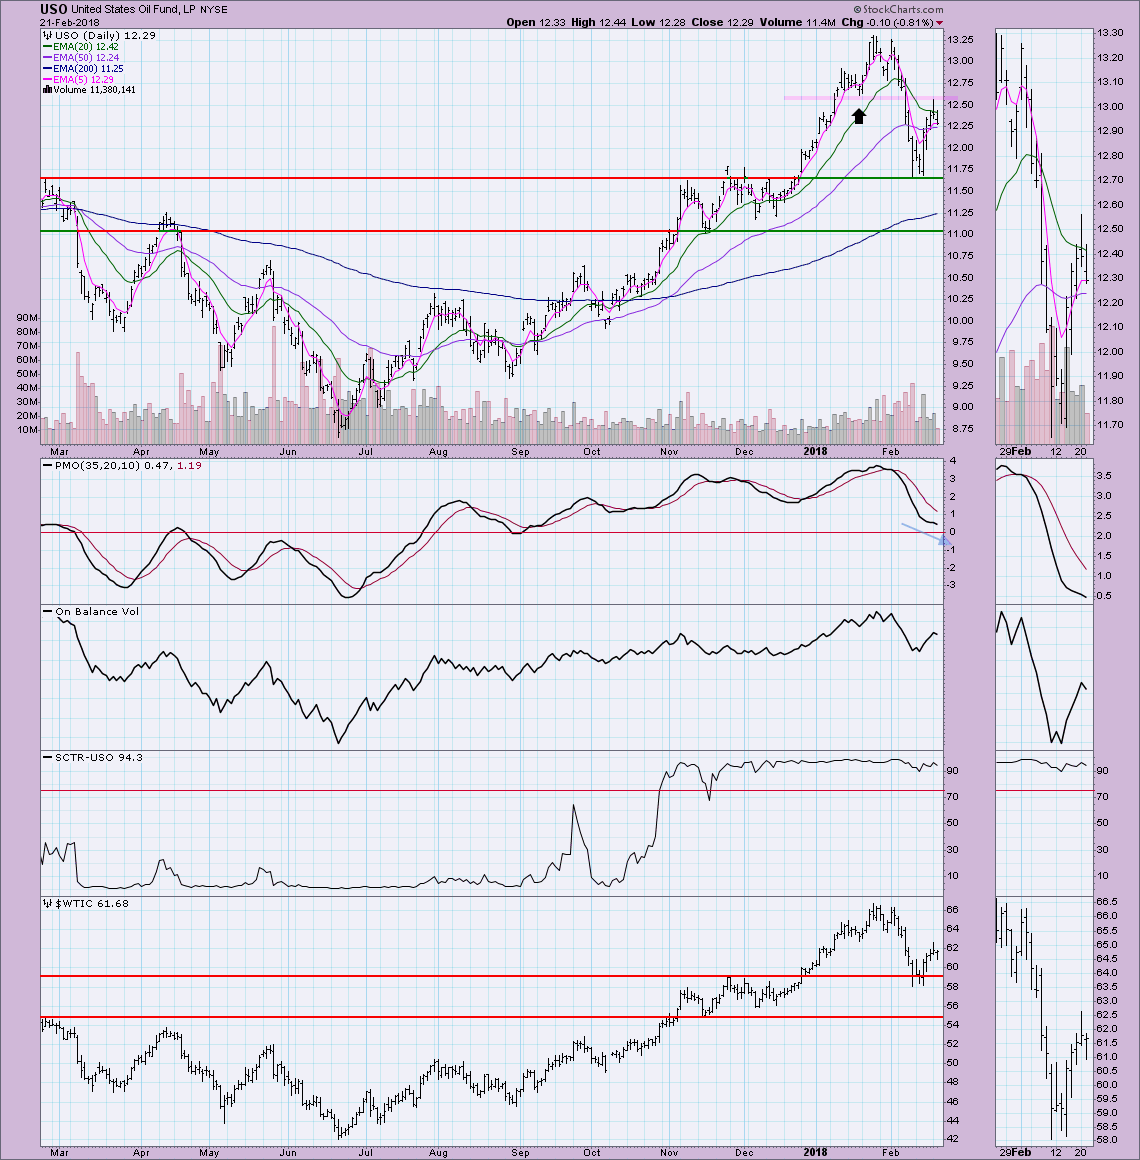
CRUDE OIL (USO)
IT Trend Model: BUY as of 11/2/2017
LT Trend Model: BUY as of 9/7/2017
USO hit overhead resistance at the January bottom that I've annotated. I thought things were looking up when the PMO decelerated and appeared to be bottoming. Unfortunately, overhead resistance was too strong and price moved lower after an unsuccessful test. Price might need to test the previous low.
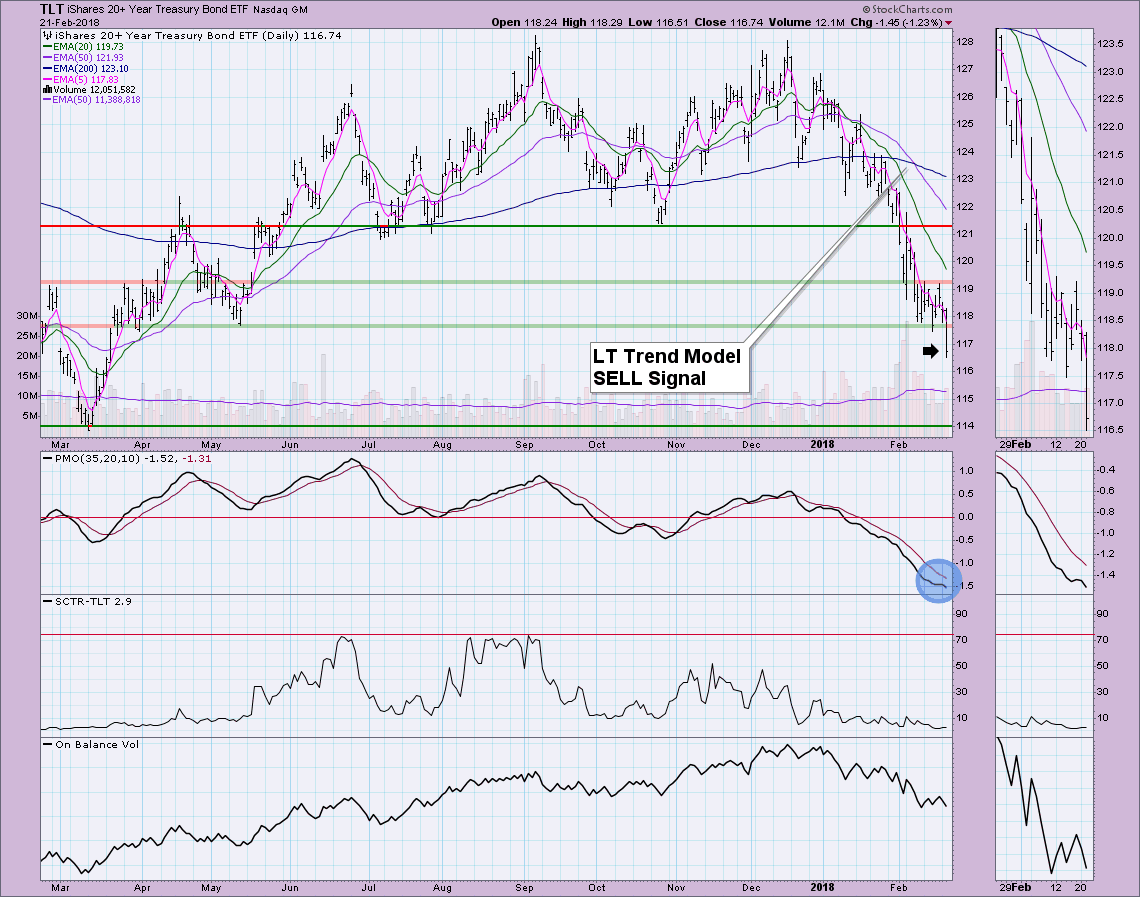
BONDS (TLT)
IT Trend Model: Neutral as of 1/11/2018
LT Trend Model: SELL as of 2/8/2018
TLT was managing to stay in the trading channel this morning, but after the MarketWatchers Show, Bonds tumbled and this put price well-below support. I am still looking for a drop to $114.
Technical Analysis is a windsock, not a crystal ball.
Happy Charting!
Erin
Helpful DecisionPoint Links:
DecisionPoint Shared ChartList and DecisionPoint Chart Gallery
Price Momentum Oscillator (PMO)
Swenlin Trading Oscillators (STO-B and STO-V)
**Don't miss DecisionPoint Commentary! Add your email below to be notified of new updates"**


