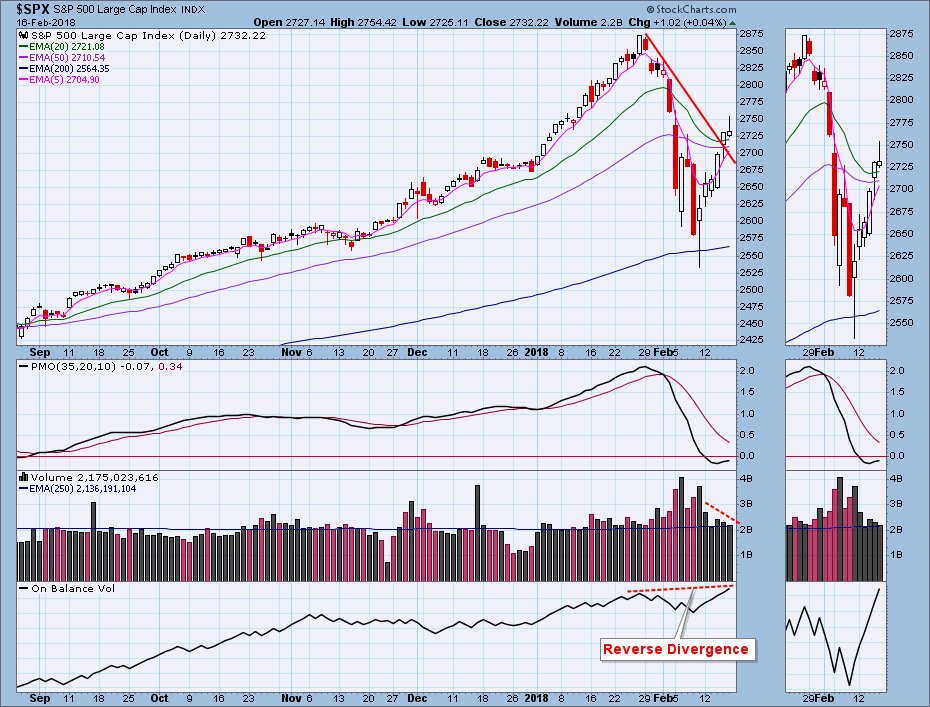
Last Friday the market executed a bullish intraday reversal, and this week it rallied five days straight; however, there were some problems. S&P 500 volume contracted into the rally, and Friday's candlestick was a bearish shooting star. I don't really use candlesticks much, but the shooting star is a fairly reliable sign of a short-term top. Another troublesome issue is the OBV reverse divergence. In this case, price is lower than the January high, while OBV is higher than its January top. A lot of up volume is being expended without a commensurate move in price. Not good.
The DecisionPoint Weekly Wrap presents an end-of-week assessment of the trend and condition of the stock market (S&P 500), the U.S. Dollar, Gold, Crude Oil, and Bonds.
STOCKS
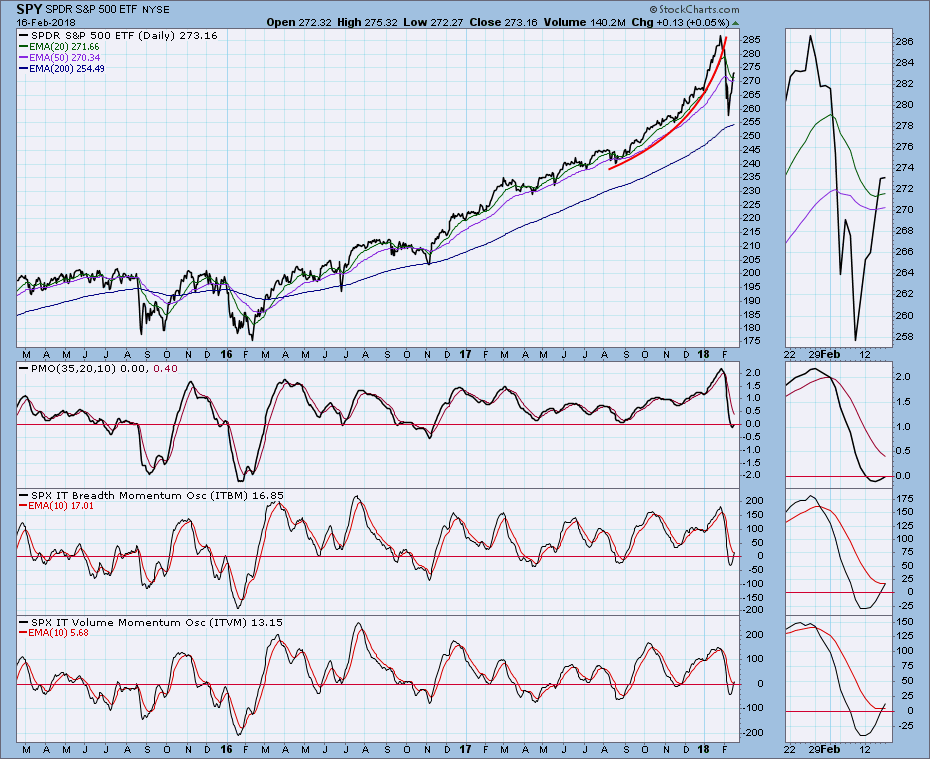
IT Trend Model: BUY as of 11/15/2016
LT Trend Model: BUY as of 4/1/2016
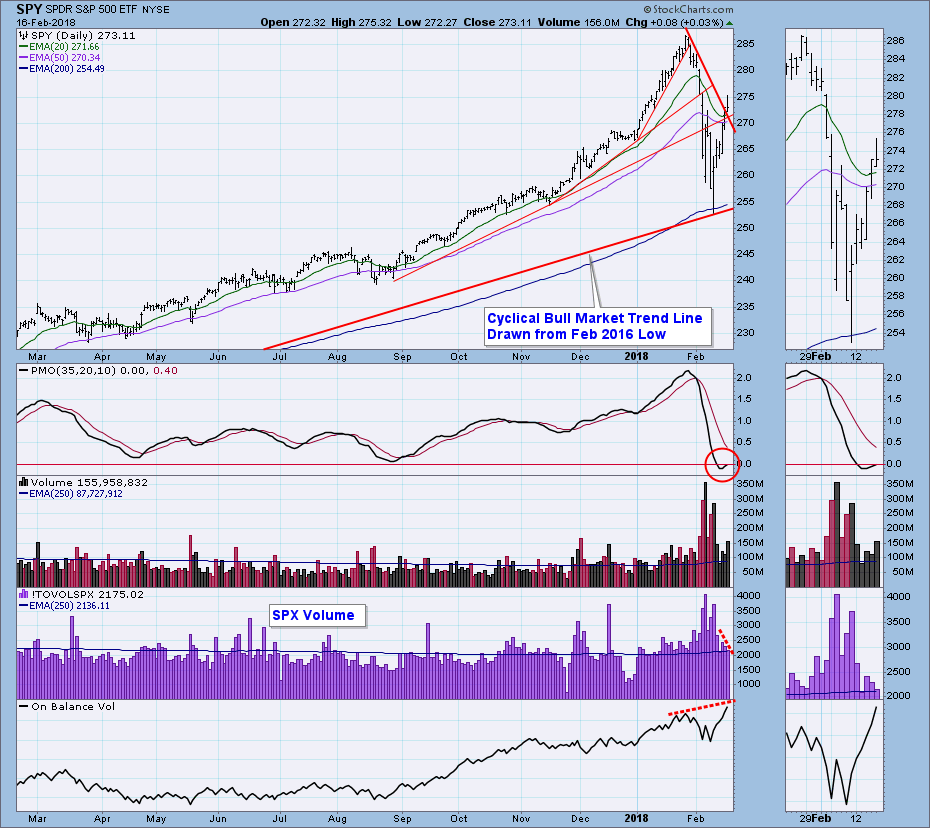
Daily Chart: Not surprisingly, SPY has the same issues as the lead S&P 500 Index chart. I should clarify here that the reverse divergence discussed above is not actually "official" yet, because price and the OBV have not topped yet, but I think that will be taken care of next week.
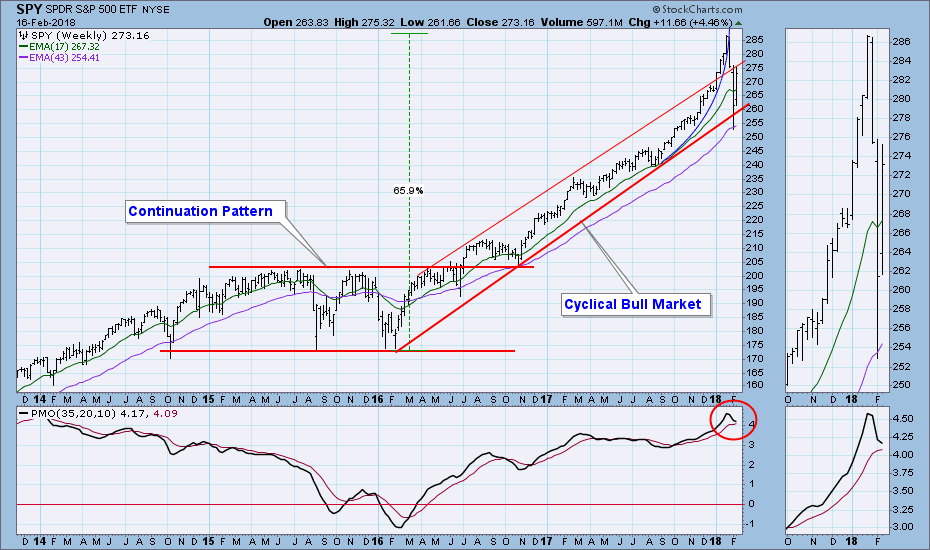
Weekly Chart: Price has not yet abandoned the cyclical bull market rising trend channel, and thanks to this week's rally the PMO decelerated; however, the weekly PMO was very oversold when it topped, so I think we'll see more downside.
Short-Term Market Indicators: Very overbought.
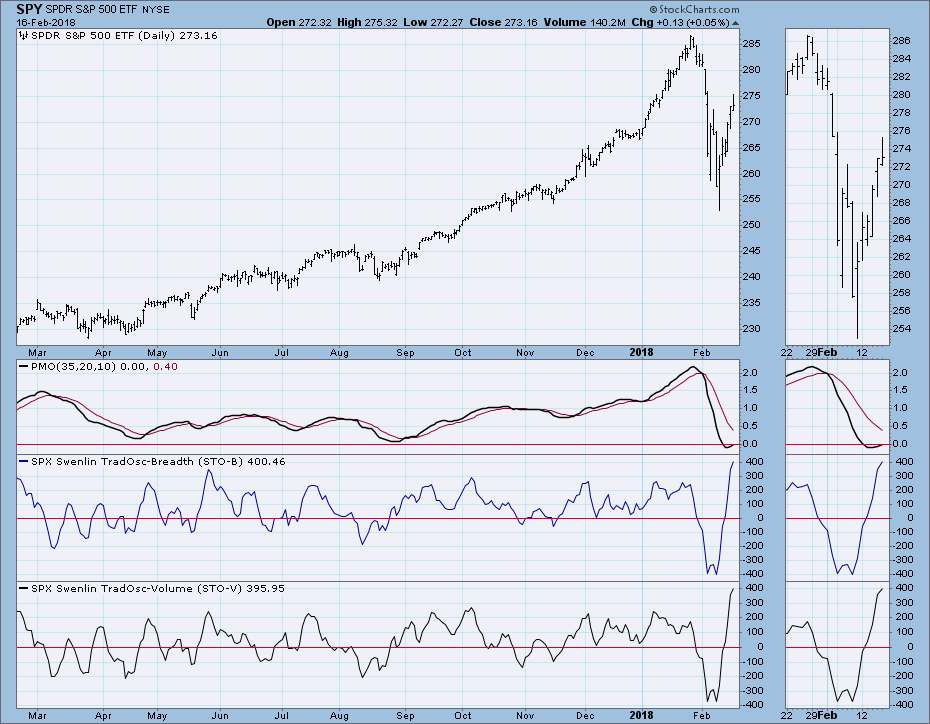
Intermediate-Term Market Indicators: This chart summarizes the situation so well: Parabolic advance, collapse of parabolic, then 50% retracement. Indicators bottomed in neutral zone, but I think that is temporary, and that we have some actual oversold readings coming.
Conclusion: Last week my assertion that a bear market has begun was based upon a two-week decline that had some of the most chaotic market movement I have ever seen, and, in spite of this week's rally, I'm not ready to back down from that assessment. It will still be some time (weeks) before EMA crossovers will confirm the bear market. The only confirmation we have at this point is the weekly PMO top. Short-term indicators that are very overbought, as well as the shooting star candle on Friday make me think that there will be a pullback next week. If the pullback turns into another leg down by taking out last week's low, I would consider that to be indisputable evidence that the bear is in control.
DOLLAR (UUP)
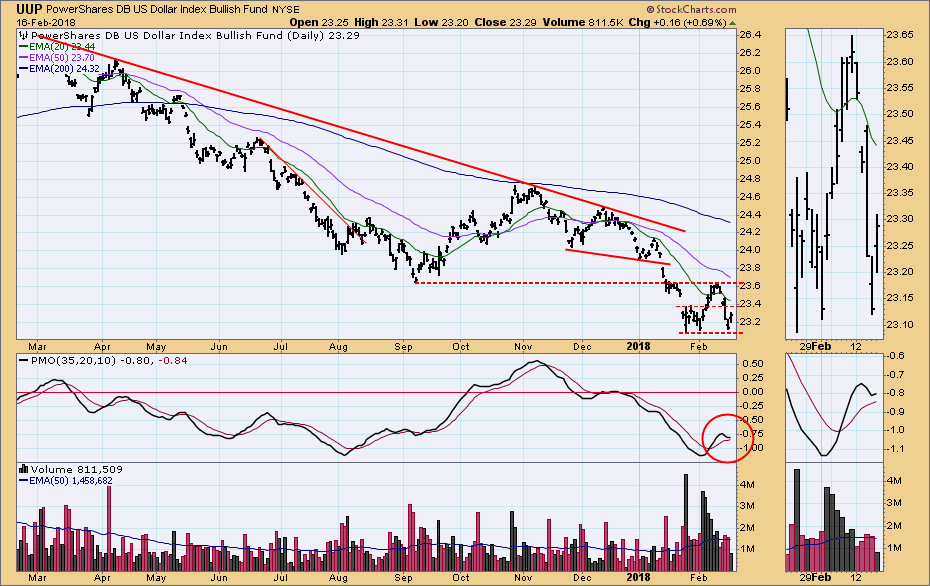
IT Trend Model: SELL as of 12/21/2017
LT Trend Model: SELL as of 5/24/2017
Daily Chart: UUP is locked in a one-month trading range, and this week it bounced off the bottom of the range for the third time. The daily PMO bottomed above the signal line and formed a positive divergence. So we have a few positive signs, but I think the long-term down trend will prevail.
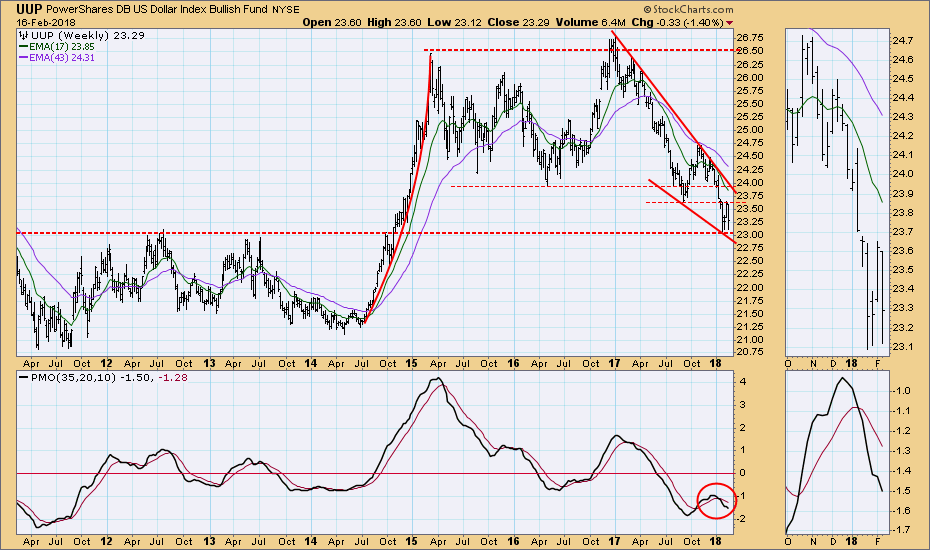
Weekly Chart: The dominant feature on this chart is the falling wedge. The technical expectation is that it will resolve to the upside, but we can see that the initial rally off the bottom of the wedge failed before reaching the top of the wedge. Now the odds are higher that the resolution will be downward.
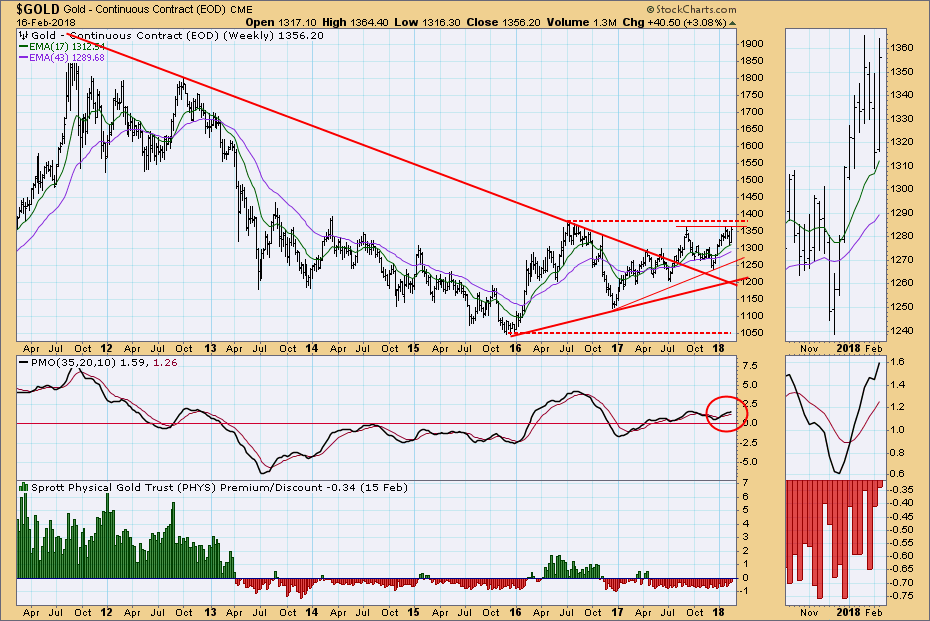
GOLD
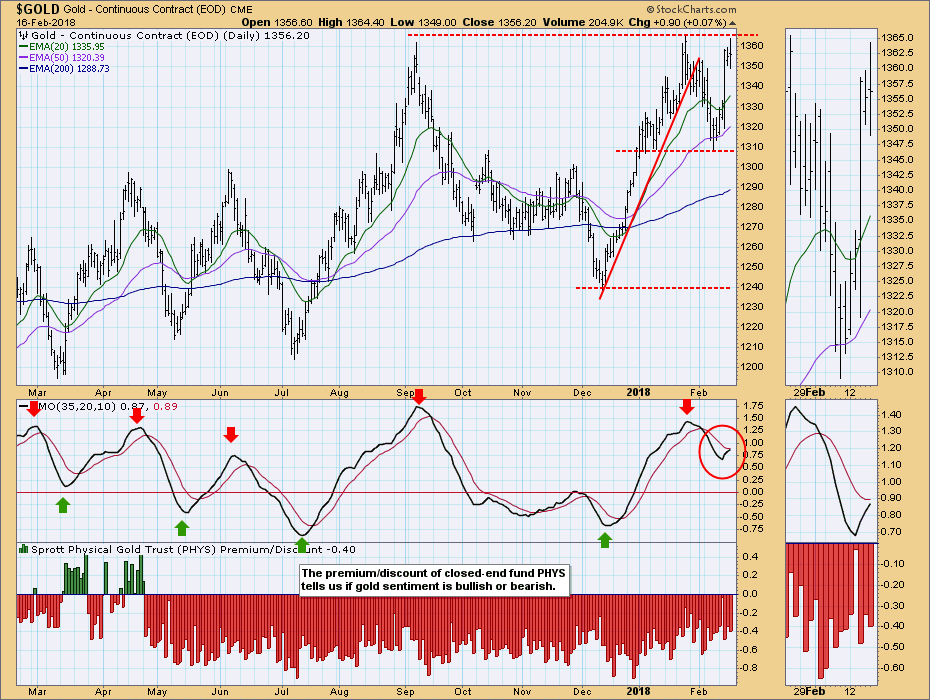
IT Trend Model: BUY as of 1/2/2018
LT Trend Model: BUY as of 4/12/2017
Daily Chart: Gold had a strong one-day up move this week, but so far nothing dramatic has happened to the overall trend, which is still slightly positive. In spite of the promising move, sentiment remains negative.
Weekly Chart: Gold needs to rally above the 2016 high (1377.50) in order for a long-term rising trend to be established.
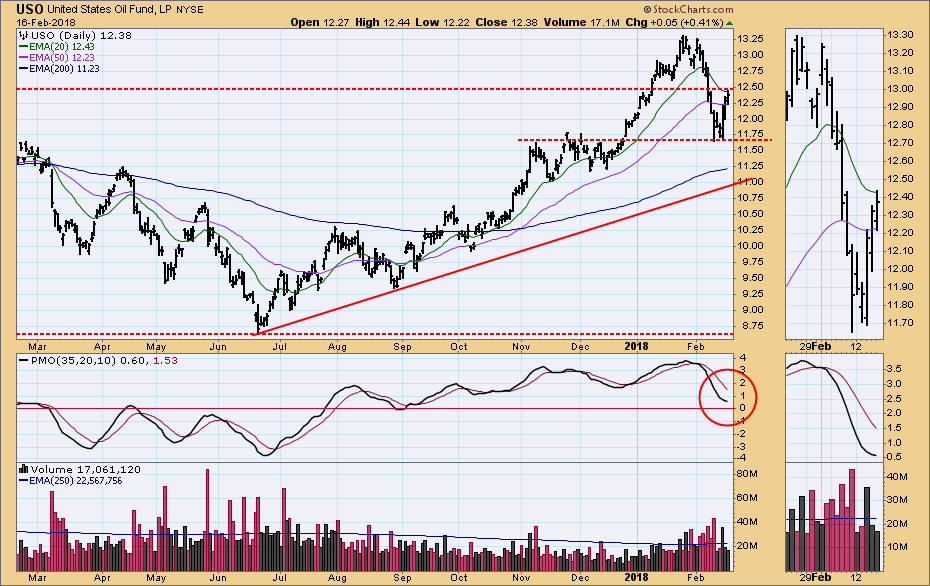
CRUDE OIL (USO)
IT Trend Model: BUY as of 9/6/2017
LT Trend Model: BUY as of 11/2/2017
Daily Chart: Last week USO broke down through the top of the two-year trading channel. This week it rallied back to that previous support, which is now resistance. My assumption is that USO is entering an intermediate-term down trend, but the recent lows need to be taken out in order to establish that down trend.
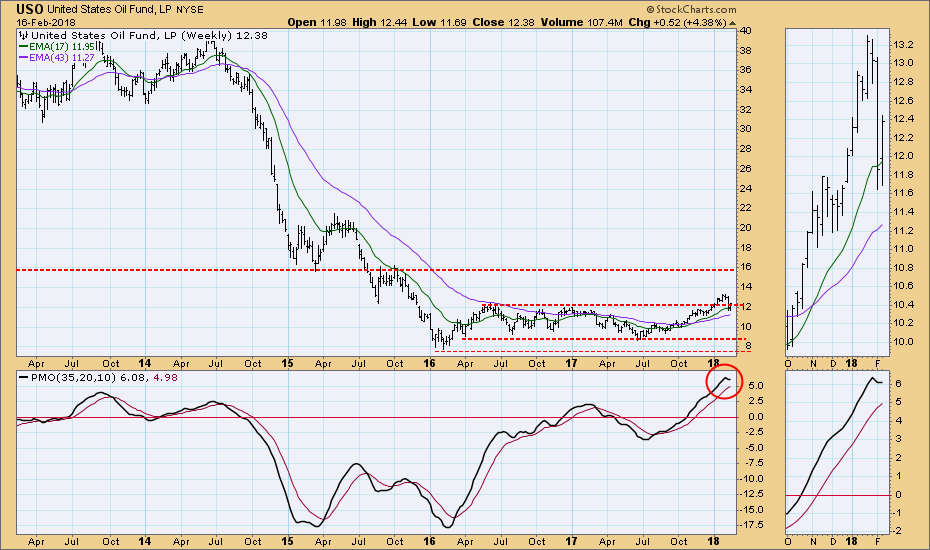
Weekly Chart: The weekly PMO formed a rather abrupt top last week when price broke down. This week's reaction rally caused the PMO to flatten, but I think the bearish die is cast.
BONDS (TLT)
IT Trend Model: NEUTRAL as of 1/11/2018
LT Trend Model: SELL as of 2/8/2018
Daily Chart: TLT officially entered a bear market when the 50EMA crossed down through the 200EMA last week. This week price seemed to be firming, confirmed by the daily PMO going flat, so there may be a reaction rally back to the double top confirmation line, which is now resistance.
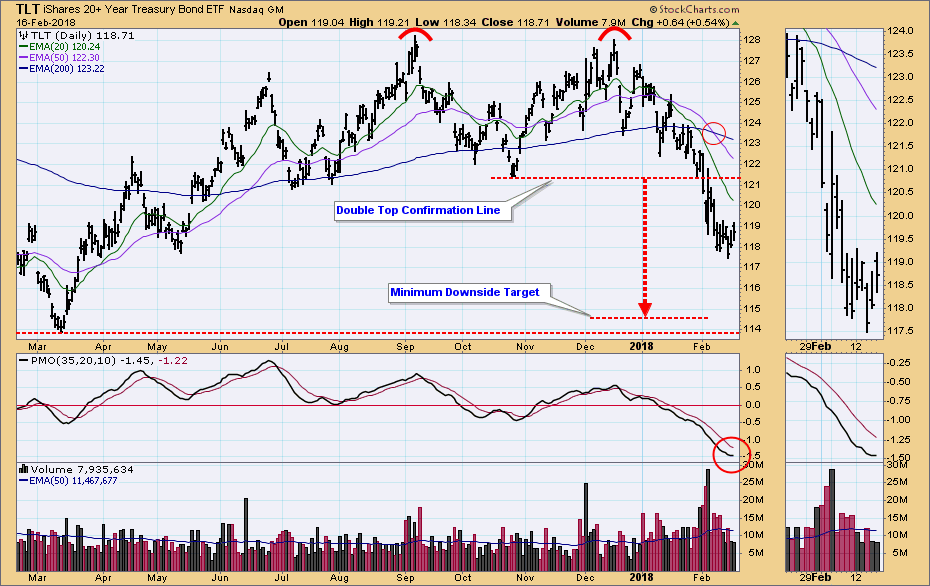
Weekly Chart: The line drawn across the 2016/17 double bottom is the line of support that must be violated to establish a long-term falling trend, but the picture is already bearish as the 17EMA has crossed down through the 43EMA, which is a PMO SELL signal in this time frame.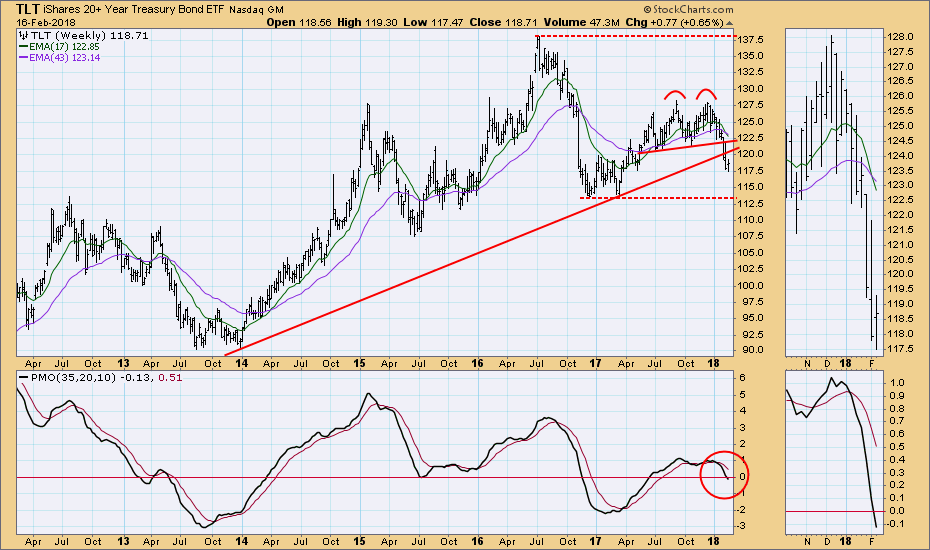
**Don't miss any of the DecisionPoint commentaries! Go to the "Notify Me" box toward the end of this blog page to be notified as soon as they are published.**
Technical Analysis is a windsock, not a crystal ball.
Happy Charting!
- Carl
NOTE: The signal status reported herein is based upon mechanical trading model signals, specifically, the DecisionPoint Trend Model. They define the implied bias of the price index based upon moving average relationships, but they do not necessarily call for a specific action. They are information flags that should prompt chart review. Further, they do not call for continuous buying or selling during the life of the signal. For example, a BUY signal will probably (but not necessarily) return the best results if action is taken soon after the signal is generated. Additional opportunities for buying may be found as price zigzags higher, but the trader must look for optimum entry points. Conversely, exit points to preserve gains (or minimize losses) may be evident before the model mechanically closes the signal.
Helpful DecisionPoint Links:
DecisionPoint Shared ChartList and DecisionPoint Chart Gallery
Price Momentum Oscillator (PMO)
Swenlin Trading Oscillators (STO-B and STO-V)


