
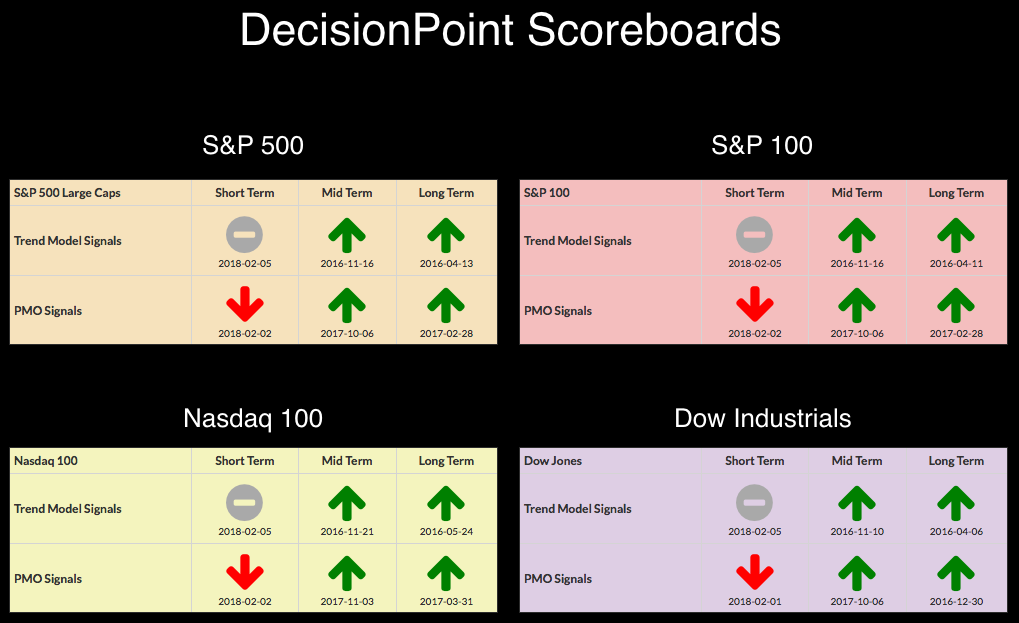
The DecisionPoint Scoreboards didn't show any improvement from last week as the neutral and sell signals remained in the short term. PMO SELL signals are not yet on the weekly charts for these indexes, but they are lining up. If we see a pullback on the recent rally, we will likely see these PMO Sell signals on the Scoreboards this Friday or next. For a look at those charts, go to the DecisionPoint LIVE ChartList.
The purpose of the DecisionPoint Alert Daily Update is to quickly review the day's action, internal condition, and Trend Model status of the broad market (S&P 500), the nine SPDR Sectors, the U.S. Dollar, Gold, Crude Oil, and Bonds. To ensure that using this daily reference will be quick and painless, we are as brief as possible, and sometimes we let a chart speak for itself.
STOCKS
IT Trend Model: BUY as of 11/15/2016
LT Trend Model: BUY as of 4/1/2016
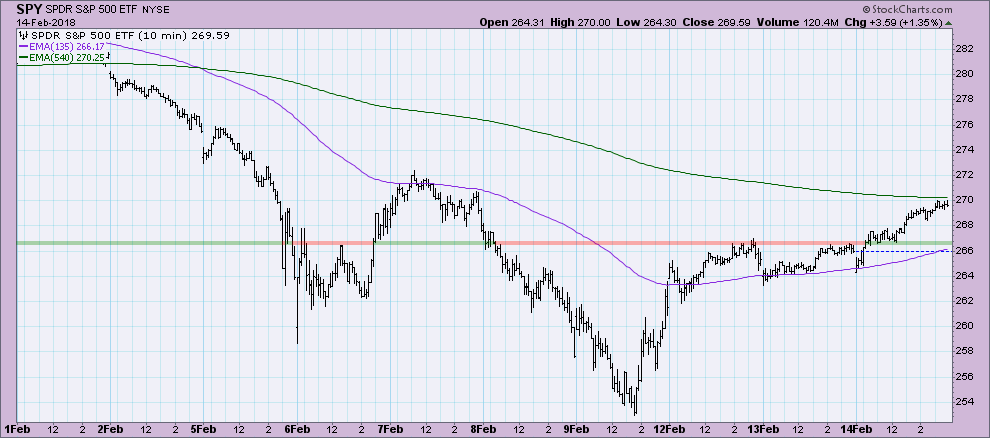
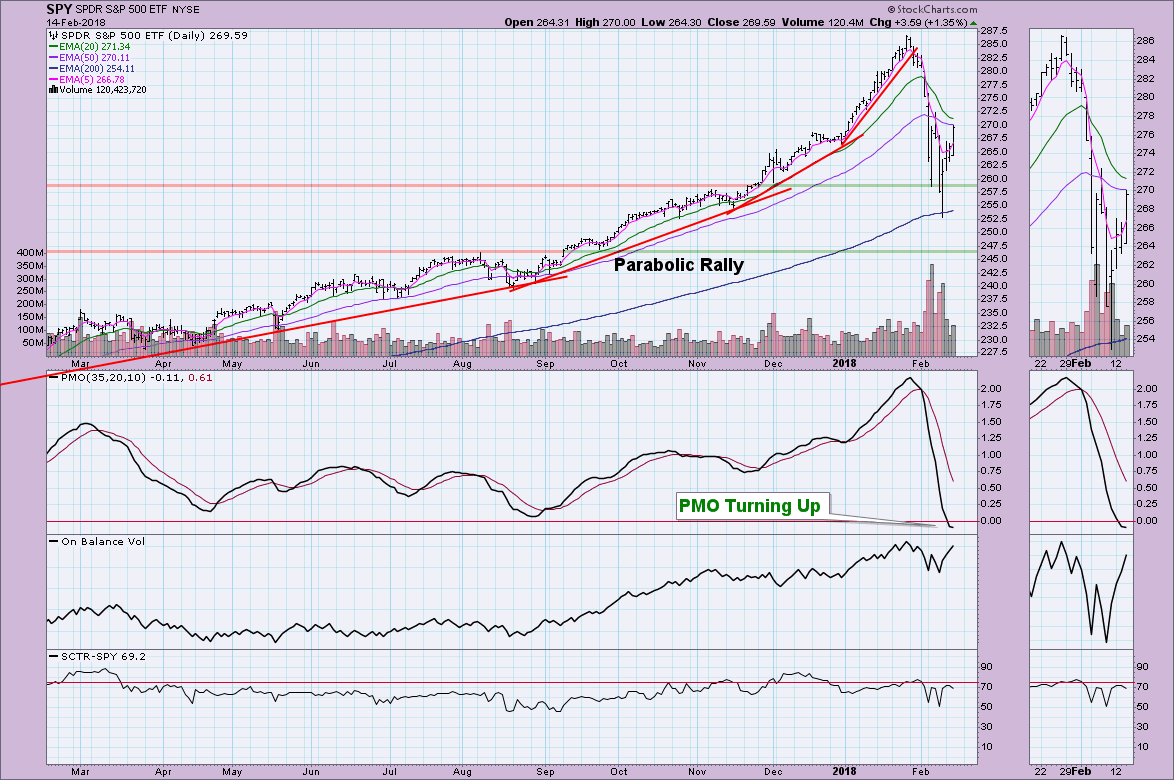
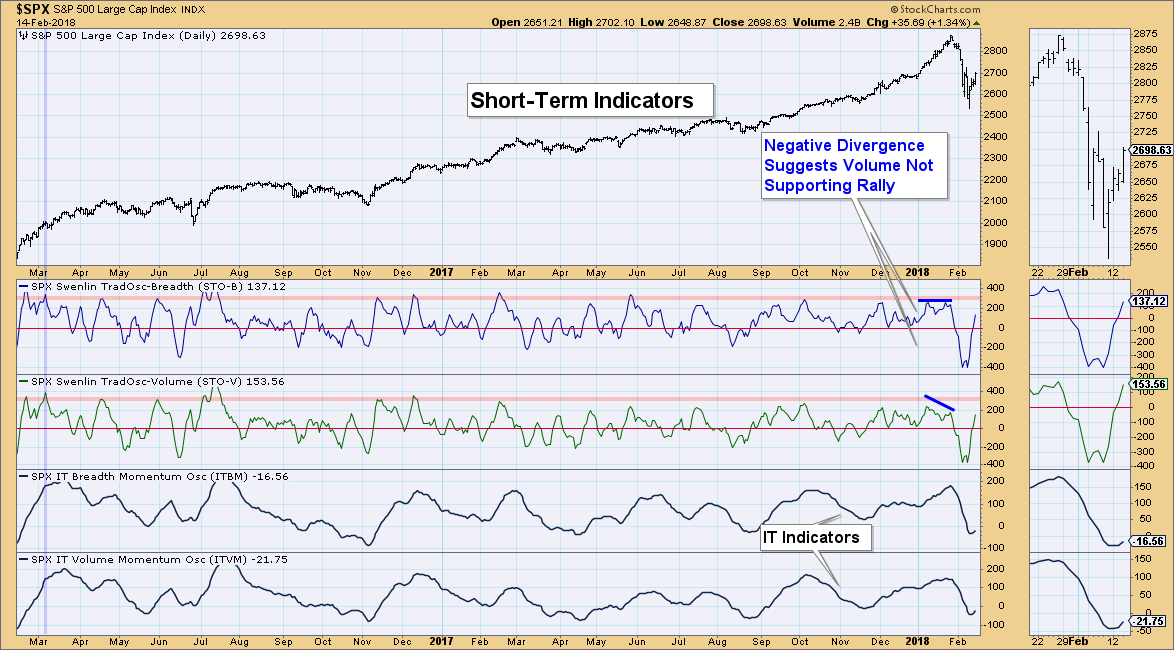
The market has shown improvement since the bottom on Friday, but very little. It appears there was a tiny breakout above resistance today and price did begin rising somewhat. Overall, this isn't that enticing for me to get enthusiastic about a resumption of the bull market rally. Investors are tentative, for good reason.
Today, the PMO began decelerating and looks like it may turn back up. I'd like to see the OBV get above the January top. That would occur with any positive close, most likely. The 50-EMA is now right there as overhead resistance.
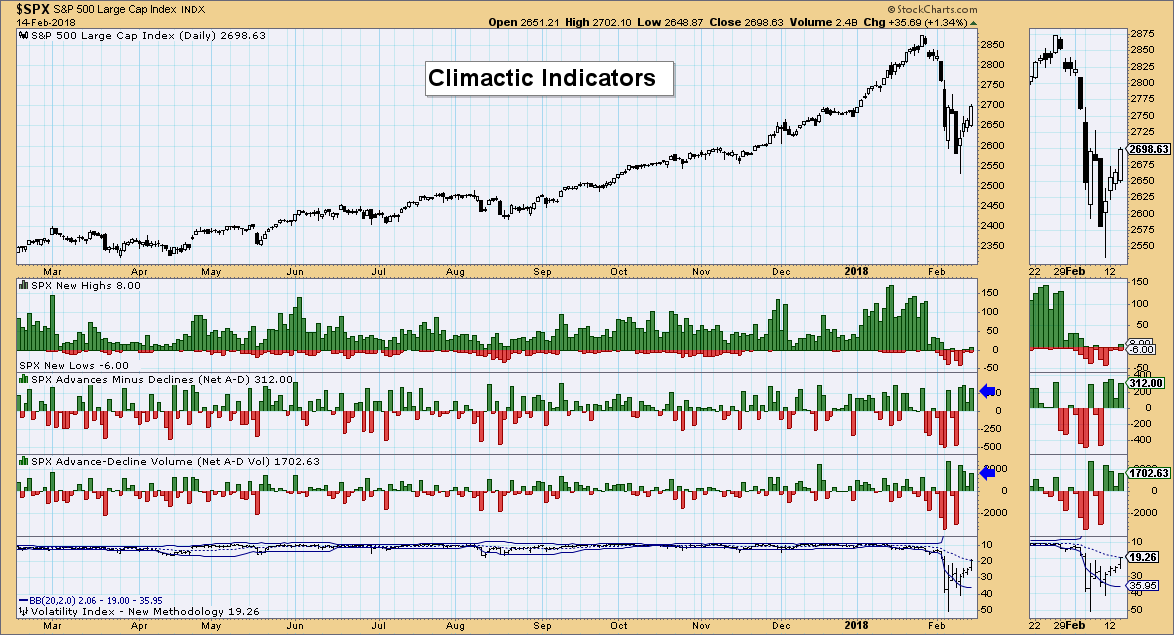
Climactic Indicators:
Breadth today was elevated to the positive side, but the VIX is now centered between its Bollinger Bands. I suspect with all of the positive breadth readings over the past four days that we may see a buying exhaustion which suggests lower prices over the next day or two.
Short-Term Indicators:
These indicators are strongly positive as they have stretched quickly with no hesitation toward overbought territory. You can see they could get overbought very quickly and that would imply a pullback on the way.
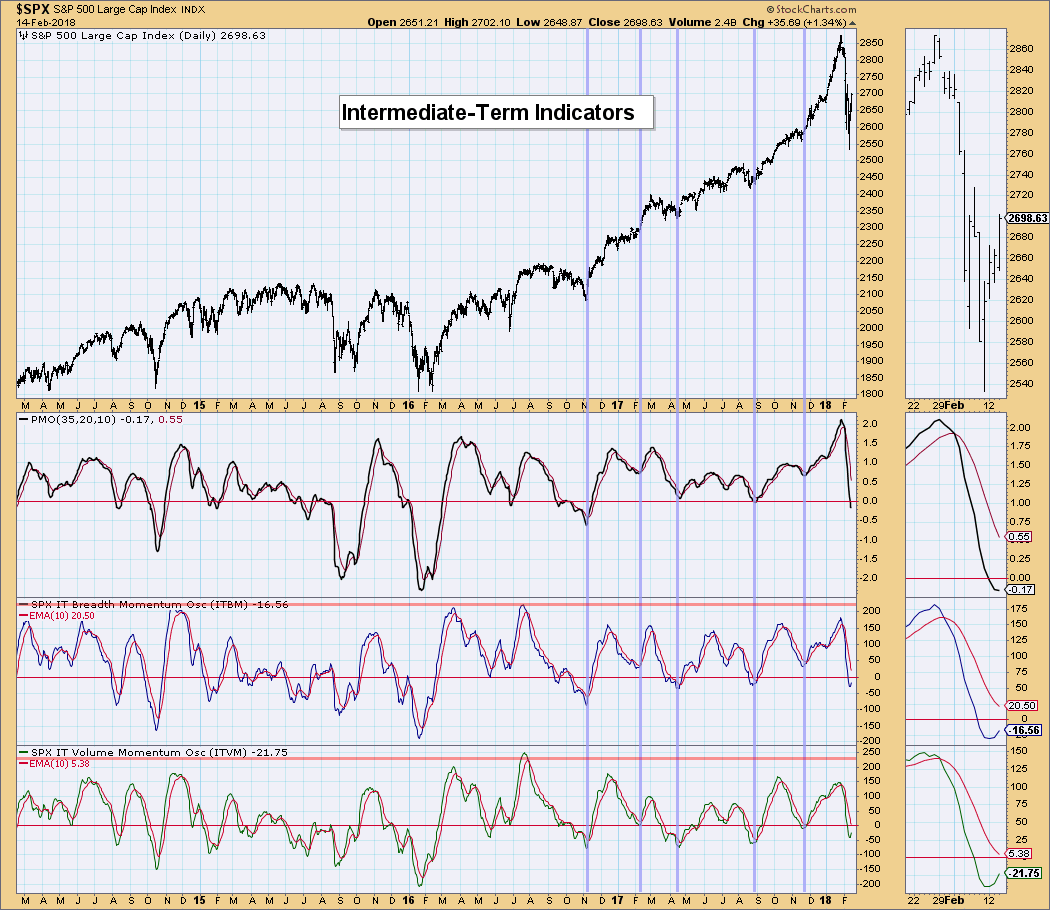
Intermediate-Term Indicators:
As you probably noticed on the chart above, the IT indicators have bottomed and are now rising which is generally bullish for the intermediate term. However, I'm usually not convinced until I see crossovers above the signal lines.
Conclusion:
Indicators are very encouraging as they are now rising in tandem. However, with ST indicators getting quite overbought and no positive crossovers for IT indicators, I'm still of the mindset that we will see this current rally fade before it gets rolling again after testing last week's low. As I said, investors are tentative but not completely discouraged. The big money is likely enticing individual investors on this current rally before they go into distribution mode. Stay cautious.
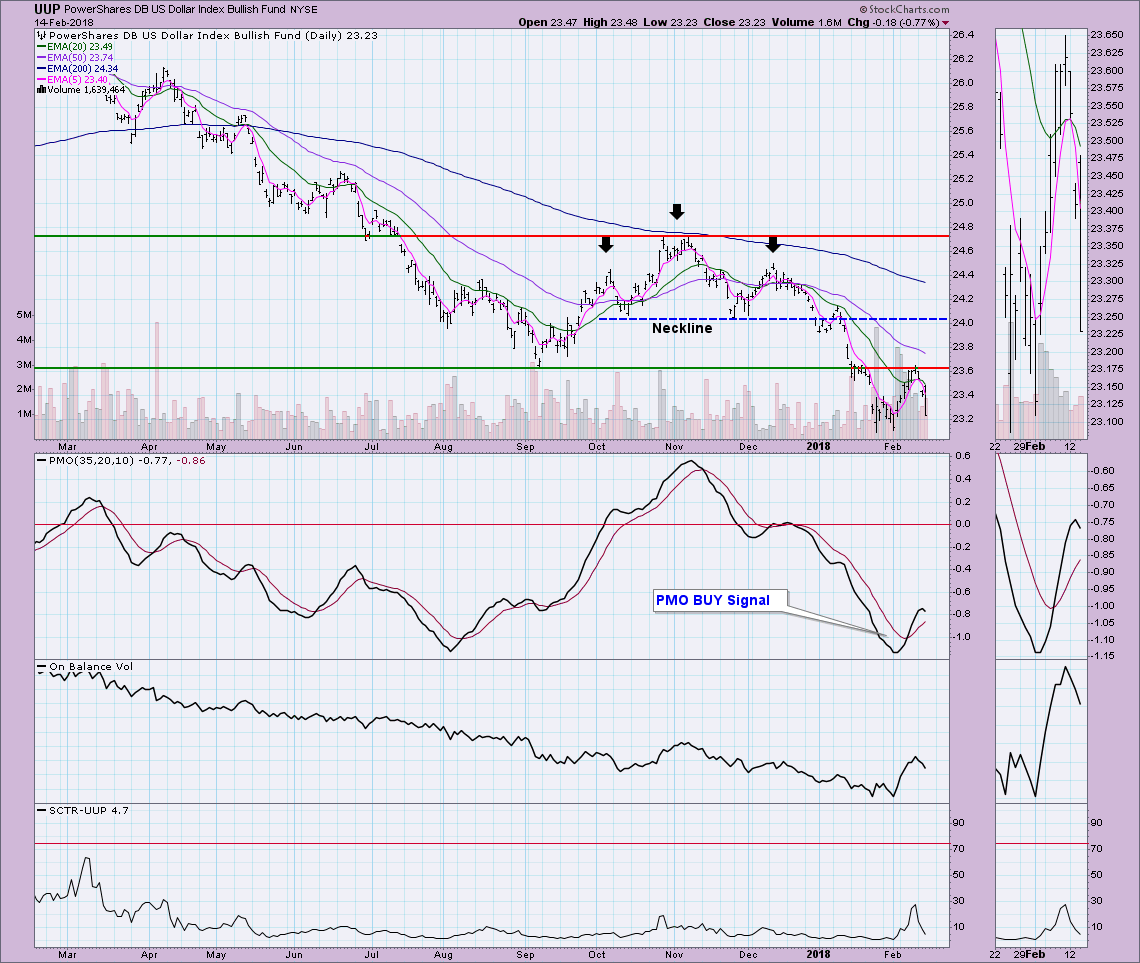
DOLLAR
IT Trend Model: SELL as of 12/21/2017
LT Trend Model: SELL as of 05/24/2017
UUP failed at resistance drawn from the September low and appears ready to test the January low again. Despite the oversold PMO BUY signal, price is dropping quickly. I was thinking we'd see price hold support, but all three indicator windows are quite bearish.
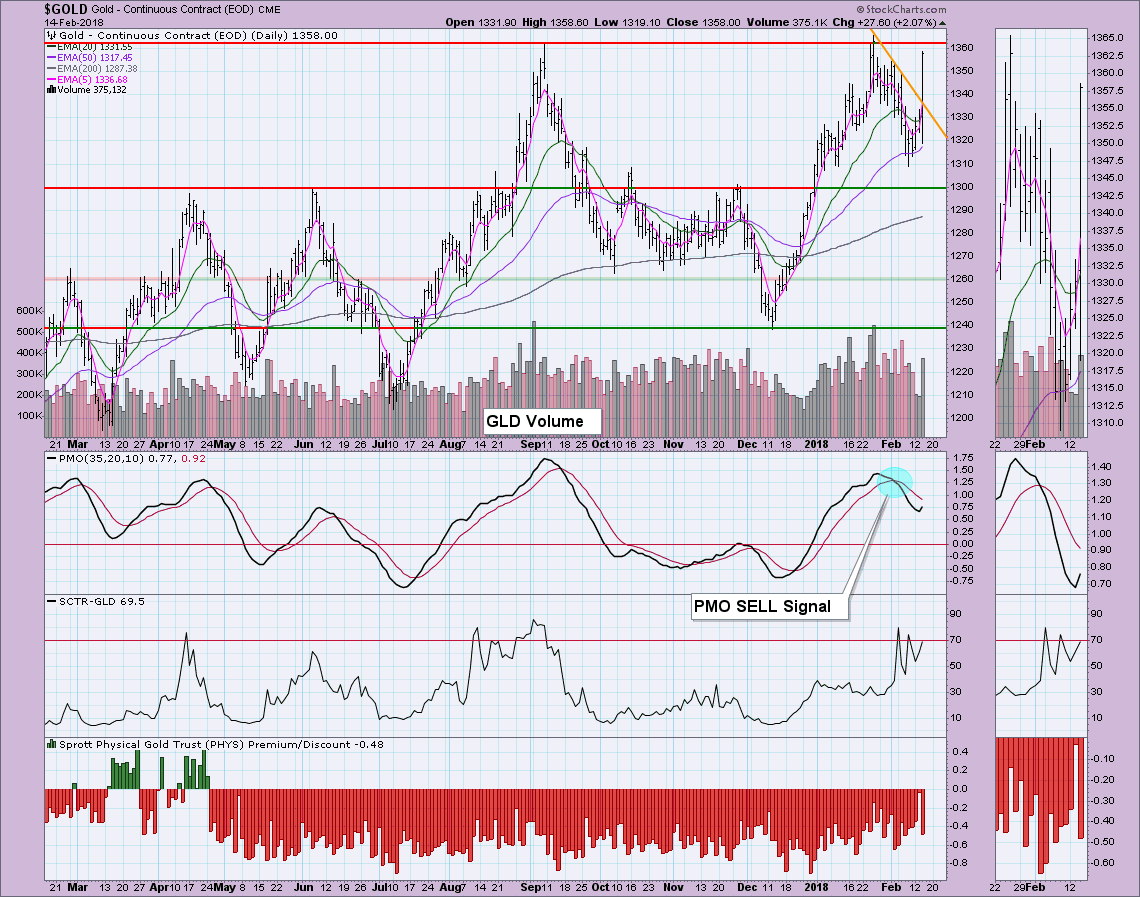
GOLD
IT Trend Model: BUY as of 1/2/2018
LT Trend Model: BUY as of 4/12/2017
With the Dollar tanking today, Gold was the recipient of much higher prices with a 2% move to the upside! Like the Dollar, the PMO was affected by the big move and in the case of Gold, was pulled upward. Resistance is strong at the $1360 level and I suspect the Dollar will bounce from its January lows. Should the Dollar regain strength, we will likely see Gold resume its pullback. I think it is concerning to see such a drop in the market and not much of a move by investors into Gold until today (based on volume for GLD). If we see Gold pop past overhead resistance, then I'd say we have people coming in for shelter from the storm and that would be bullish. At this point, I'm not convinced we are headed to territory much past current overhead resistance, but the PMO is waving a large attention flag that it is possible.
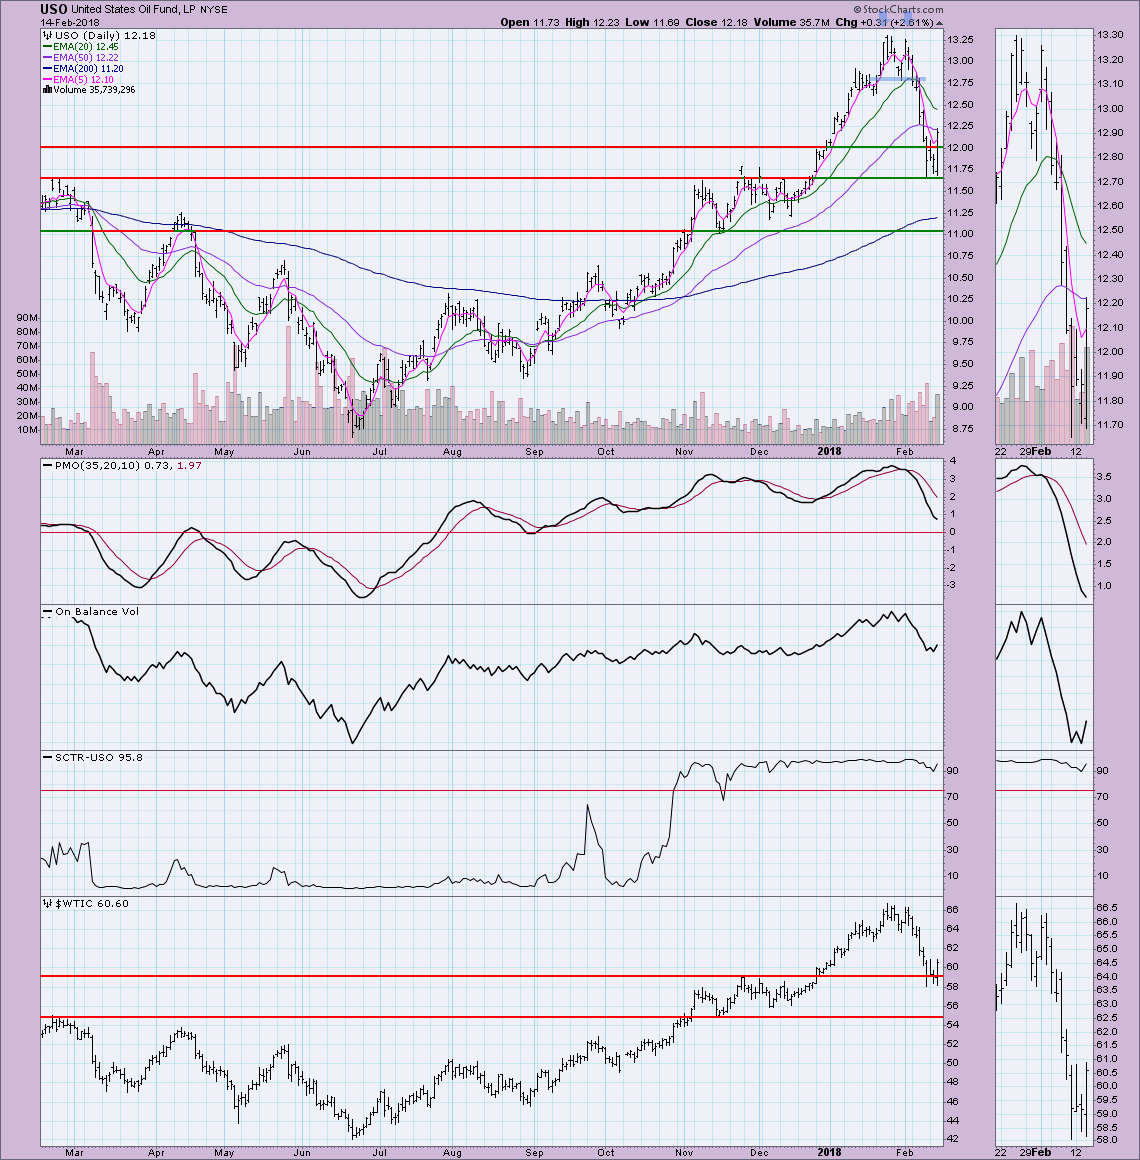
CRUDE OIL (USO)
IT Trend Model: BUY as of 11/2/2017
LT Trend Model: BUY as of 9/7/2017
Oil has found support and I suspect it will hold up when I look at both USO and $WTIC. The PMO is still falling, but could be decelerating a bit. The double-top formation executed and price fell well below the minimum downside target of $12 so it makes sense that support is being found now. I'll get bullish Oil when I see the PMO turn up. For now I'm neutral on USO.
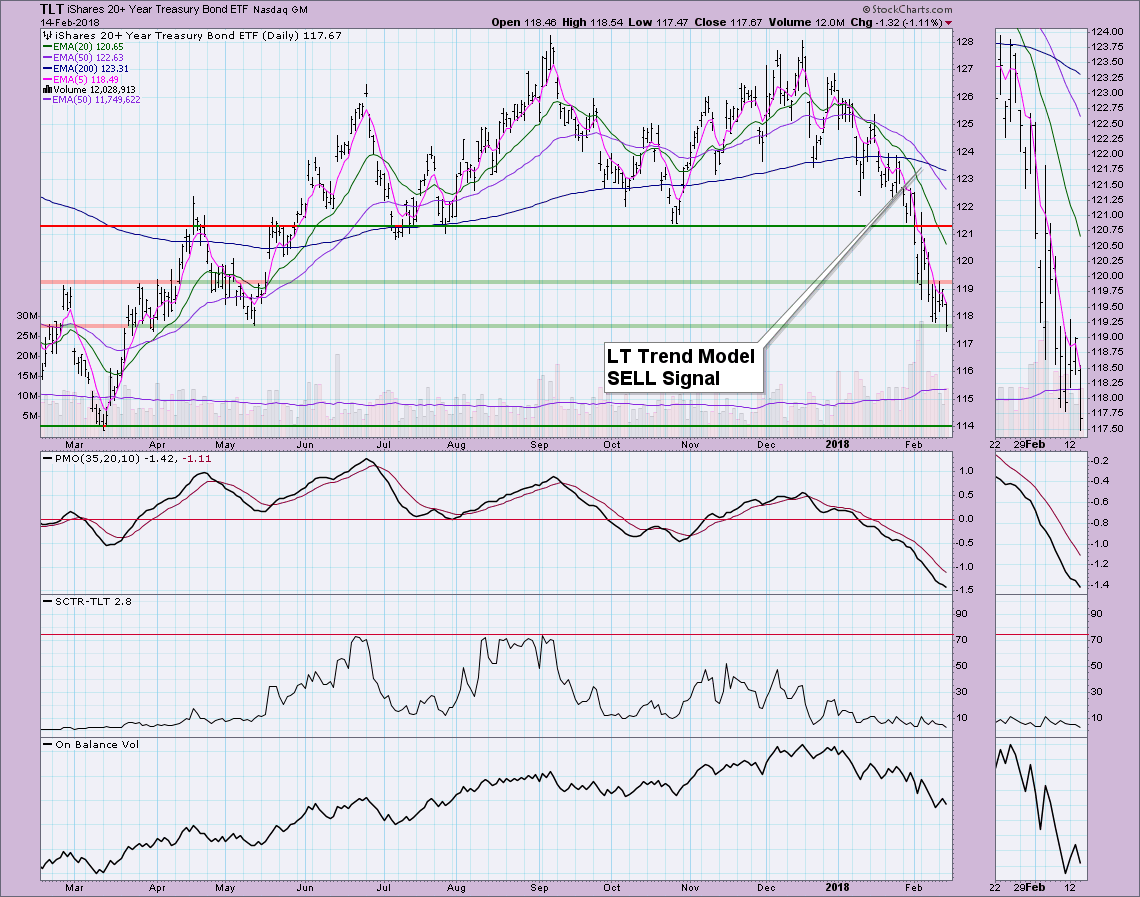
BONDS (TLT)
IT Trend Model: Neutral as of 1/11/2018
LT Trend Model: SELL as of 2/8/2018
Bonds really want to hold support, but I don't think it will. The downside target from the executed double-top formation is at $114. I still expect it to test that level.
Technical Analysis is a windsock, not a crystal ball.
Happy Charting!
Erin
Helpful DecisionPoint Links:
DecisionPoint Shared ChartList and DecisionPoint Chart Gallery
Price Momentum Oscillator (PMO)
Swenlin Trading Oscillators (STO-B and STO-V)
**Don't miss DecisionPoint Commentary! Add your email below to be notified of new updates"**


