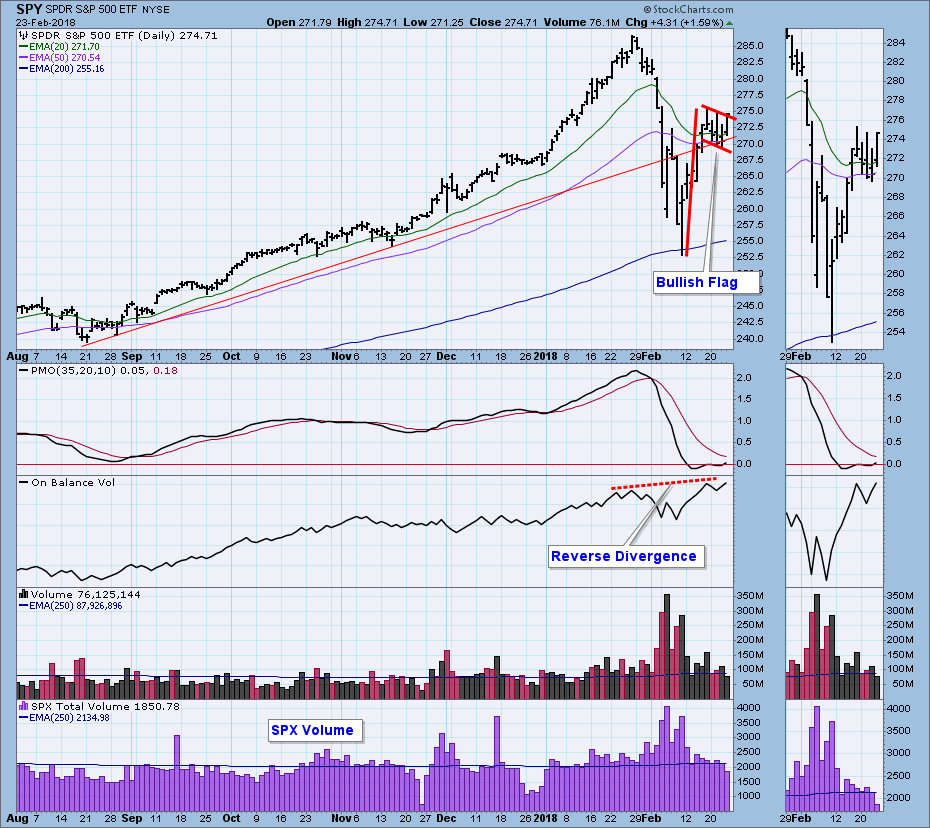
Nothing has happened this week to support my belief that we are in a bear market. If the market were in that much trouble, it seems to me that this week it should have headed lower. Instead, it has consolidated and formed a bullish flag formation. If the flag fulfills the technical expectation, price will move up and challenge the all-time highs set in January. If I'm right about the bear market, that's not going to happen.
The DecisionPoint Weekly Wrap presents an end-of-week assessment of the trend and condition of the stock market (S&P 500), the U.S. Dollar, Gold, Crude Oil, and Bonds.
STOCKS
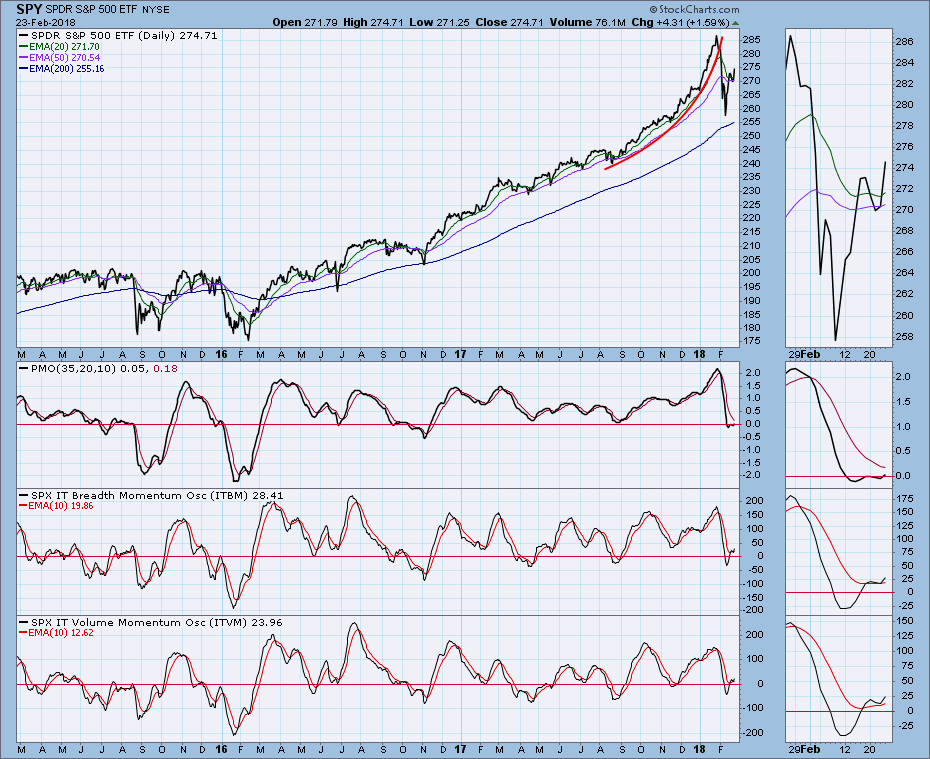
IT Trend Model: BUY as of 11/15/2016
LT Trend Model: BUY as of 4/1/2016
Daily Chart: Two immediate pieces of evidence are the bullish flag formation and the bearish OBV reverse divergence. The latter tells us that huge volume has not succeeded in driving price to to challenge the January high. Also, the daily PMO has a double bottom, which favors a bullish outcome. On Friday price actually poked its nose above the top of the flag, but accompanying volume was only 87% of the one-year average. This does not exude confidence.
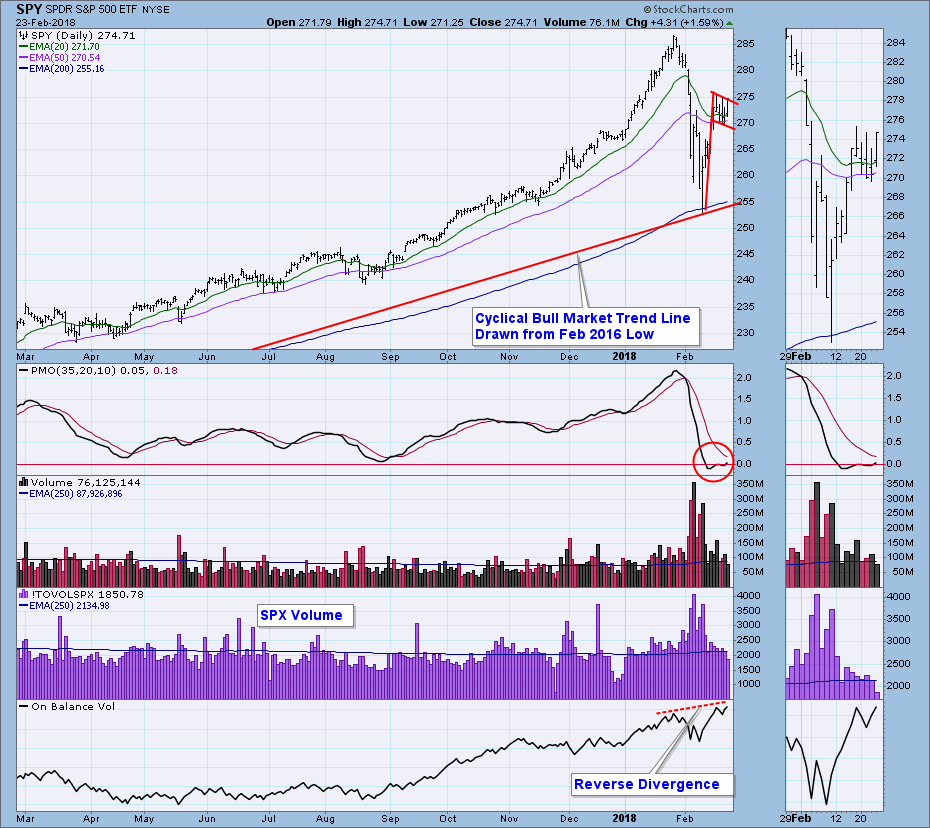
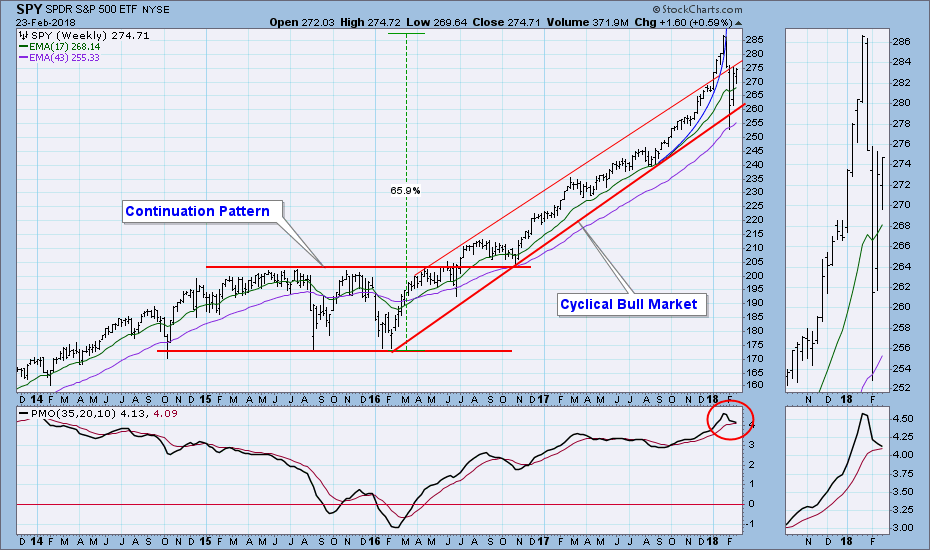
Weekly Chart: Price is still contained within the cyclical bull market rising trend channel, but the weekly PMO has topped and is about to cross down through the signal line. The big problem is that I don't think that the repercussions of the parabolic collapse have been fully worked out.
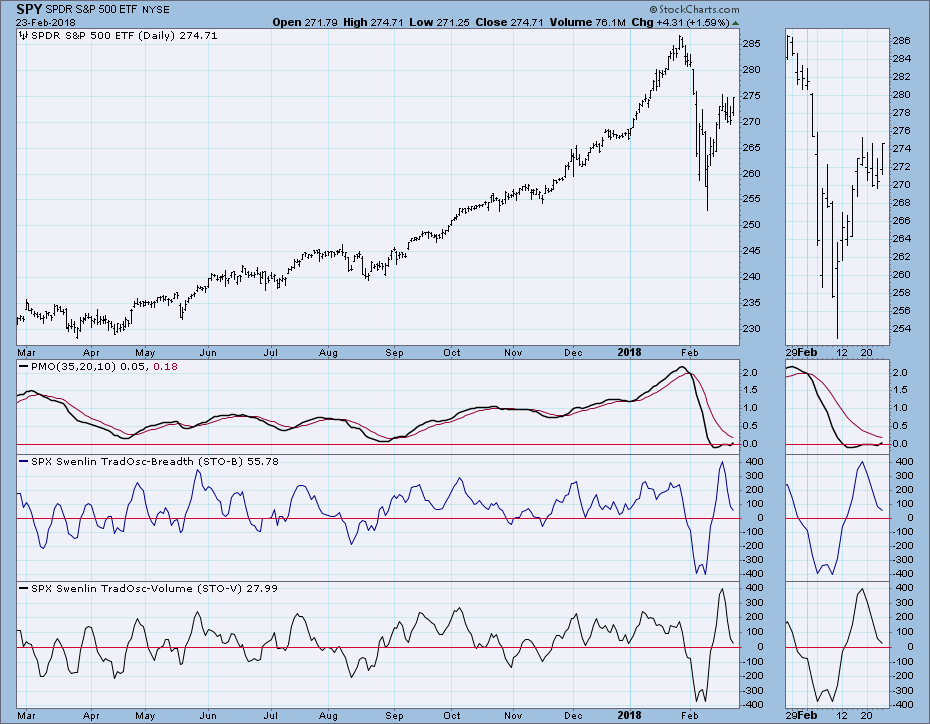
Short-Term Market Indicators: Last week the STO-B and STO-V became very overbought, and it was most likely that they would unwind this week. And so they did. Here is a good example of how complete lack of upward price progress will cause these indicators to move back to the zero line. That is not a negative sign at this point. It's just math, and they are not likely to go very far below the zero line unless price heads lower.
Intermediate-Term Market Indicators: Last week the ITBM and ITVM bottomed close to the zero line, a level that for the last two years has actually been considered oversold. This week they moved slightly higher while the market churned. There is plenty of room to accommodate further market decline, and conversely, the market could rally again before the indicators become overbought.
Conclusion: I remain bearish and I don't think that buying into this bounce is a good idea. The basis for my being bearish is the parabolic collapse from the January price top. Price action during that decline was more erratic than I have ever seen, and I don't think the reverberations are over. Frankly, that is pretty thin evidence, and the weekly PMO top is the only other traditional intermediate-term indicator that backs it up. At any rate, I think all will be resolved next week.
DOLLAR (UUP)
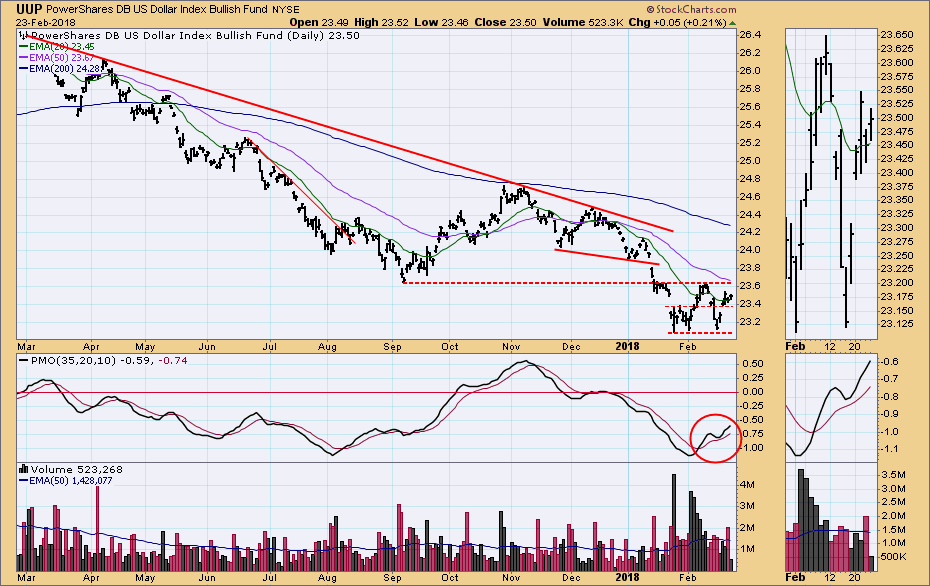
IT Trend Model: SELL as of 12/21/2017
LT Trend Model: SELL as of 5/24/2017
Daily Chart: In January UUP attempted to rally to the top of the falling wedge formation; however, when the rally fizzled and price moved back toward the bottom of the wedge, the expected outcome was negative. This expectation was quickly fulfilled as important support levels were violated. Because the LT Trend Model is on a SELL, we should expect a bearish resolution from the current trading range.
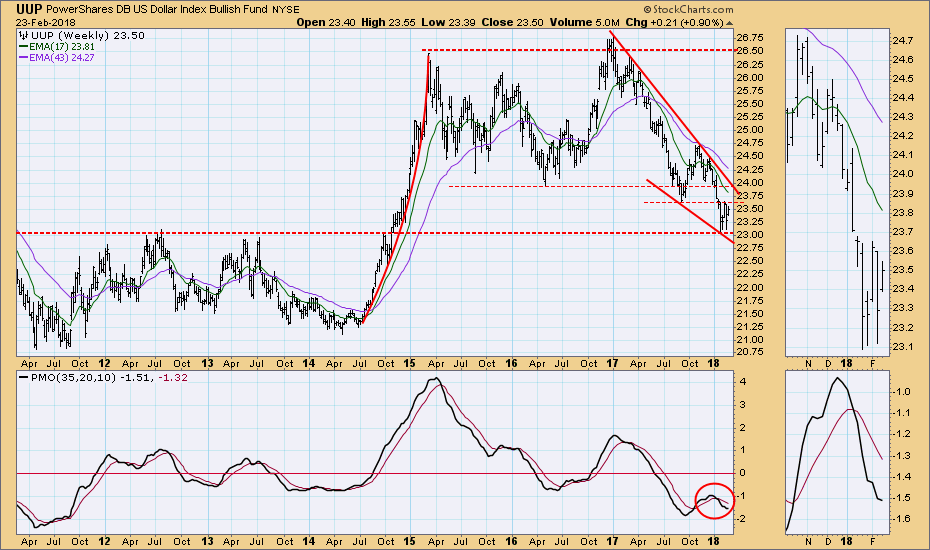
Weekly Chart: The falling wedge is bullish, but, as we learned from the daily chart above, UUP's failure to rally to the top of the wedge is bearish.
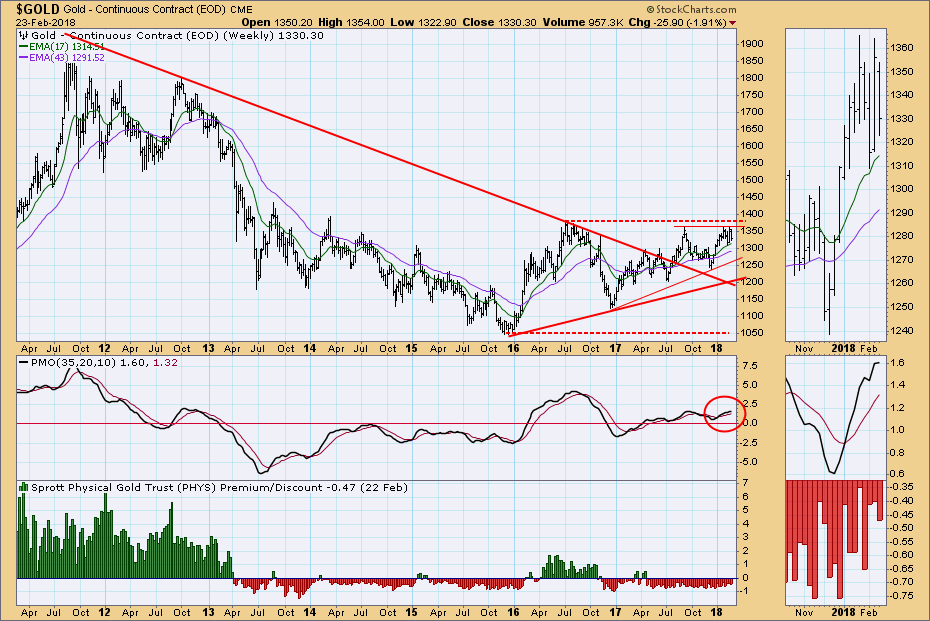
GOLD
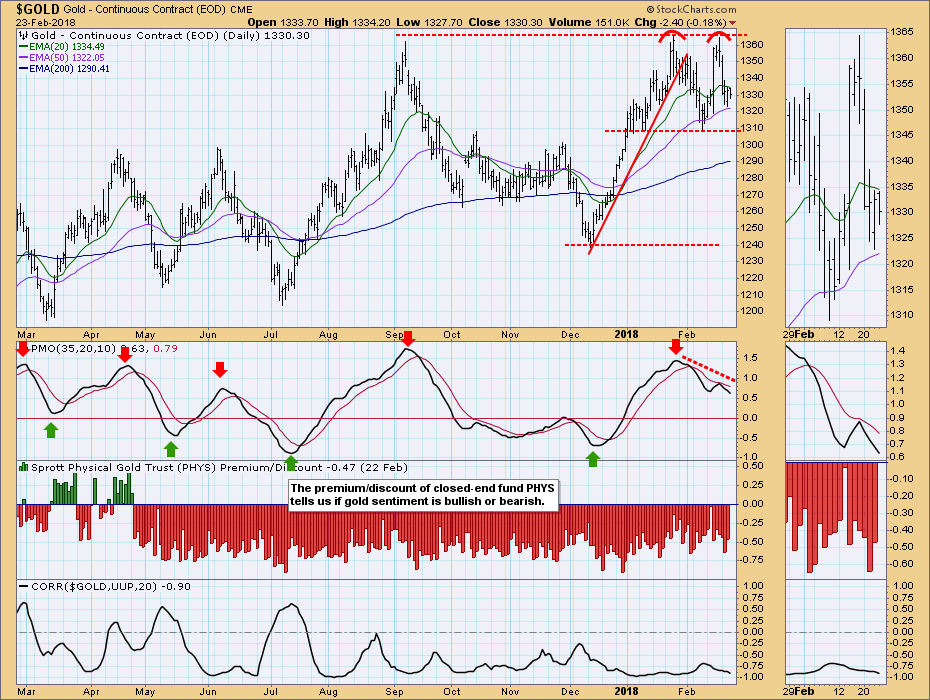
IT Trend Model: BUY as of 1/2/2018
LT Trend Model: BUY as of 4/12/2017
Daily Chart: Gold barely extended last week's rally, then it reversed sharply. We now have a double top a PMO negative divergence, the daily PMO having topped below the signal line. I assume that gold is in for more churning and possibly whipsaw signal changes.
Weekly Chart: The weekly PMO has been above the zero line and moving sideways for about six months. That combine with the fact that the 17EMA is above the 43EMA makes this chart bullish. If overhead resistance can be overcome, it would be a lot more bullish.
CRUDE OIL (USO)
IT Trend Model: BUY as of 9/6/2017
LT Trend Model: BUY as of 11/2/2017
Daily Chart: The daily PMO has bottomed in the neutral zone, so there is plenty of room for the rally to continue before the PMO is oversold again.
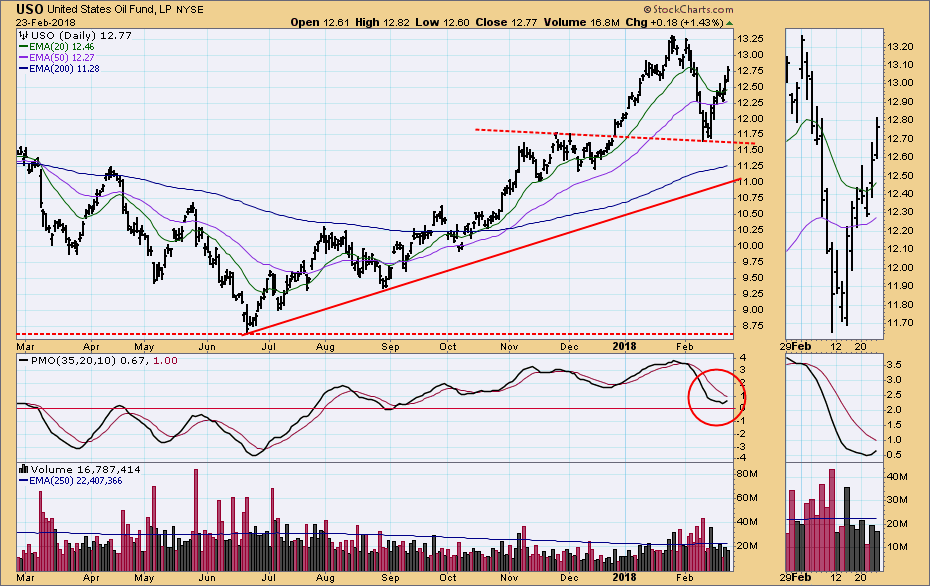
Weekly Chart: If you regularly follow this section, you will notice that I have redefined the top of the trading range so that it provides a more rational context for the price action of the last two months. Now we can see the breakout through the top of the trading range, a pullback, then the resumption of the rally. The weekly PMO, which had topped last week, turned back up this week. Assuming that USO rallies up to the most obvious resistance (~16), that would have crude at about $78/barrel.

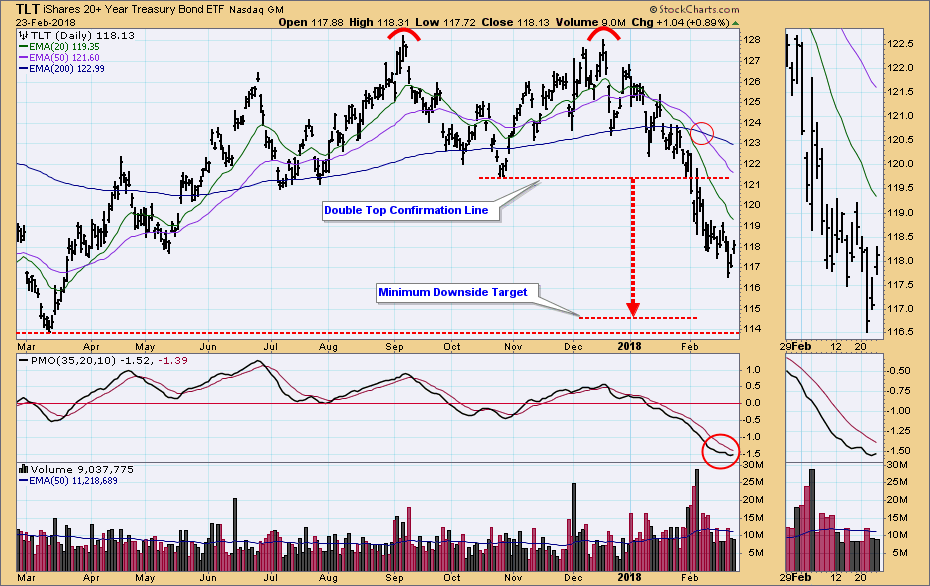
BONDS (TLT)
IT Trend Model: NEUTRAL as of 1/11/2018
LT Trend Model: SELL as of 2/8/2018
Daily Chart: TLT accelerated downward on Wednesday, but it bounced back by the end of the week. The oversold PMO bottomed again, so a bear market rally is a possibility.
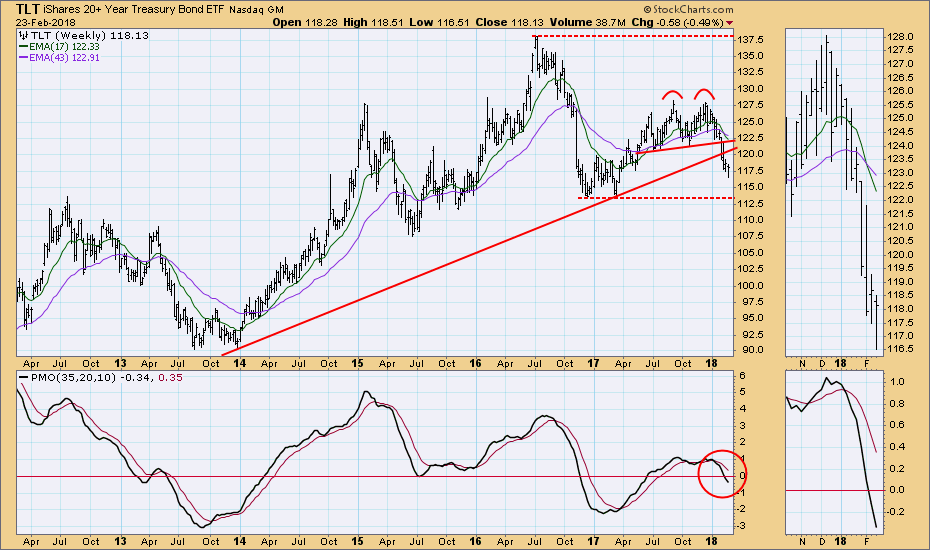
Weekly Chart: With the falling weekly PMO, TLT is still bearish in this time frame. The line drawn across the previous double bottom looks like a good target for finding support.
**Don't miss any of the DecisionPoint commentaries! Go to the "Notify Me" box toward the end of this blog page to be notified as soon as they are published.**
Technical Analysis is a windsock, not a crystal ball.
Happy Charting!
- Carl
NOTE: The signal status reported herein is based upon mechanical trading model signals, specifically, the DecisionPoint Trend Model. They define the implied bias of the price index based upon moving average relationships, but they do not necessarily call for a specific action. They are information flags that should prompt chart review. Further, they do not call for continuous buying or selling during the life of the signal. For example, a BUY signal will probably (but not necessarily) return the best results if action is taken soon after the signal is generated. Additional opportunities for buying may be found as price zigzags higher, but the trader must look for optimum entry points. Conversely, exit points to preserve gains (or minimize losses) may be evident before the model mechanically closes the signal.
Helpful DecisionPoint Links:
DecisionPoint Shared ChartList and DecisionPoint Chart Gallery
Price Momentum Oscillator (PMO)
Swenlin Trading Oscillators (STO-B and STO-V)


