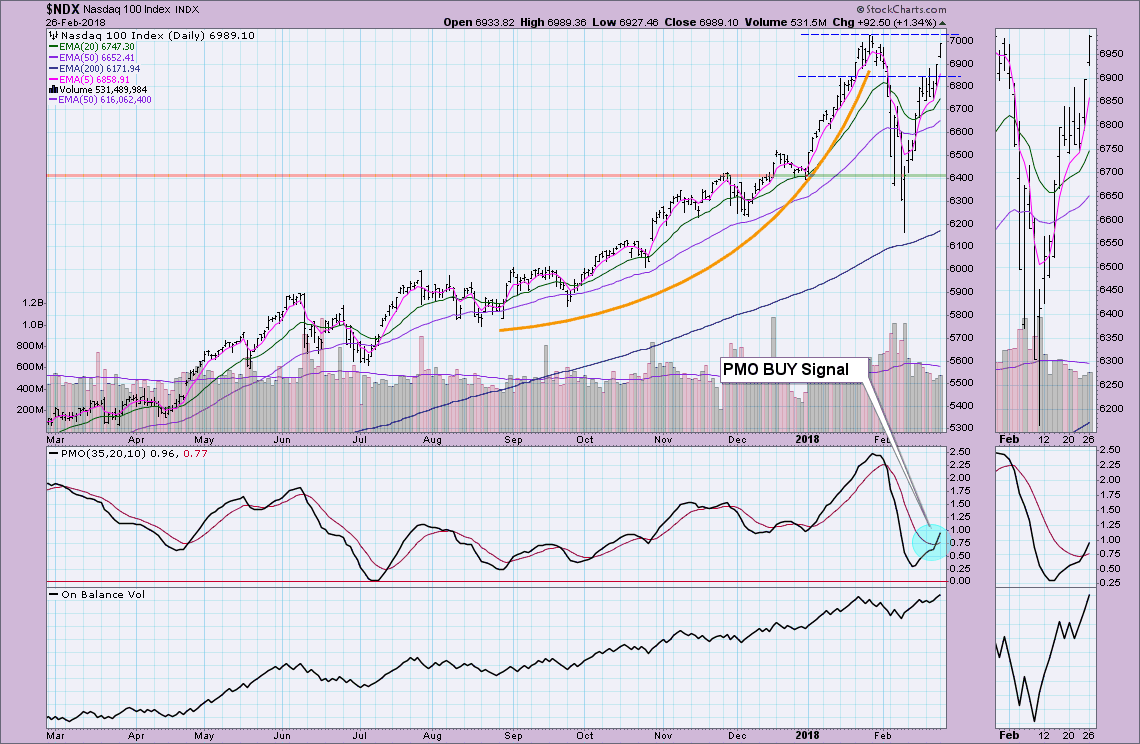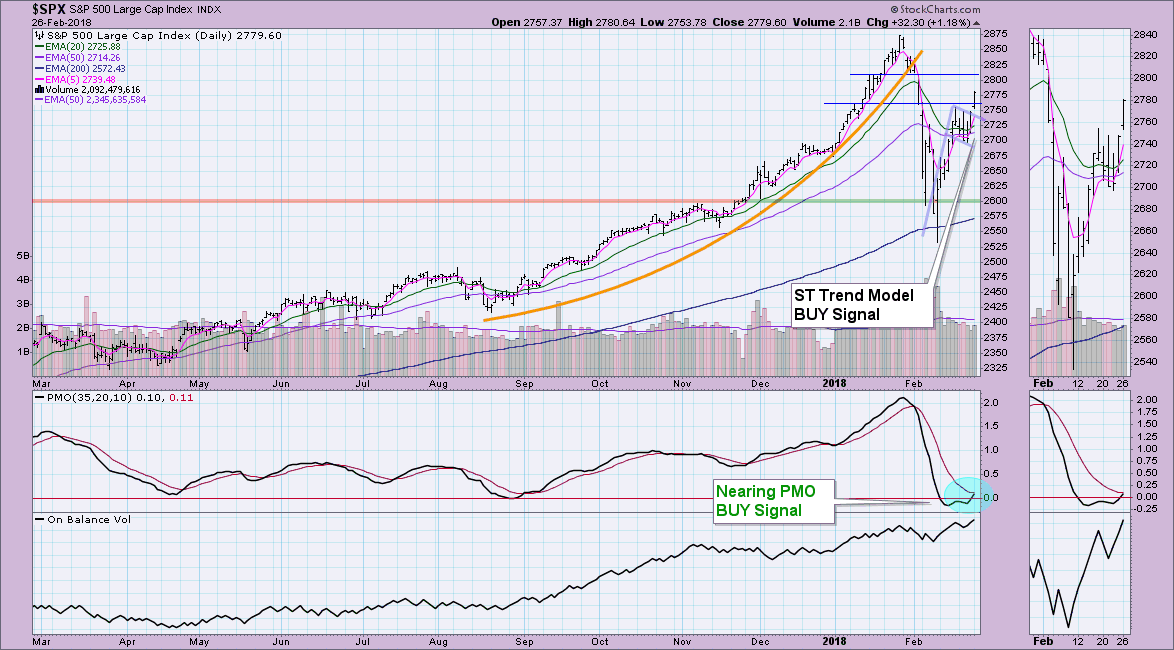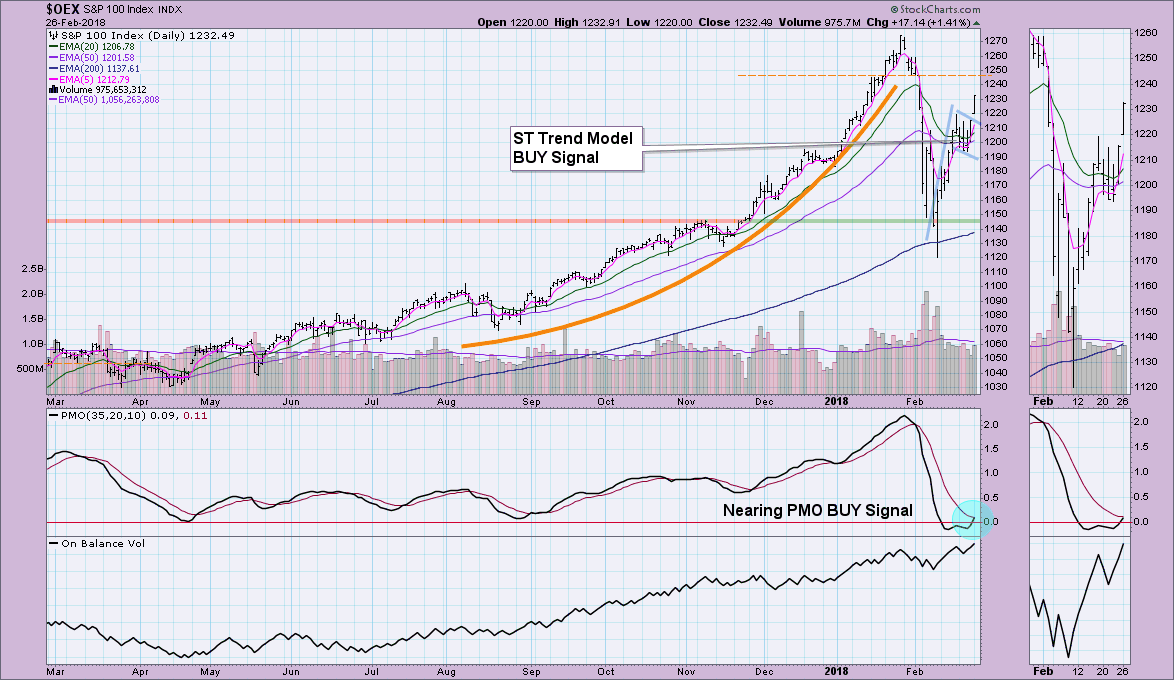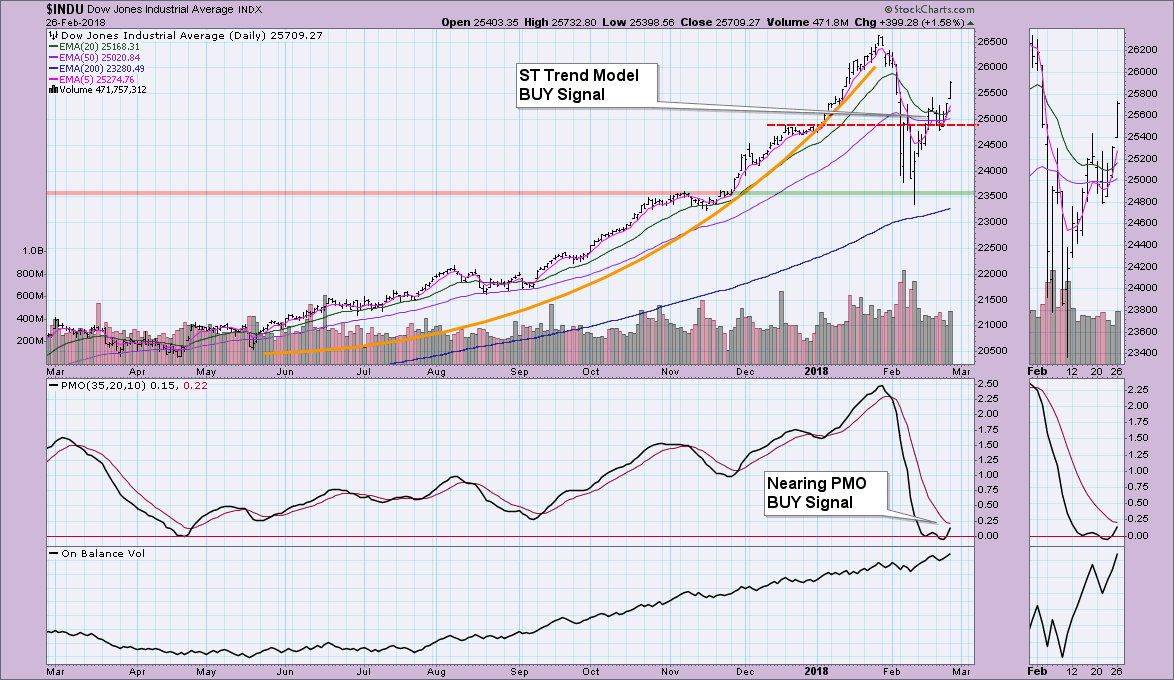
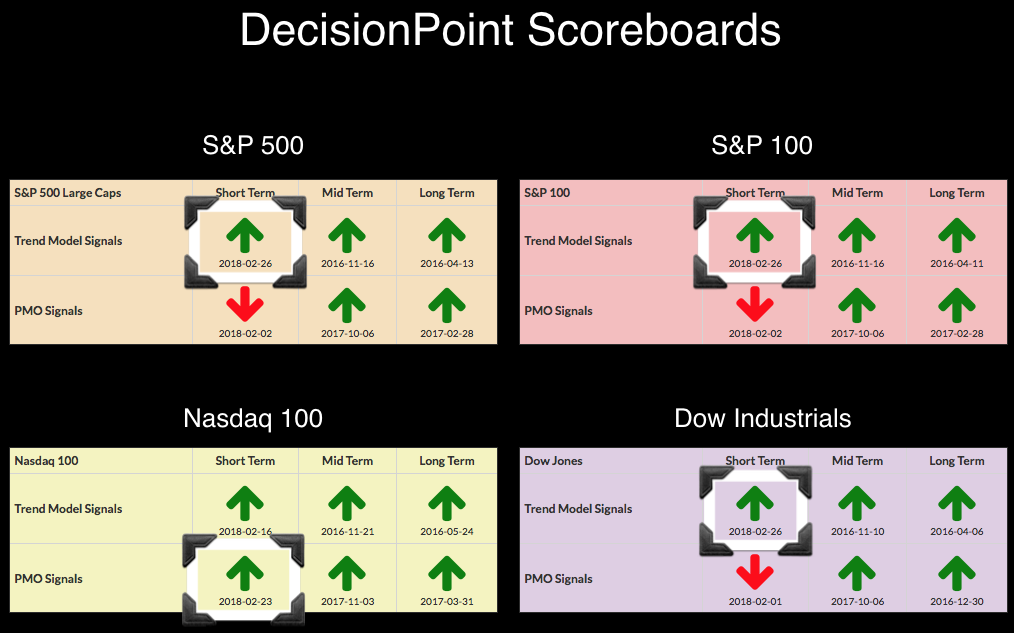
The DP Scoreboard transformation actually began on Friday when the NDX grabbed a new PMO BUY signal after already logging a ST Trend Model BUY signal. It appears the other indexes are falling in line as their 5-EMAs crossed above 20-EMAs to generate ST Trend Model BUY signals too. When you look at the Scoreboard charts, you'll notice a few commonalities. First, most have formed bull flags and are now executing those flags. Second, I'll be writing another signal change article tomorrow (unless we see a steep decline) as all three PMO SELL signals will likely switch to BUY signals. This will put all four Scoreboards in the green again. This doesn't have the earmarks of a bear market. More churning may be necessary, but the execution of these flags is very encouraging.
The NDX is about ready to challenge all-time highs again. I wouldn't describe price action on the NDX as a 'flag formation', but clearly the breakout was impressive and we have a new PMO BUY signal.
You'll notice the flags on the remaining indexes and the clear execution of all three. The PMOs are within hundredths of a point of positive crossover BUY signals. While there remains some overhead resistance ahead of the all-time highs, the NDX broke above its short-term resistance line so I expect the other three to follow suit.
The OEX was decimated and really dropped down to healthy correction territory. The new flag formation and ST BUY signal suggests all-time highs will be reached again.
While I didn't annotate the flag on the Dow, I think you can make a case for its existence. The OBV looks healthy and the new ST Trend Model BUY signal suggest more upside off this breakout from the consolidation zone.
Helpful DecisionPoint Links:
DecisionPoint Shared ChartList and DecisionPoint Chart Gallery
Price Momentum Oscillator (PMO)
Swenlin Trading Oscillators (STO-B and STO-V)
Technical Analysis is a windsock, not a crystal ball.
Happy Charting!
- Erin
**Don't miss DecisionPoint Commentary! Add your email below to be notified of new updates"**

