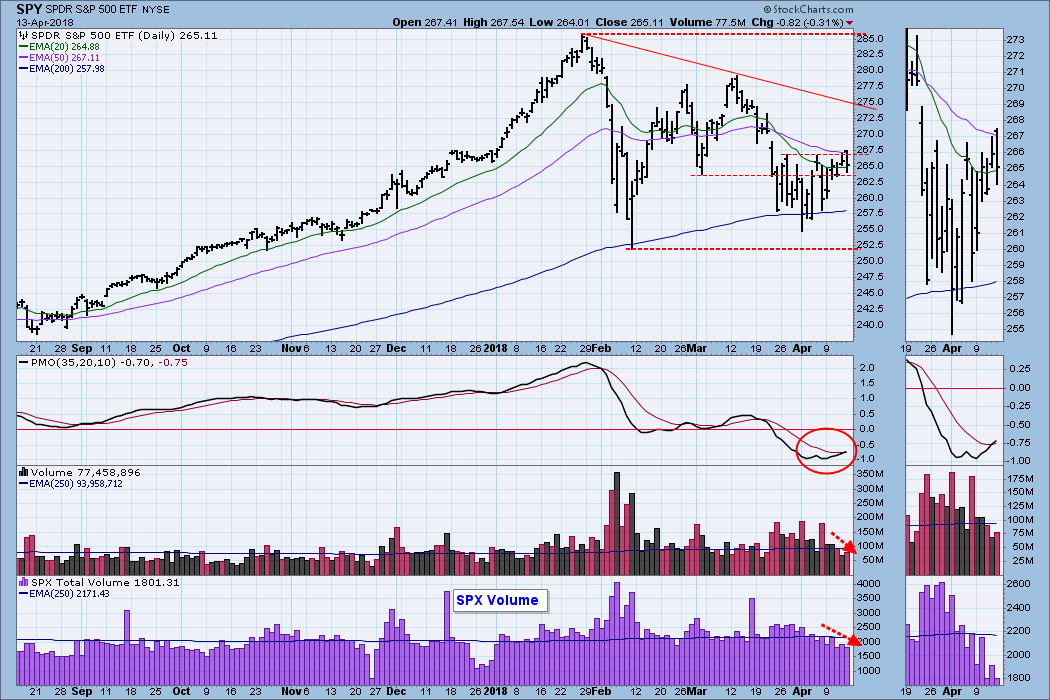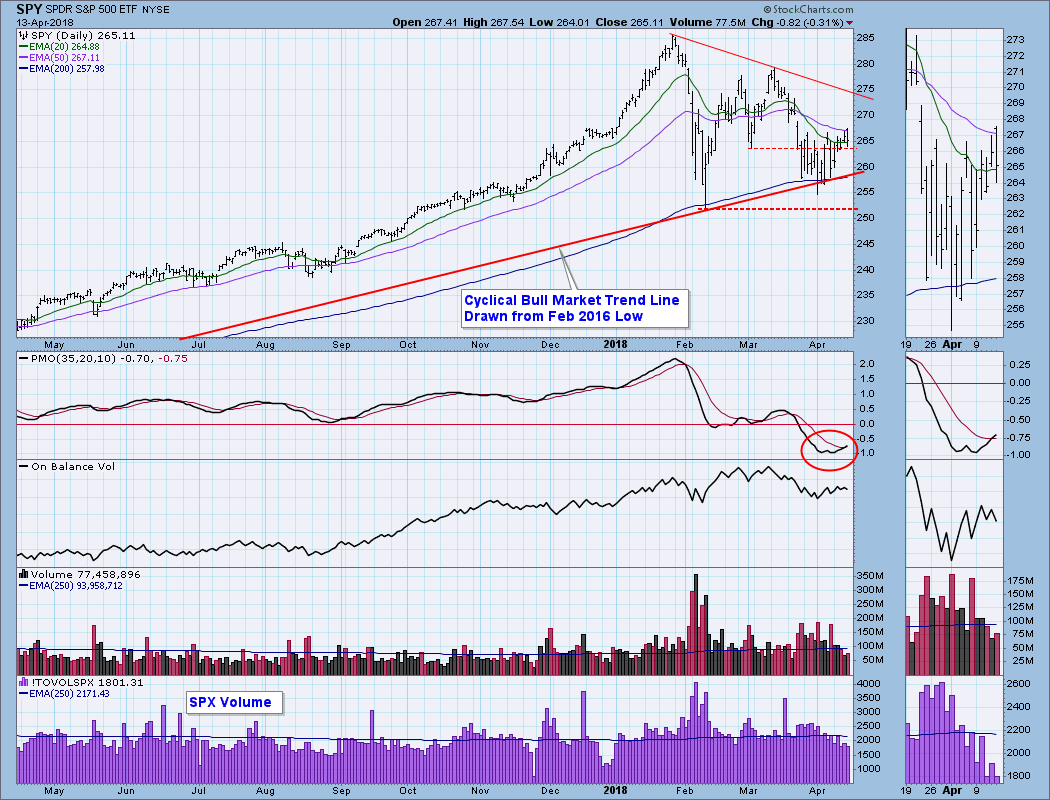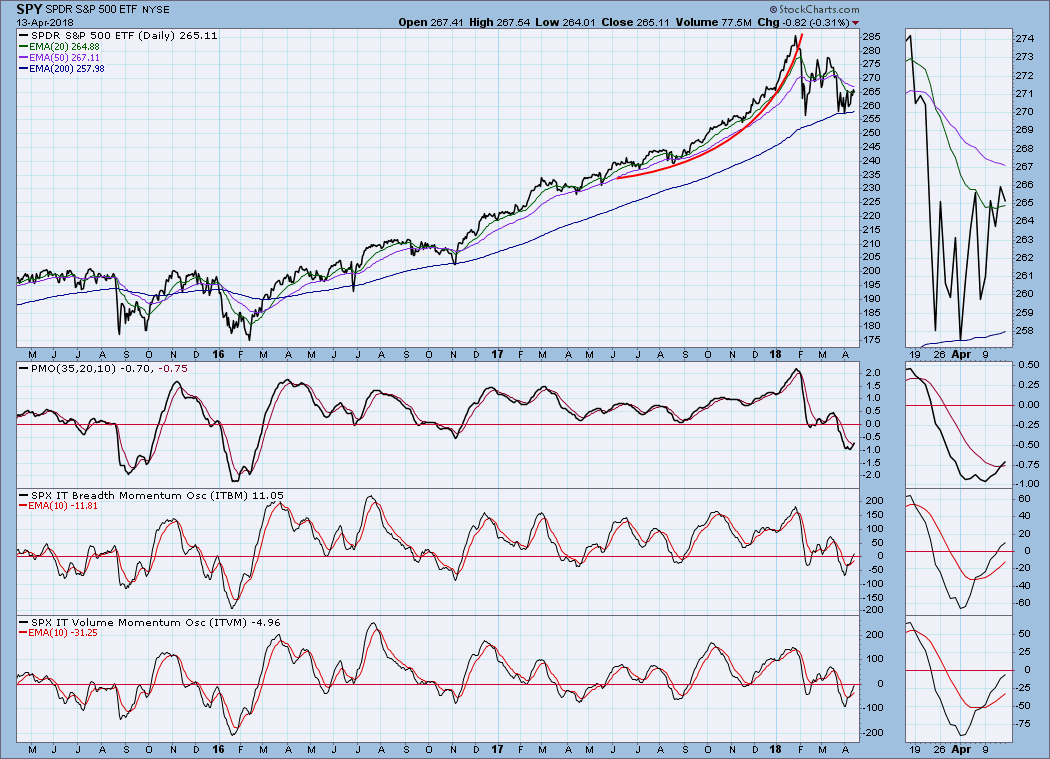
Market action was a little choppy this week, but SPY managed to eke out a small gain; unfortunately, volume was weak and did not confirm the rally. The PMO bottomed and crossed up through the signal line, giving a PMO BUY signal. But the PMO is running kind of flat, so that signal looks a bit thin.
The DecisionPoint Weekly Wrap presents an end-of-week assessment of the trend and condition of the stock market (S&P 500), the U.S. Dollar, Gold, Crude Oil, and Bonds.
SECTORS
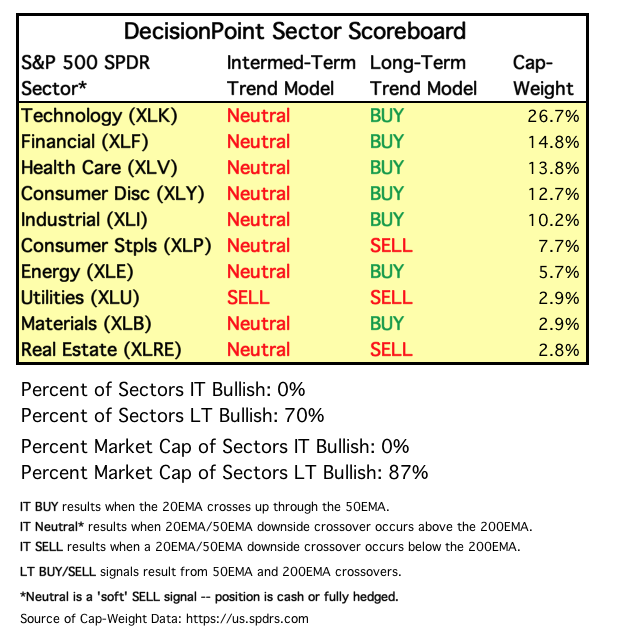
Each S&P 500 Index component stock is assigned to one, and only one, of 10 major sectors. This is a snapshot of the Intermediate-Term and Long-Term Trend Model signal status for those sectors.
STOCKS
IT Trend Model: NEUTRAL as of 3/23/2018
LT Trend Model: BUY as of 4/1/2016
SPY Daily Chart: Sometimes I look at a chart and don't see a lot to talk about. This is one of those times.
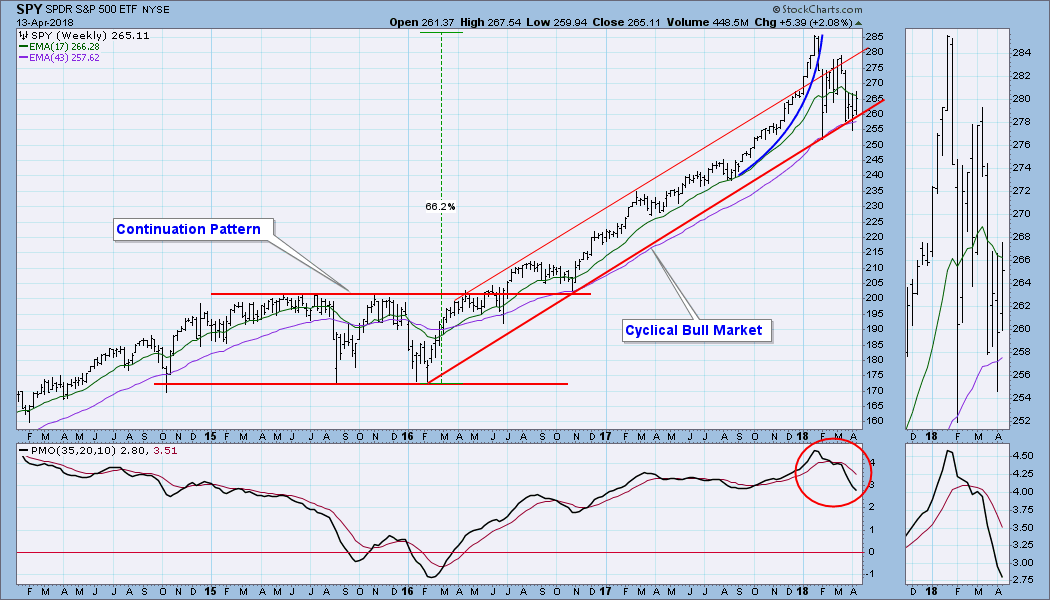
SPY Weekly Chart: The cyclical bull market rising trend line is still intact, so technically the bull market is still in effect; however, the weekly PMO is falling, so I expect more market weakness.
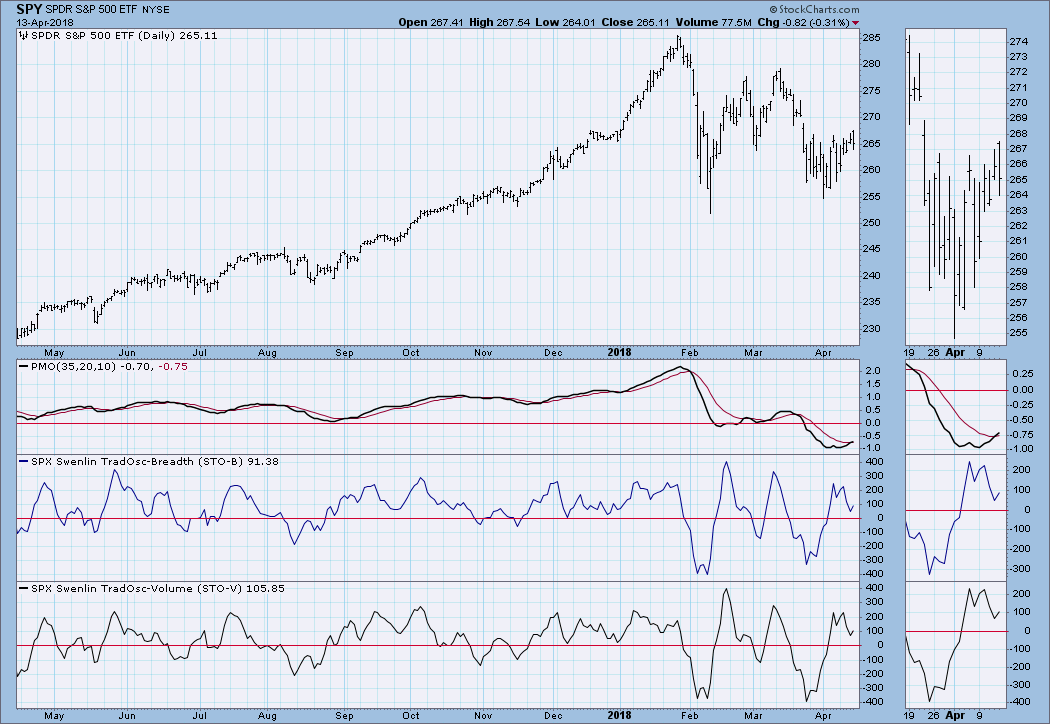
Short-Term Market Indicators: Indicators are neutral in this time frame.
Intermediate-Term Market Indicators: The ITBM and ITVM are neutral and rising.
Conclusion: On Wednesday I was a guest on MarketWatchers LIVE, and Tom Bowley asked me what it would take for me to change my mind about this being a bear market. My reason for becoming bearish was due to the market's parabolic breakdown and the wild market action that followed. Realistically, there is not an equal and opposite reaction for that kind of activity, so I didn't have an answer to Tom's question. Thinking about it now, most important would be for the market to rally above January's all-time highs. I mean, that would be indisputable evidence of a bull market; however, I don't think that is going to happen. I do think it is possible, even probable, that we will see more failed rally attempts. The March highs may even be challenged, but I would still need to see a lot less volatile market action before I would start thinking like a bull.
DOLLAR (UUP)
IT Trend Model: SELL as of 12/21/2017
LT Trend Model: SELL as of 5/24/2017
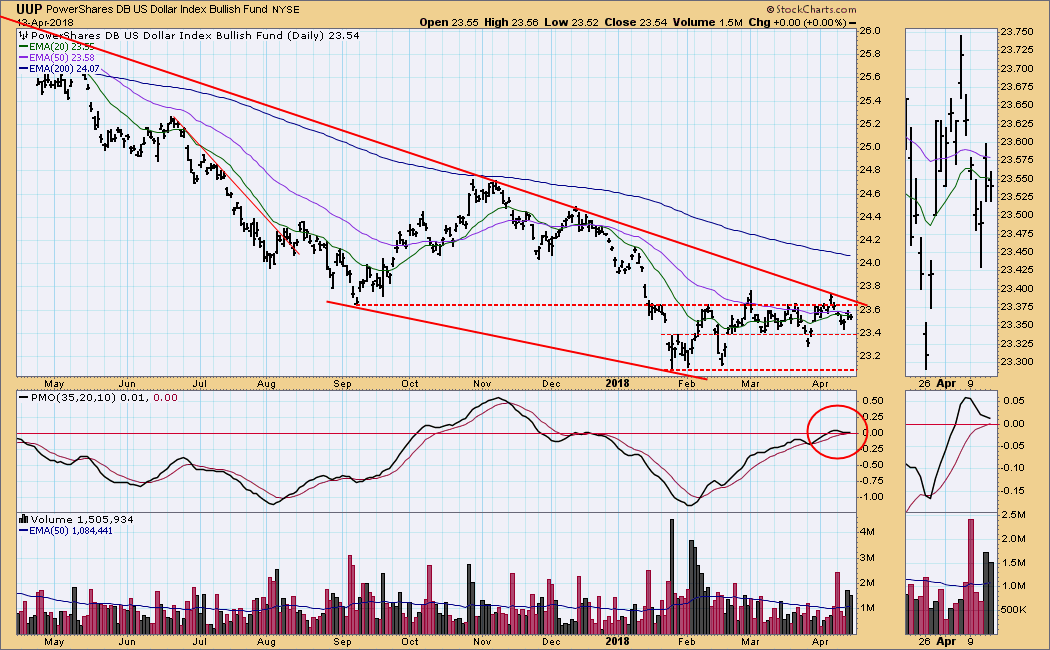
UUP Daily Chart: Price is being held below important horizontal resistance, and it is challenging the declining tops line.
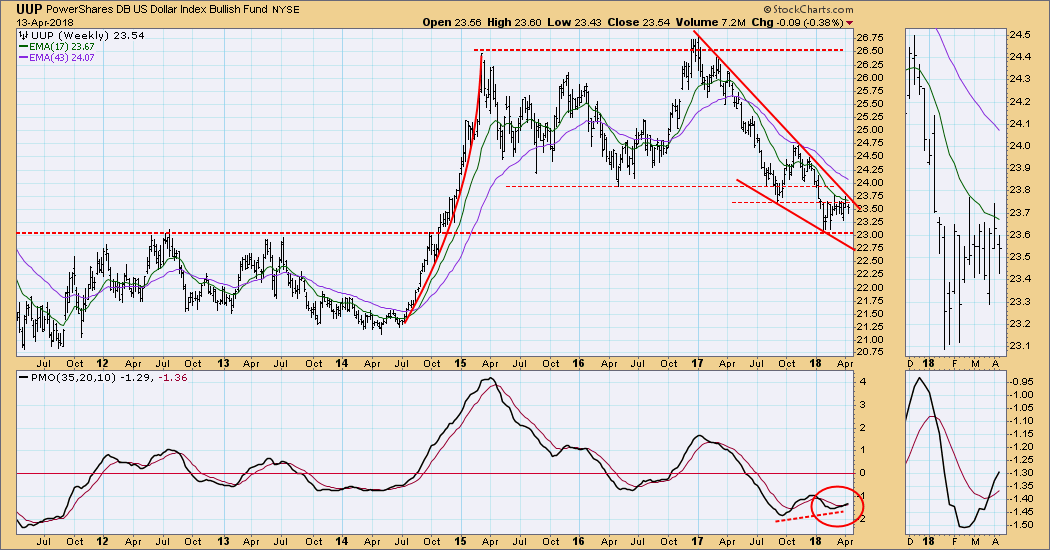
UUP Weekly Chart: The dominant feature here is a massive falling wedge formation, and the technical expectation is that it will resolve to the upside. The PMO positive divergence reinforces that expectation.
GOLD
IT Trend Model: BUY as of 1/2/2018
LT Trend Model: BUY as of 4/12/2017
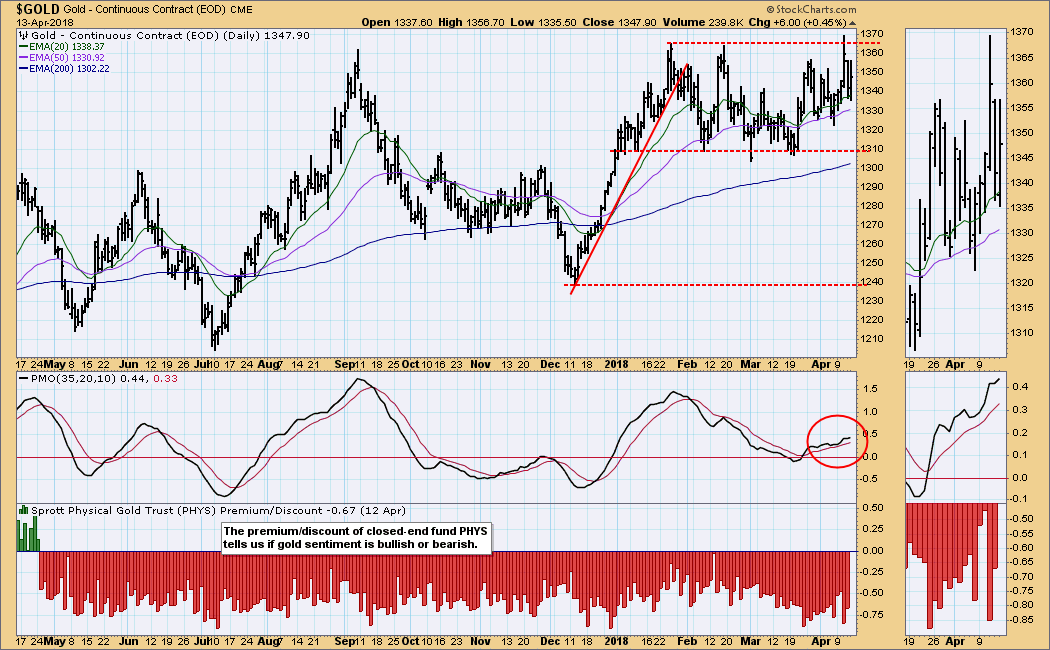
GOLD Daily Chart: Gold attempted to break out of the three-month trading range on Wednesday, but it proved to be another head fake.
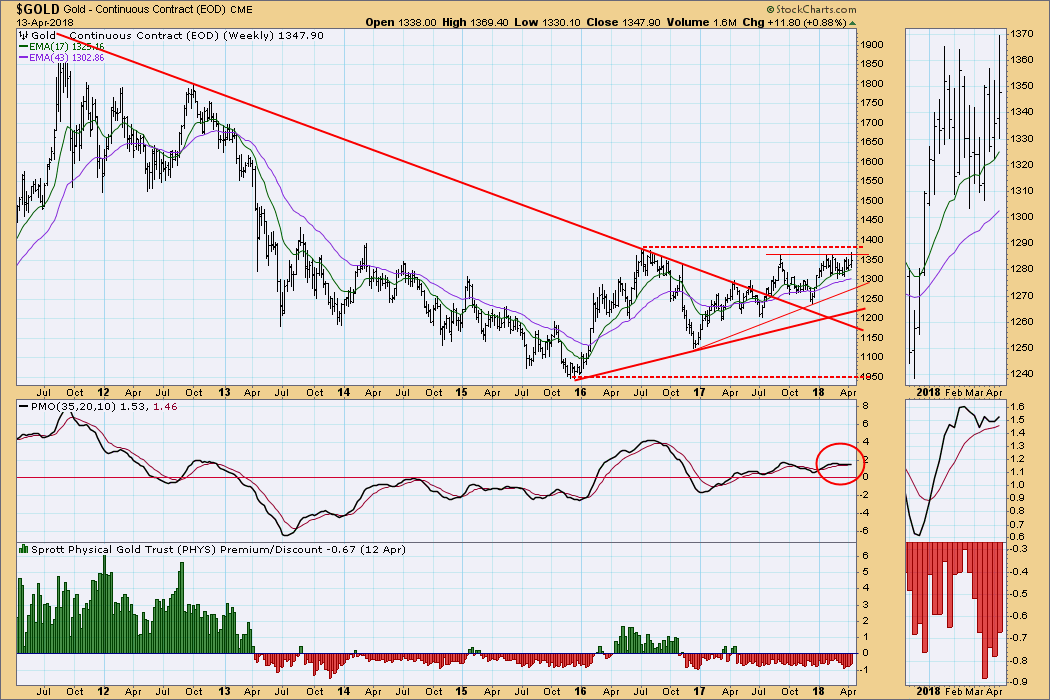
GOLD Weekly Chart: Gold remains positive in this time frame. The 17EMA is above the 43EMA, and the weekly PMO is above the signal line.
CRUDE OIL (USO)
IT Trend Model: BUY as of 9/6/2017
LT Trend Model: BUY as of 11/2/2017
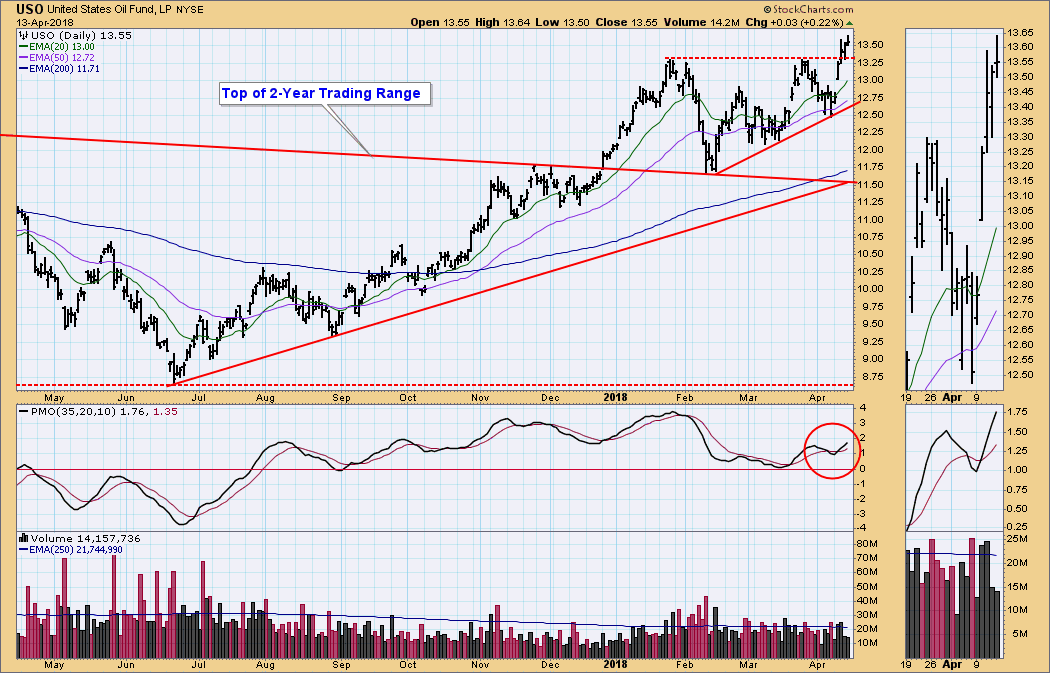
USO Daily Chart: After breaking above the two-year trading range in December, USO has been consolidating. This week it finally broke above the top of that consolidation, and I assume that the rally will continue.
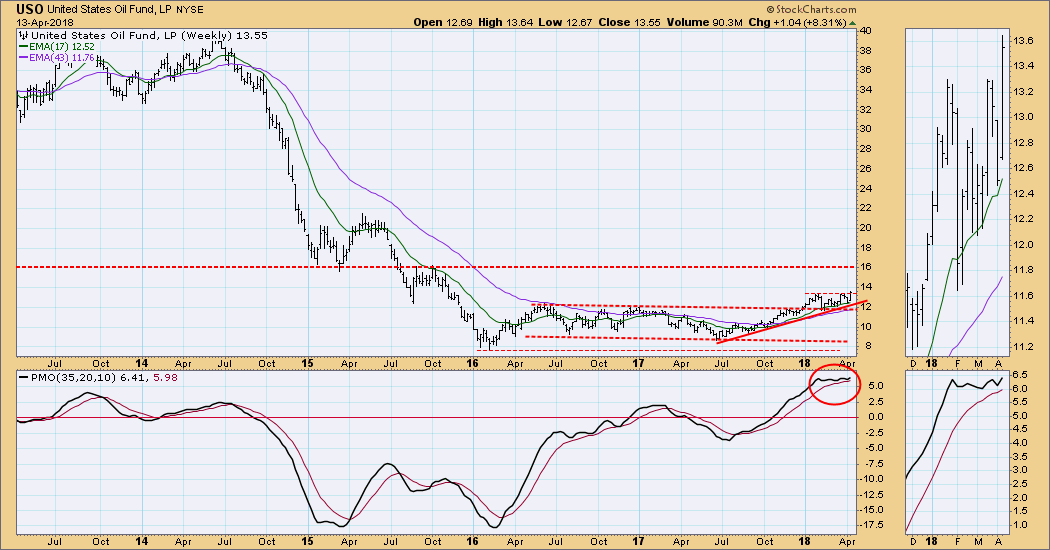
USO Weekly Chart: The most obvious next overhead resistance is at about 16.00, which translates to about $78/bbl for crude.
BONDS (TLT)
IT Trend Model: BUY as of 4/9/2018
LT Trend Model: SELL as of 2/8/2018
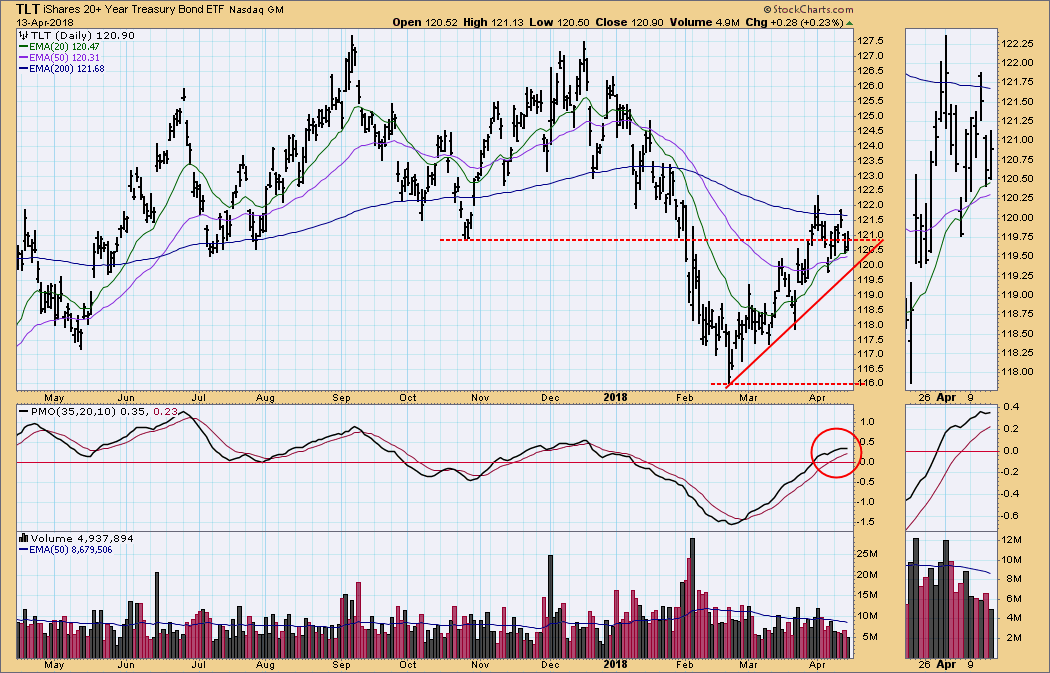
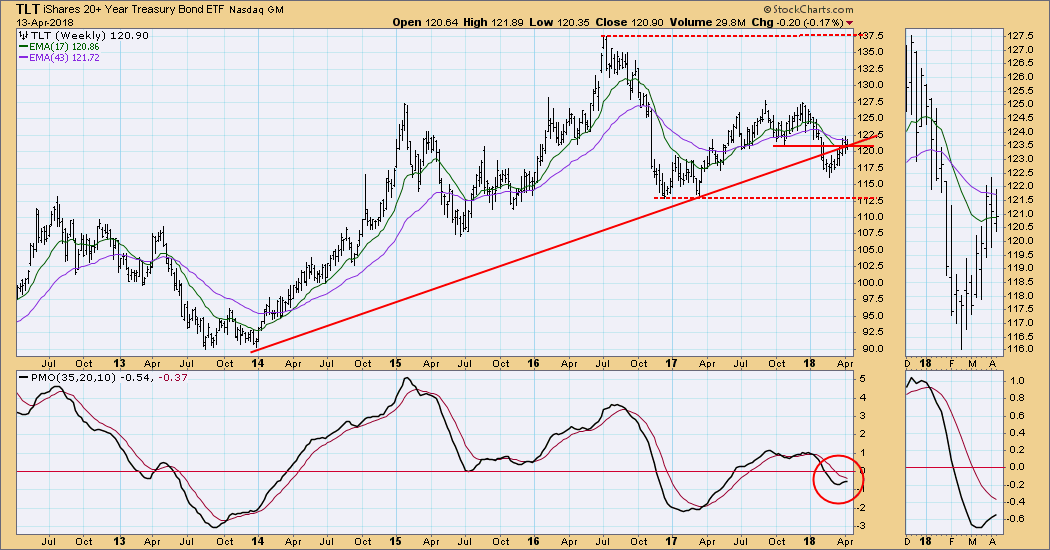
TLT Daily Chart: The daily PMO has topped for the second time in as many weeks. I can't help but think that this two-month rally is an aberration, considering that rates are rising. There was a Trend Model BUY signal on Monday, but post-signal upside price action has not been robust.
TLT Weekly Chart: Price seems to be stalled in an area of resistance. The weekly PMO is decelerating and it will top below the signal line if price heads back down.
**Don't miss any of the DecisionPoint commentaries! Go to the "Notify Me" box toward the end of this blog page to be notified as soon as they are published.**
Technical Analysis is a windsock, not a crystal ball.
Happy Charting!
- Carl
NOTE: The signal status reported herein is based upon mechanical trading model signals, specifically, the DecisionPoint Trend Model. They define the implied bias of the price index based upon moving average relationships, but they do not necessarily call for a specific action. They are information flags that should prompt chart review. Further, they do not call for continuous buying or selling during the life of the signal. For example, a BUY signal will probably (but not necessarily) return the best results if action is taken soon after the signal is generated. Additional opportunities for buying may be found as price zigzags higher, but the trader must look for optimum entry points. Conversely, exit points to preserve gains (or minimize losses) may be evident before the model mechanically closes the signal.
Helpful DecisionPoint Links:
DecisionPoint Shared ChartList and DecisionPoint Chart Gallery
Price Momentum Oscillator (PMO)
Swenlin Trading Oscillators (STO-B and STO-V)

