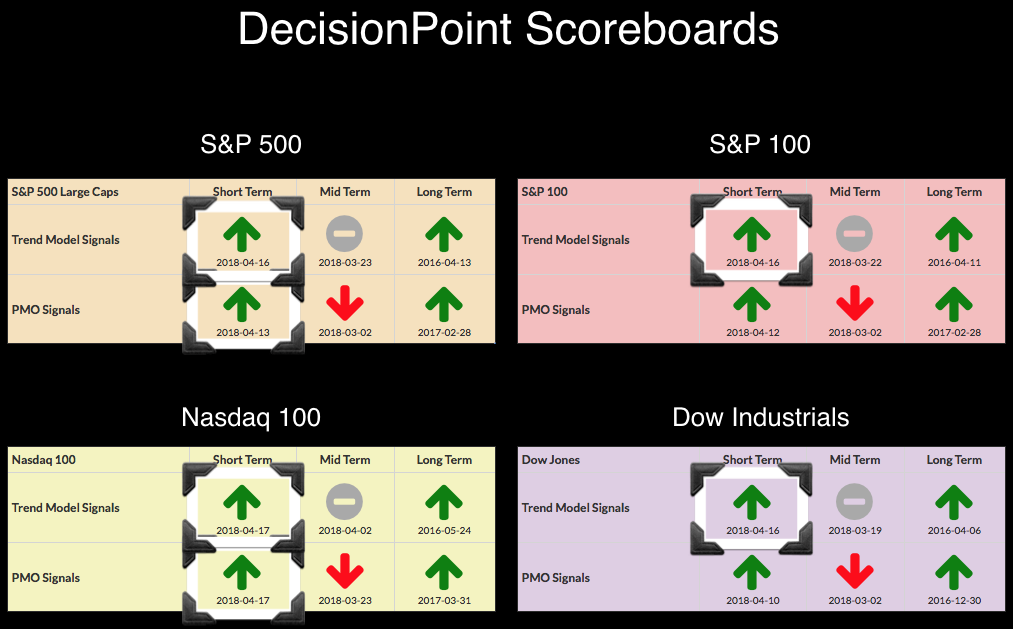
Since Friday, the DecisionPoint Scoreboards have been adding short-term buy signal after short-term buy signal. With today's breakouts from consolidation zones, I believe they are timely. You may be wondering what it would take to start seeing BUY signals in the intermediate term. The IT Trend Model signals are based on 20/50-EMA crossovers in relation to the 200-EMA. We would need to see the 20-EMA leap over the 50-EMA in order to see an ITTM BUY signal. To get an IT PMO BUY signal, the weekly PMOs need a positive crossover their signal lines. All four weekly PMOs are in decline, though decelerating.
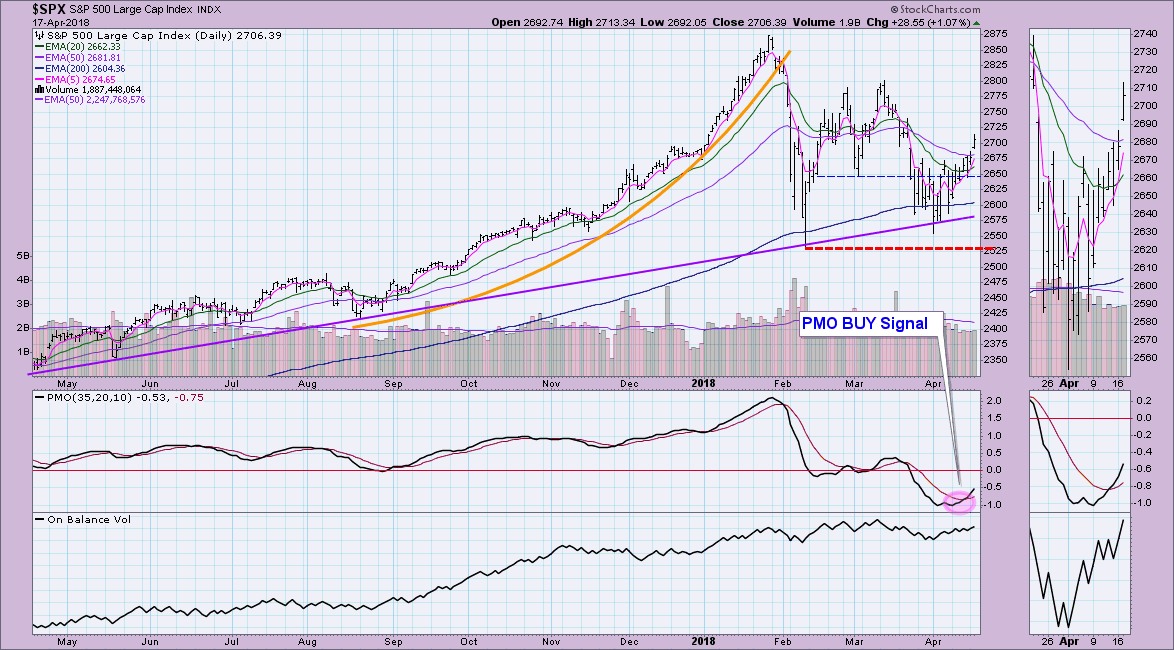
On all four index charts you'll see the common threads. First today's breakout on all of the charts broke above overhead resistance at the 50-EMAs. For the SPX, the break above resistance at 2675 was impressive. The fact that price closed above 2700 is also very bullish for the SPX. I've been unimpressed with the volume petering out on this rally, but today's volume was slightly higher than yesterday and the OBV looks good on its rising trend.
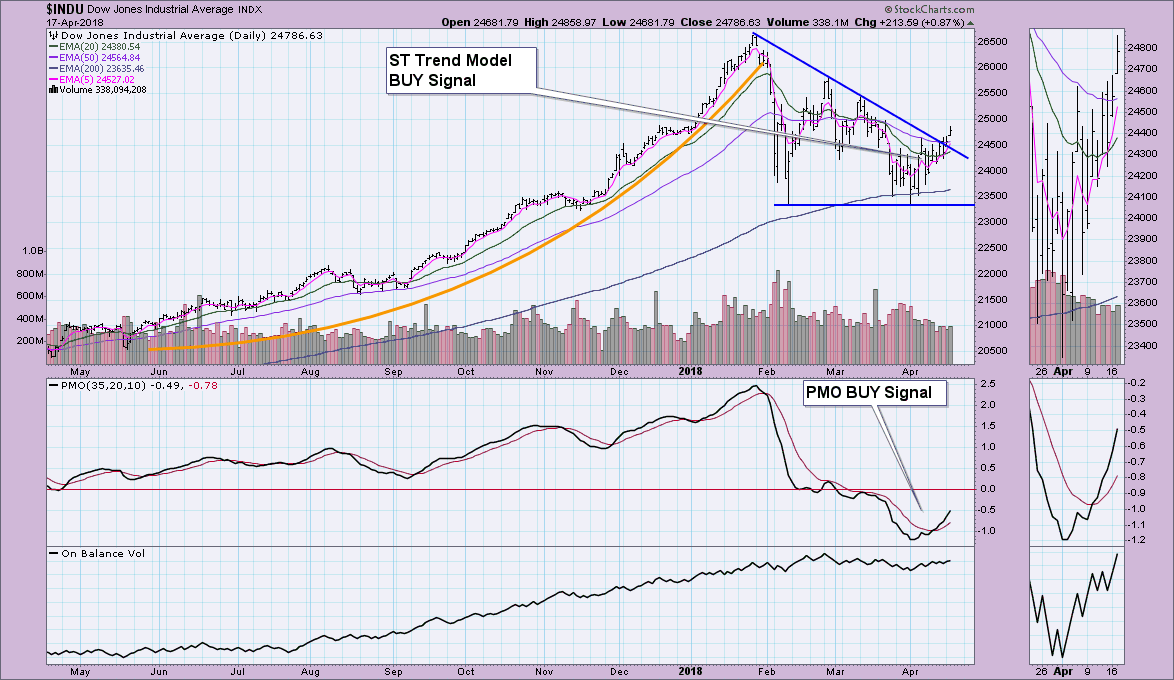
The Dow broke out above declining tops trendline resistance and closed above resistance around 24600. OBV is rising so I'll forgive some drying up of volume during the rally. Also volume over the past few days has been fairly consistent. Next stop is 25500.
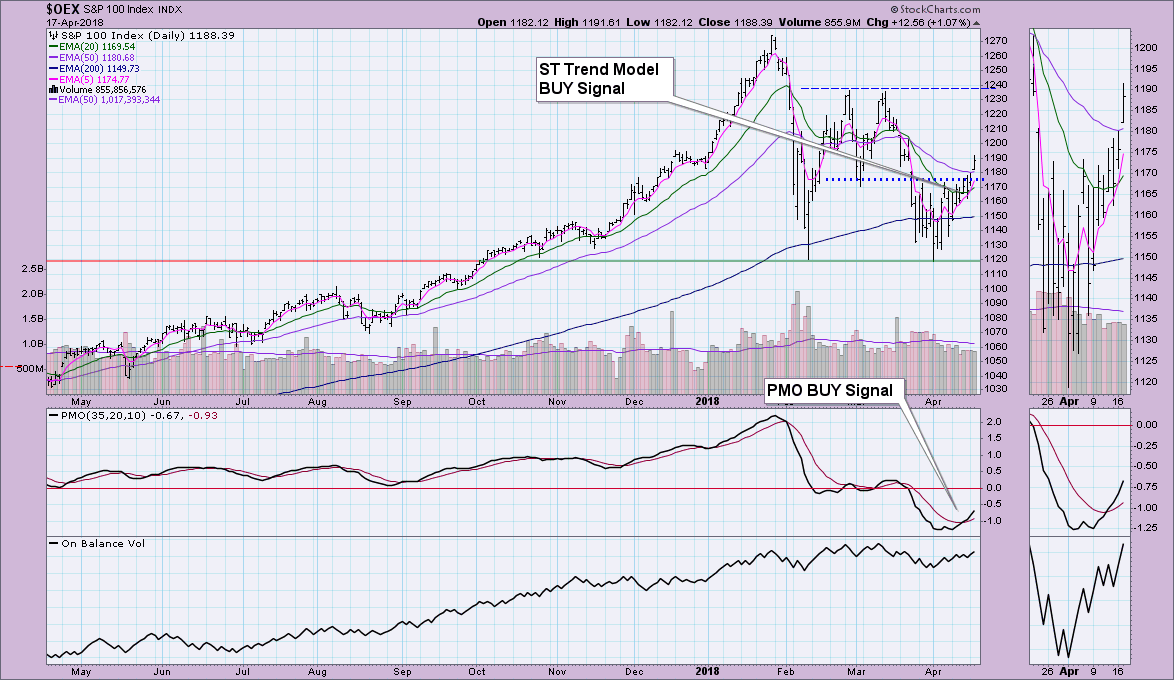
Another nice breakout! OEX has now closed and traded fully above 1180 today. OBV is behind the move. I'd look for the next area of resistance around 1220 - 1235.
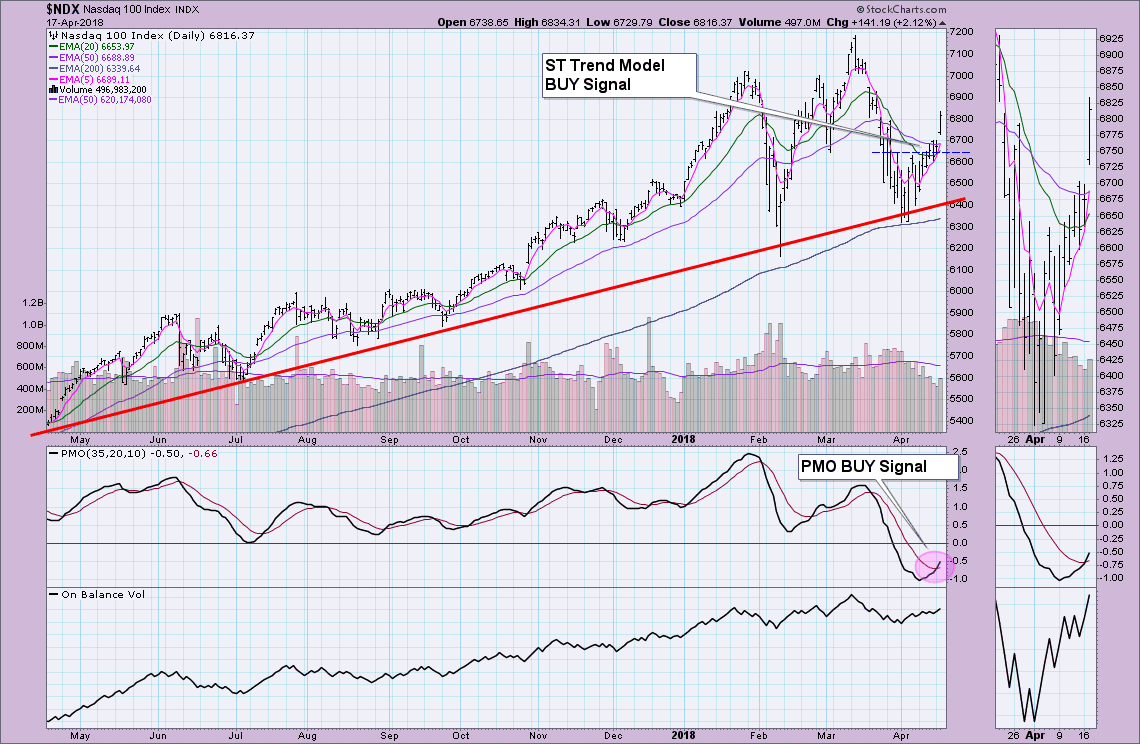
The NDX has been in need of a great breakout day and today was it. This shot up in price is what finally triggered both a PMO and ST Trend Model BUY signal. Today's breakout came on increasing volume which I like. Additionally, as with the others, the OBV is rising with the rising trend which confirms the price rise. If the NDX sustains this momentum, I'd be looking for a move to test the 7000 area.
Don't forget that you can view these charts as I update them in the DecisionPoint Chart Gallery. The link is below along with other helpful DP links.
Helpful DecisionPoint Links:
DecisionPoint Shared ChartList and DecisionPoint Chart Gallery
Price Momentum Oscillator (PMO)
Swenlin Trading Oscillators (STO-B and STO-V)
Technical Analysis is a windsock, not a crystal ball.
Happy Charting!
- Erin
**Don't miss DecisionPoint Commentary! Add your email below to be notified of new updates"**


