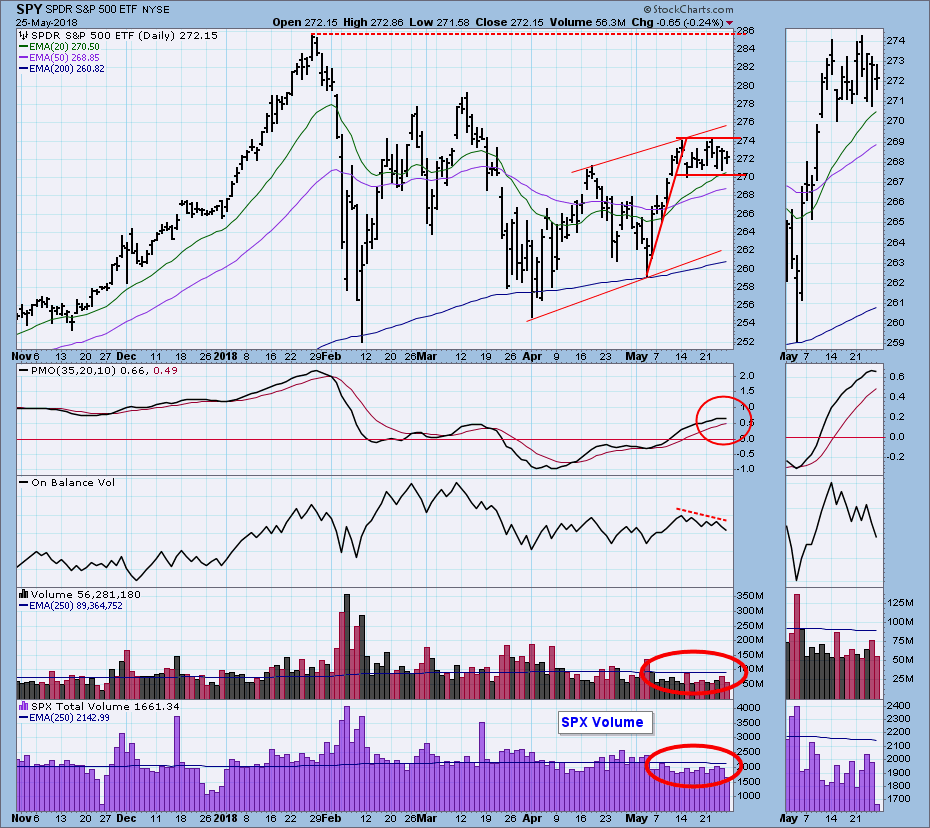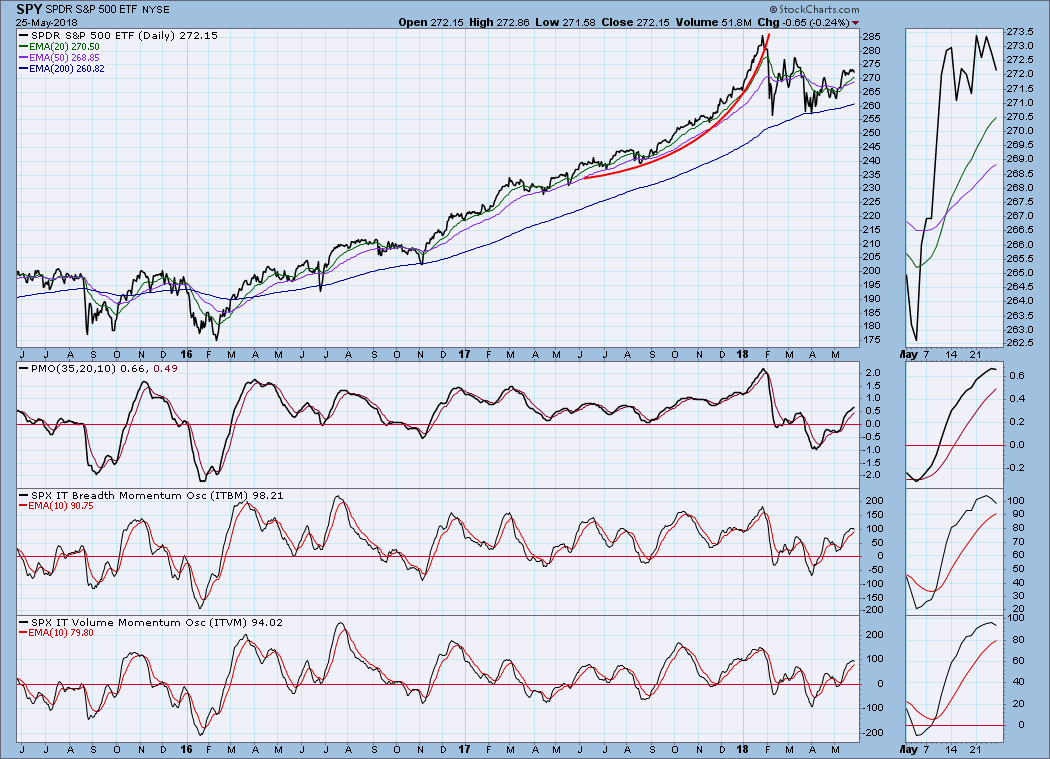
Last week I thought we had a good outlook based upon a bullish flag formation, but this week the market just added more sideways movement. We could still make a case for a flag being in place, but a good flag should slant down off the flagpole as a sign that some compression is building that could launch the next leg up. This sideways churning dampens my enthusiasm. Volume continues to be light compared to the 250EMA of volume, and the daily PMO has topped. My outlook is more cautious.
The DecisionPoint Weekly Wrap presents an end-of-week assessment of the trend and condition of the stock market (S&P 500), the U.S. Dollar, Gold, Crude Oil, and Bonds.
SECTORS
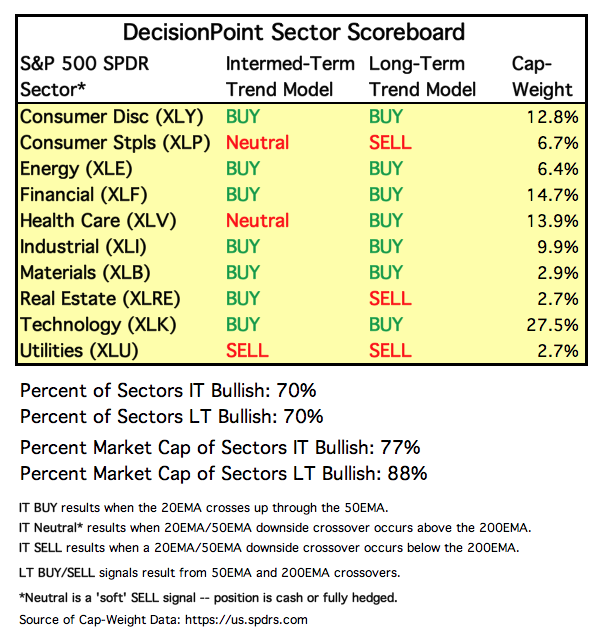
Each S&P 500 Index component stock is assigned to one, and only one, of 10 major sectors. This is a snapshot of the Intermediate-Term and Long-Term Trend Model signal status for those sectors.
STOCKS
IT Trend Model: BUY as of 5/11/2018
LT Trend Model: BUY as of 4/1/2016
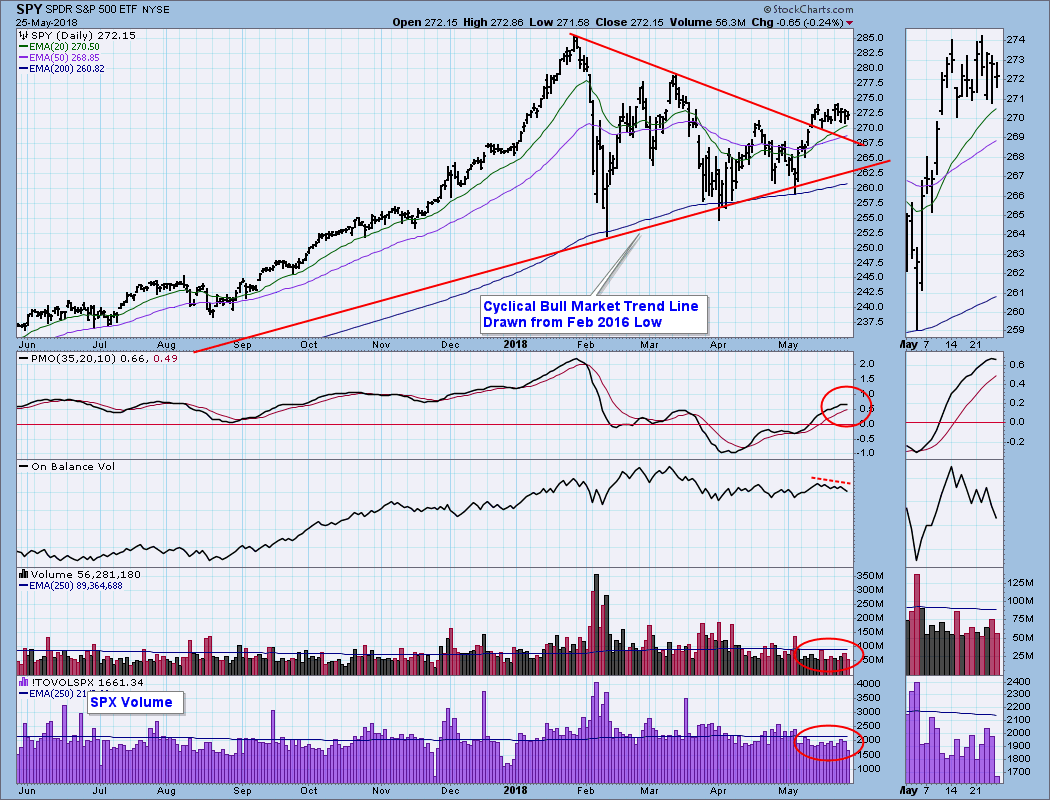
SPY Daily Chart: Price is consolidating above the declining tops line after the breakout about two weeks ago. This sideways movement has stalled the daily PMO, which topped today. Note the negative divergence on OBV.
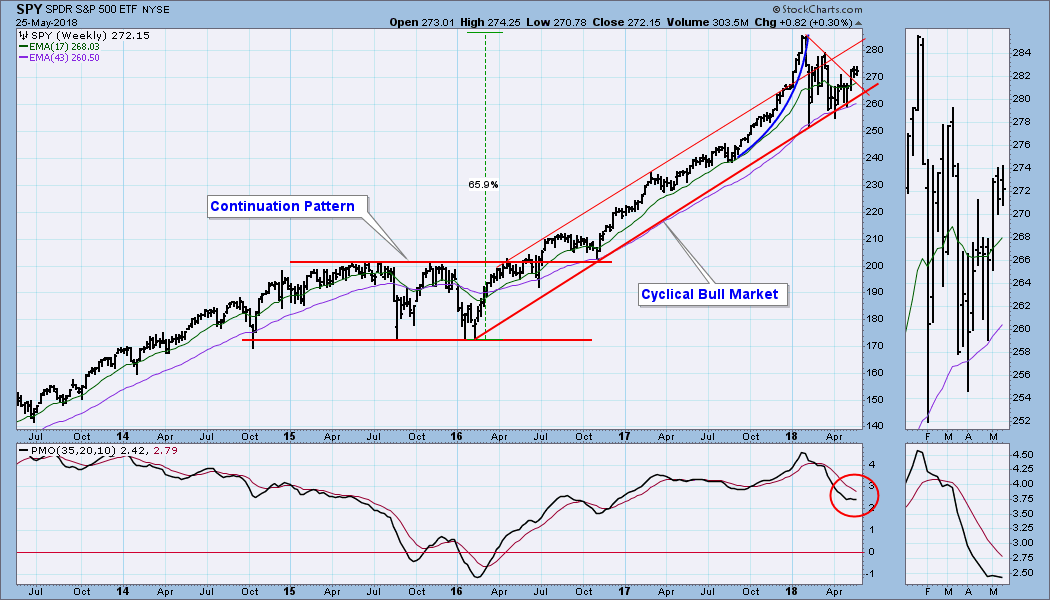
SPY Weekly Chart: Not much has changed on this chart since last week. Price remains in about the middle of the cyclical bull market rising trend channel. The weekly PMO is still falling, but it is almost flat.
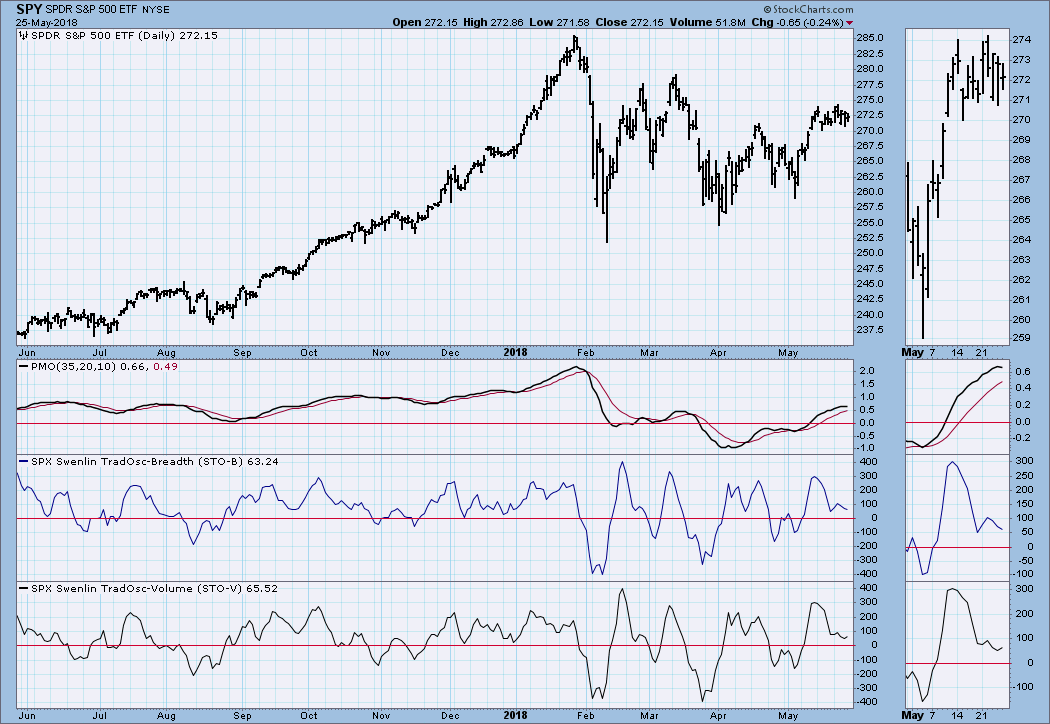
Short-Term Market Indicators: The STO-B (breadth) and STO-V (volume) are neutral and of little value at this time. When they are overbought or oversold, they warn of possible short-term reversal. In neutral, a break in either direction is possible.
Intermediate-Term Market Indicators: The ITBM (breadth), ITVM (volume), and PMO (price) are all modestly overbought, and they have all topped. This is bearish for the market.
Conclusion: I think part of the reason for the market's recent sideways movement is the fact that Monday is Memorial Day. People were leaving town ahead of the holiday, and, since next week is a short week, a lot of them won't be coming back to work until the week after next. This can make for some boring market action.
At this moment, the market seems to be set up for a pullback or correction. I base this conclusion upon the condition of the intermediate-term indicators (see chart just above). They are all somewhat overbought, and they have topped. Recent declines have been very short-lived, so I can't make a case for anything too serious.
DOLLAR (UUP)
IT Trend Model: BUY as of 4/24/2018
LT Trend Model: BUY as of 5/25/2018
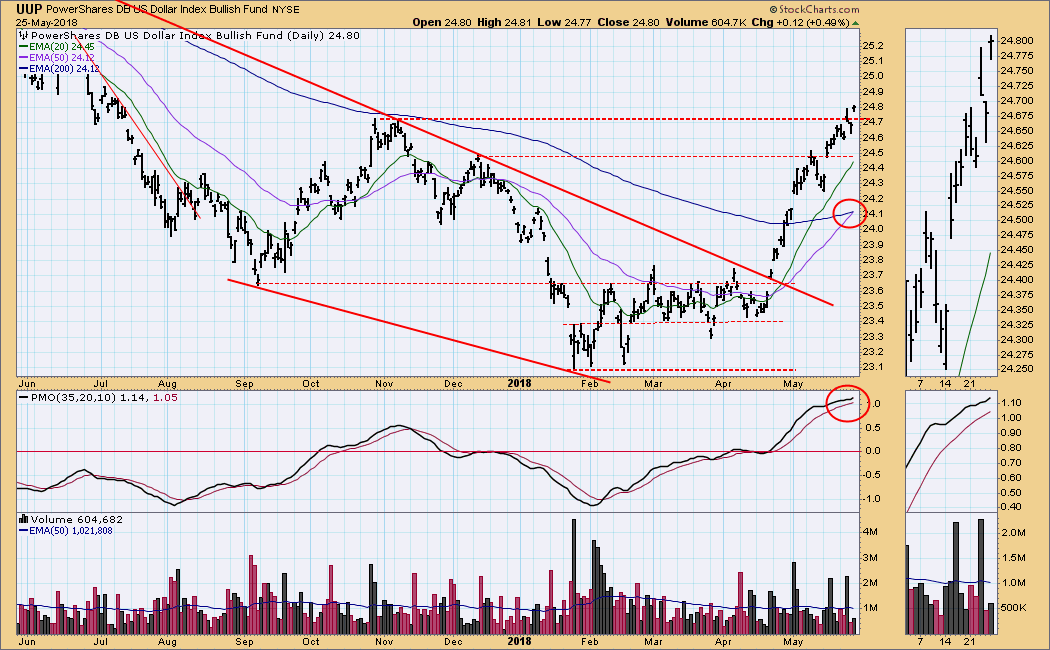
UUP Daily Chart: The last three days of this week UUP fought with the horizontal resistance line and seems to have won the battle on Friday. More important, the 50EMA crossed up through the 200EMA, generating a Long-Term Trend Model BUY signal.
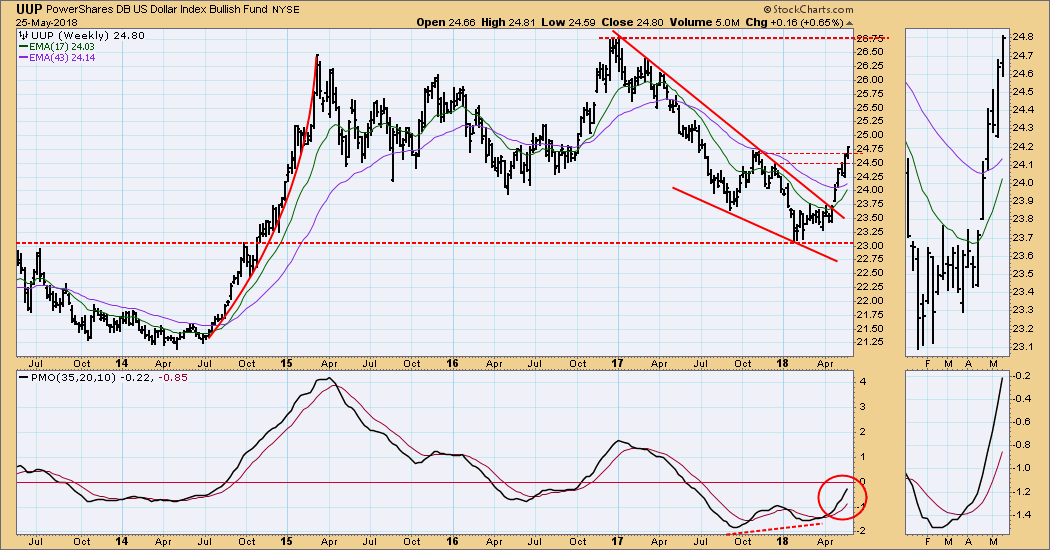
UUP Weekly Chart: We expect a falling wedge to resolve upward because the declining tops line is too steep; however, such an event doesn't necessarily mean that the longer-term trend will be reversed. In this case, I think that it has been.
GOLD
IT Trend Model: NEUTRAL as of 5/2/2018
LT Trend Model: BUY as of 4/12/2017
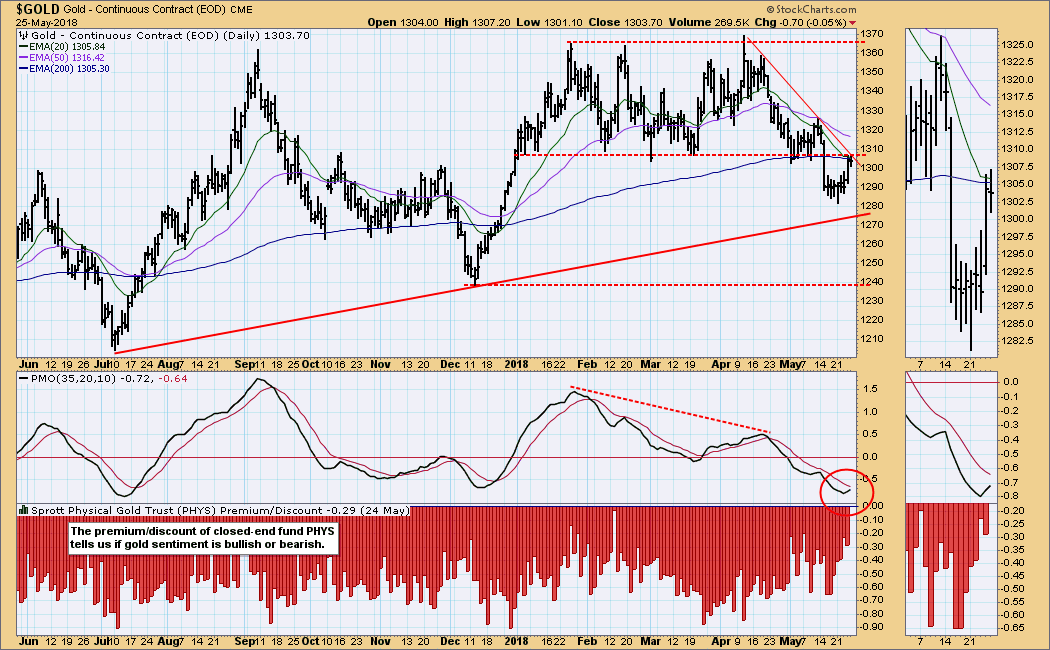
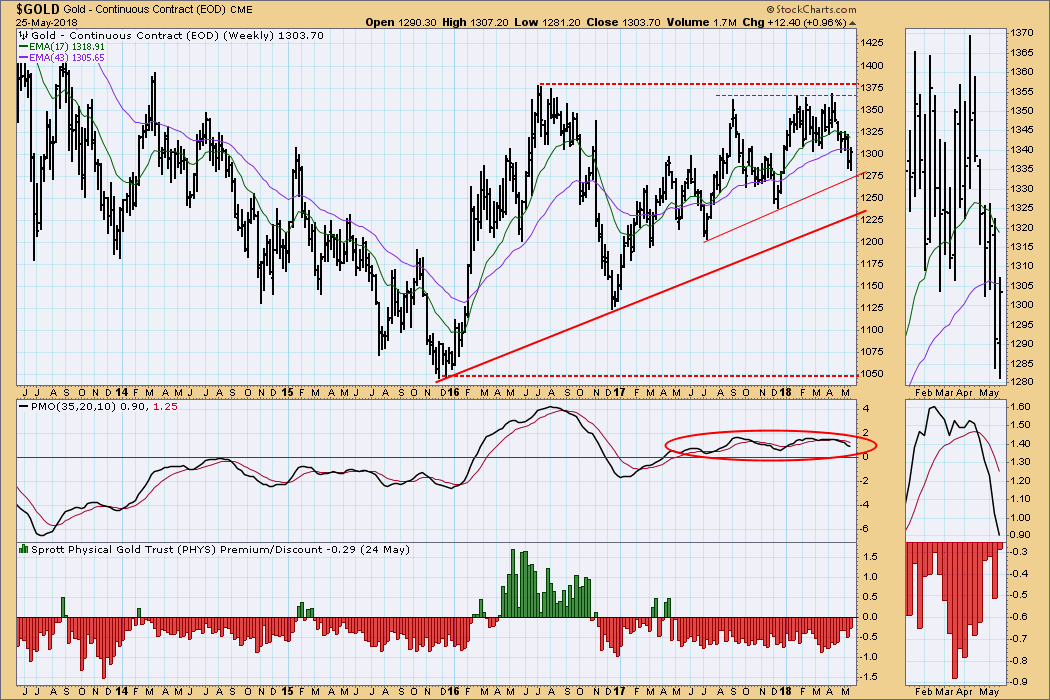
GOLD Daily Chart: After last week's breakdown, gold found support and bounced back the the point of breakdown, where it hit the combined resistance of the horizontal resistance and the declining tops line. The daily PMO has bottomed near what has been the oversold level for the one-year time period shown, so the short rally may continue. The big problem for gold is that the dollar is so strong.
GOLD Weekly Chart: This chart remains positive, but price and the PMO are headed in the wrong direction.
CRUDE OIL (USO)
IT Trend Model: BUY as of 9/6/2017
LT Trend Model: BUY as of 11/2/2017
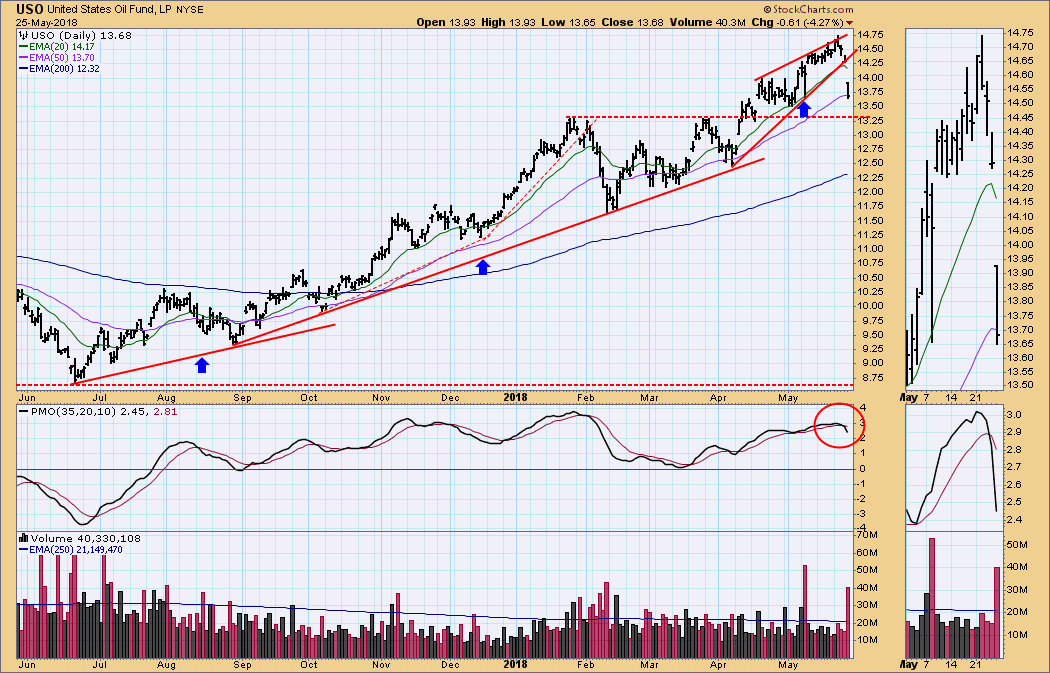
USO Daily Chart: This week USO broke down hard from a rising wedge pattern. Downward resolution is what we normally expect from this pattern, but this breakdown was especially energetic. In addition to the wedge, another issue was the ever-increasing angle of the rising trend lines (marked by the blue arrows), which ultimately called for a correction.
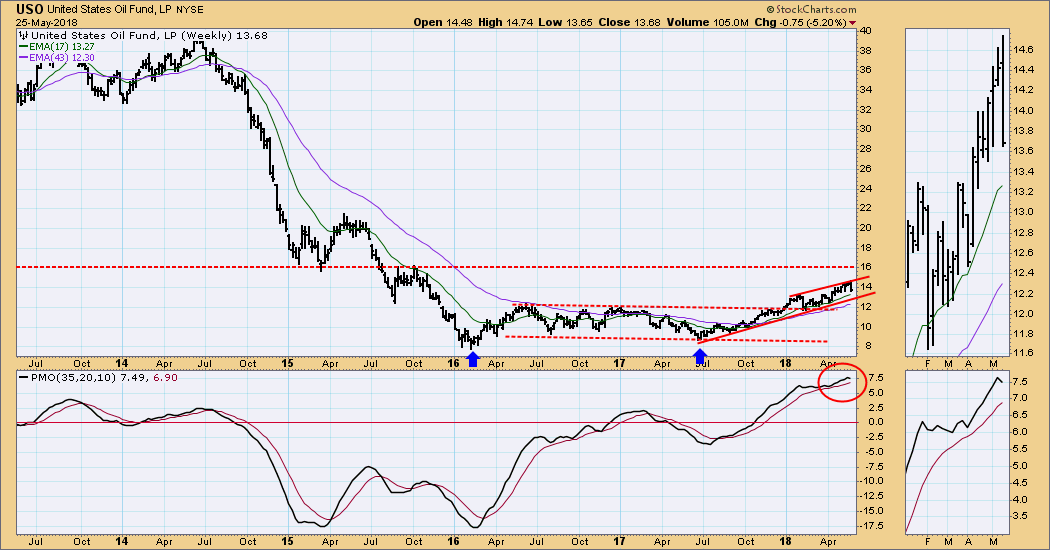
USO Weekly Chart: This chart helps to clarify. Price had reached the top of a rising trend channel, and a reasonable expectation would be for it to correct back the the bottom of the channel. The weekly PMO has topped.
BONDS (TLT)
IT Trend Model: SELL as of 4/20/2018
LT Trend Model: SELL as of 2/8/2018
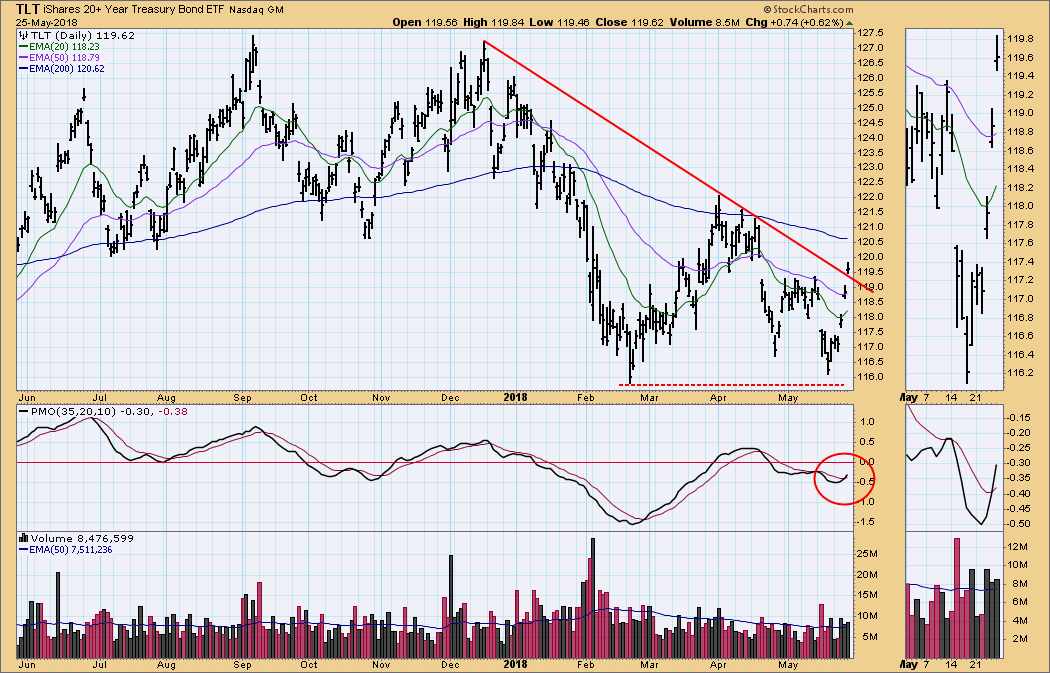
TLT Daily Chart: TLT has advanced over +3% since this month's low, and you can see on the chart that a big chunk of that move came in the last three days of this week. I couldn't find any news that would explain the unexpected change in direction and strength, but the first technical clue came on Wednesday, when the PMO bottomed.
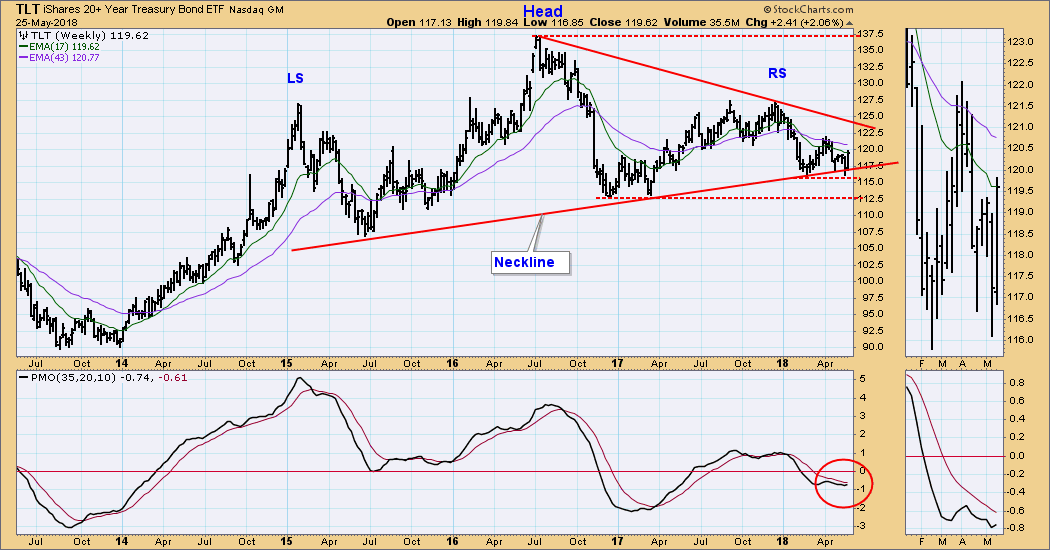
TLT Weekly Chart: In this time frame, price is still churning at the end of a large head and shoulders formation, and the weekly PMO has bottomed. Nevertheless, there is a lot of overhead resistance to be overcome before TLT makes it to new, all-time highs. My outlook on bonds remains negative.
**Don't miss any of the DecisionPoint commentaries! Go to the "Notify Me" box toward the end of this blog page to be notified as soon as they are published.**
Technical Analysis is a windsock, not a crystal ball.
Happy Charting!
- Carl
NOTE: The signal status reported herein is based upon mechanical trading model signals, specifically, the DecisionPoint Trend Model. They define the implied bias of the price index based upon moving average relationships, but they do not necessarily call for a specific action. They are information flags that should prompt chart review. Further, they do not call for continuous buying or selling during the life of the signal. For example, a BUY signal will probably (but not necessarily) return the best results if action is taken soon after the signal is generated. Additional opportunities for buying may be found as price zigzags higher, but the trader must look for optimum entry points. Conversely, exit points to preserve gains (or minimize losses) may be evident before the model mechanically closes the signal.
Helpful DecisionPoint Links:
DecisionPoint Shared ChartList and DecisionPoint Chart Gallery
Price Momentum Oscillator (PMO)
Swenlin Trading Oscillators (STO-B and STO-V)

