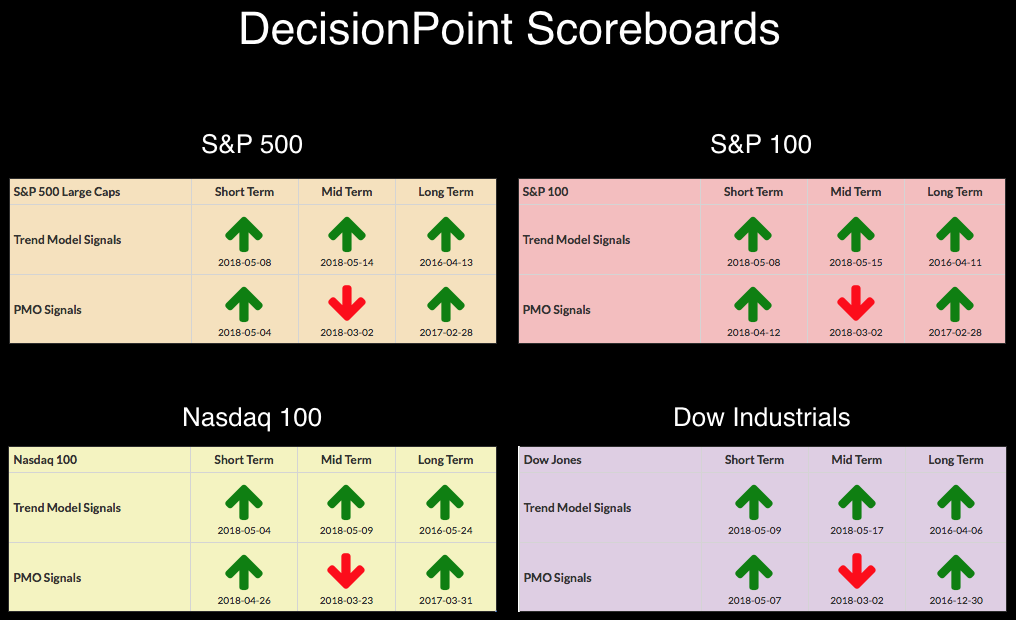
 It looks like I may actually have a week without a signal change on the DecisionPoint Scoreboards. Currently all trends are bullish, although momentum isn't positive in the intermediate term. The IT PMO signals are derived from the weekly PMO. The weekly PMOs are mostly flat and directionless with quite a bit of margin to cover before triggering any crossover BUY signals. Despite that, IT indicators are still quite positive and suggest a rally resumption.
The DecisionPoint Weekly Wrap presents an end-of-week assessment of the trend and condition of the stock market (S&P 500), the U.S. Dollar, Gold, Crude Oil, and Bonds.
SECTORS
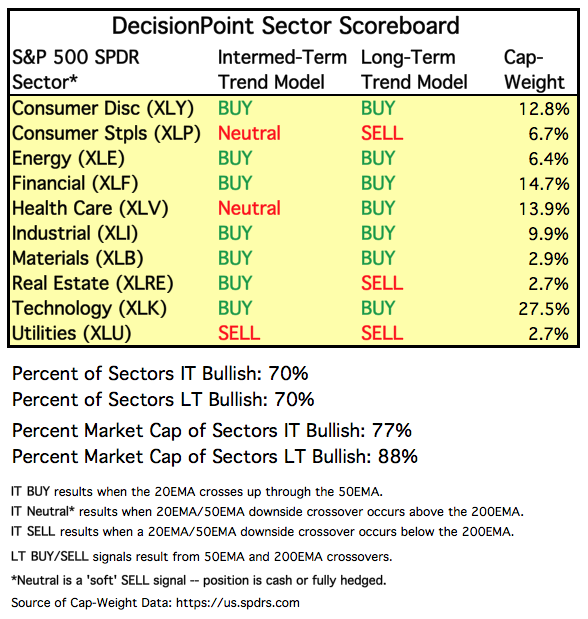
Each S&P 500 Index component stock is assigned to one, and only one, of 10 major sectors. This is a snapshot of the Intermediate-Term and Long-Term Trend Model signal status for those sectors.
You'll notice we are seeing more IT BUY signals appearing back on the DP Sector Scoreboard. It's changes like these that tell me this is not likely a bear market, but a correction that is now getting long in the tooth.
STOCKS
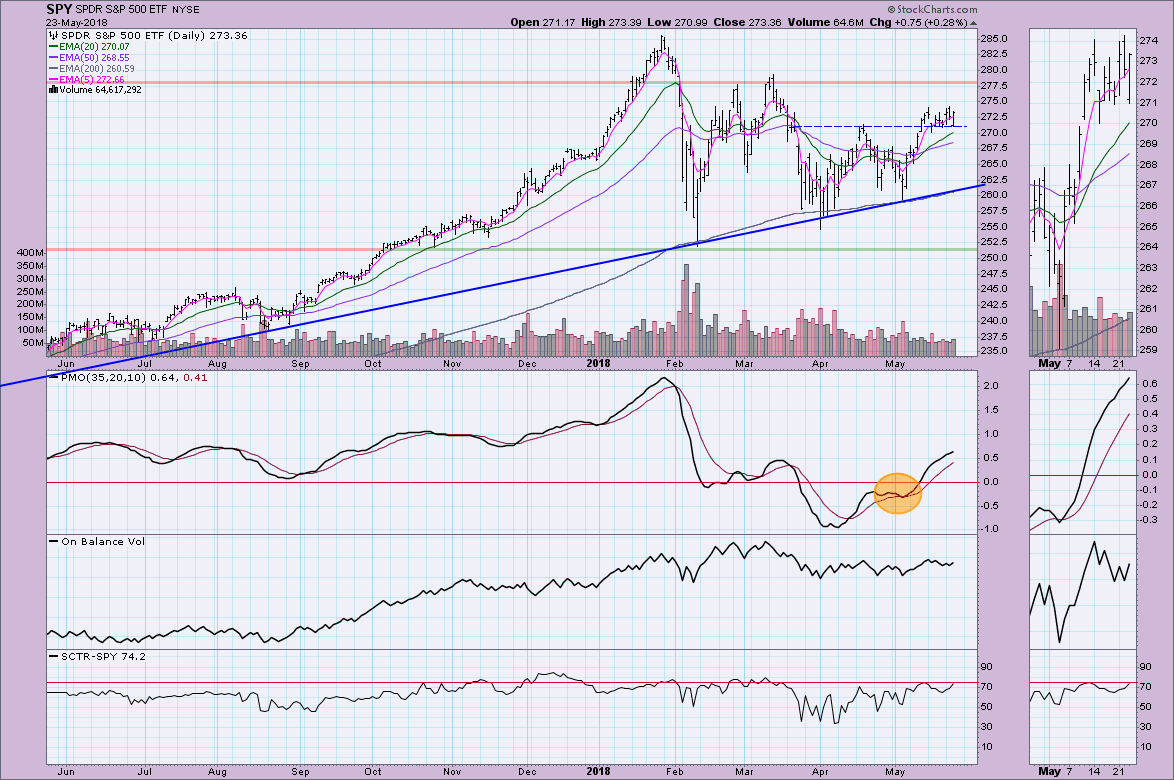
IT Trend Model: BUY as of 5/11/2018
LT Trend Model: BUY as of 4/1/2016
SPY Daily Chart: Carl pointed out in last week's DP Weekly Wrap that price has consolidated into a nice bull flag formation. Also bullish would be price holding on to support at the April top. The PMO is far from overbought and can accommodate more upside. I agree with Carl that it appears investors are cautious about a rally resumption, but not bearish enough to sell off. I suspect the flag will execute and we should see all-time highs challenged or at least the March top.
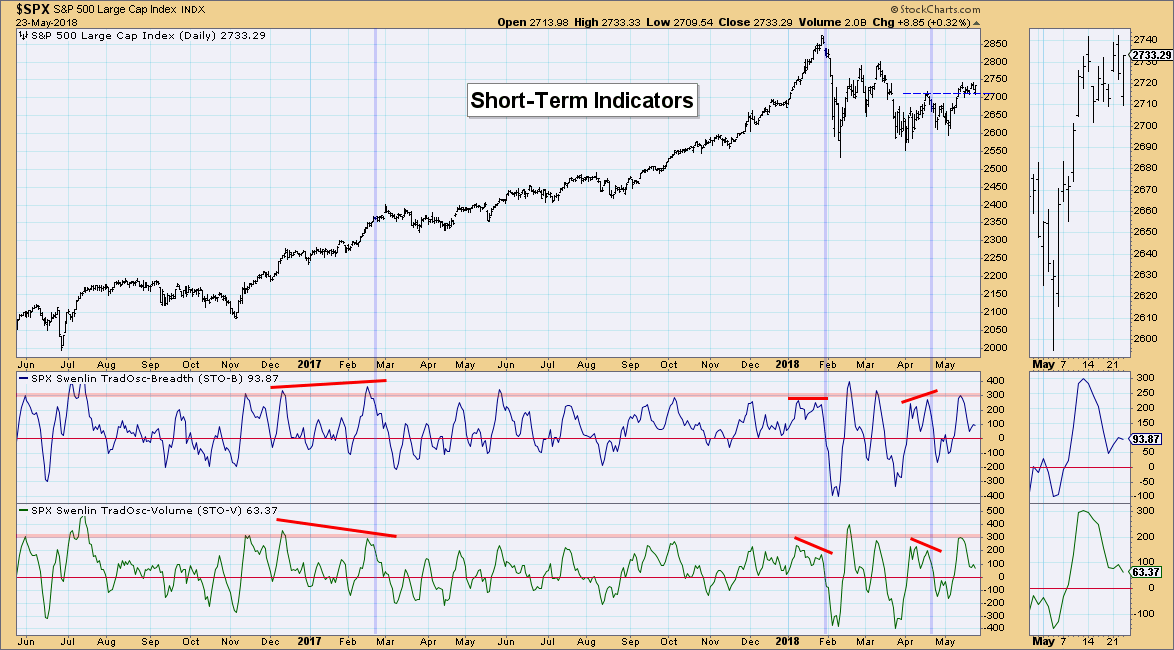
Short-Term Market Indicators: These indicators have managed to decompress over the past week or so as price began consolidating which is exactly what we needed them to do. They remain above the zero line and although they have twitched down, I still think this set-up is bullish.
Intermediate-Term Market Indicators: Both the ITBM and ITVM have broken out from the declining tops trendline. They have decelerated somewhat, but are still rising. Additionally, they are not overbought and like the short-term Swenlin Trading Oscillators (STOs) above, they can accommodate plenty of upside.
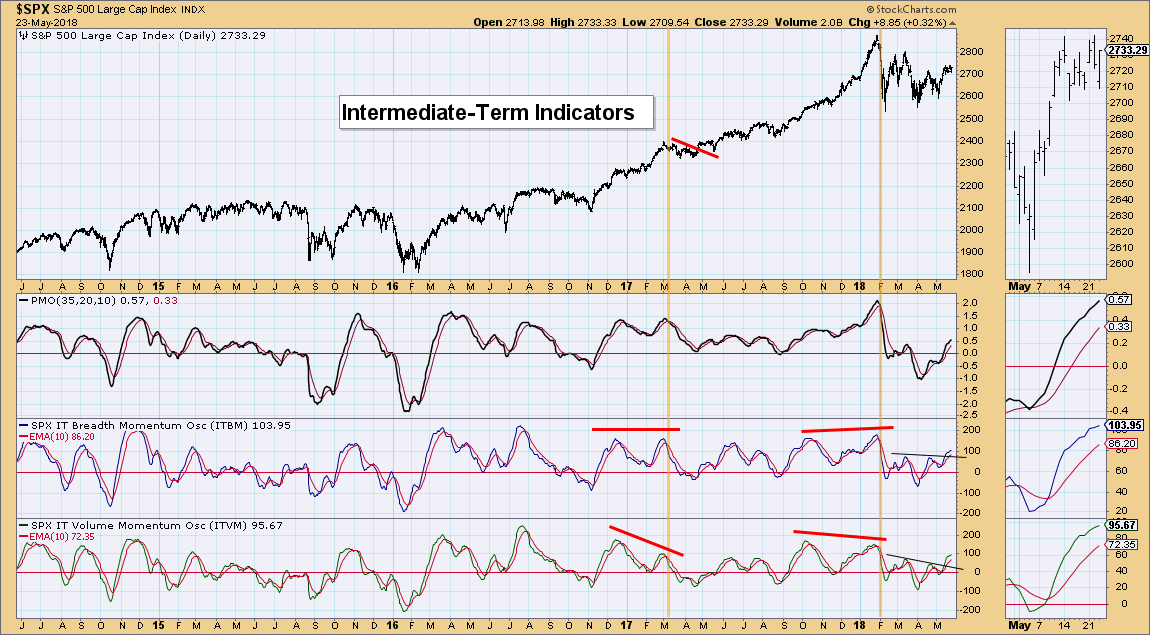
Conclusion: I've been hesitant to get overly bullish in my blog articles and on the MarketWatchers LIVE program because I was seeing unusual deterioration in some sectors and certainly in our indicators. Investors are showing some hesitance or neutrality. Sentiment being contrarian, we don't want to see bullish exuberance yet, so this is positive. Now that indicators have turned up and sector SPDRs are flipping to IT BUY signals again, I feel more confident in a rally and probable move back to test all-time highs.
DOLLAR (UUP)
IT Trend Model: BUY as of 4/24/2018
LT Trend Model: SELL as of 5/24/2017
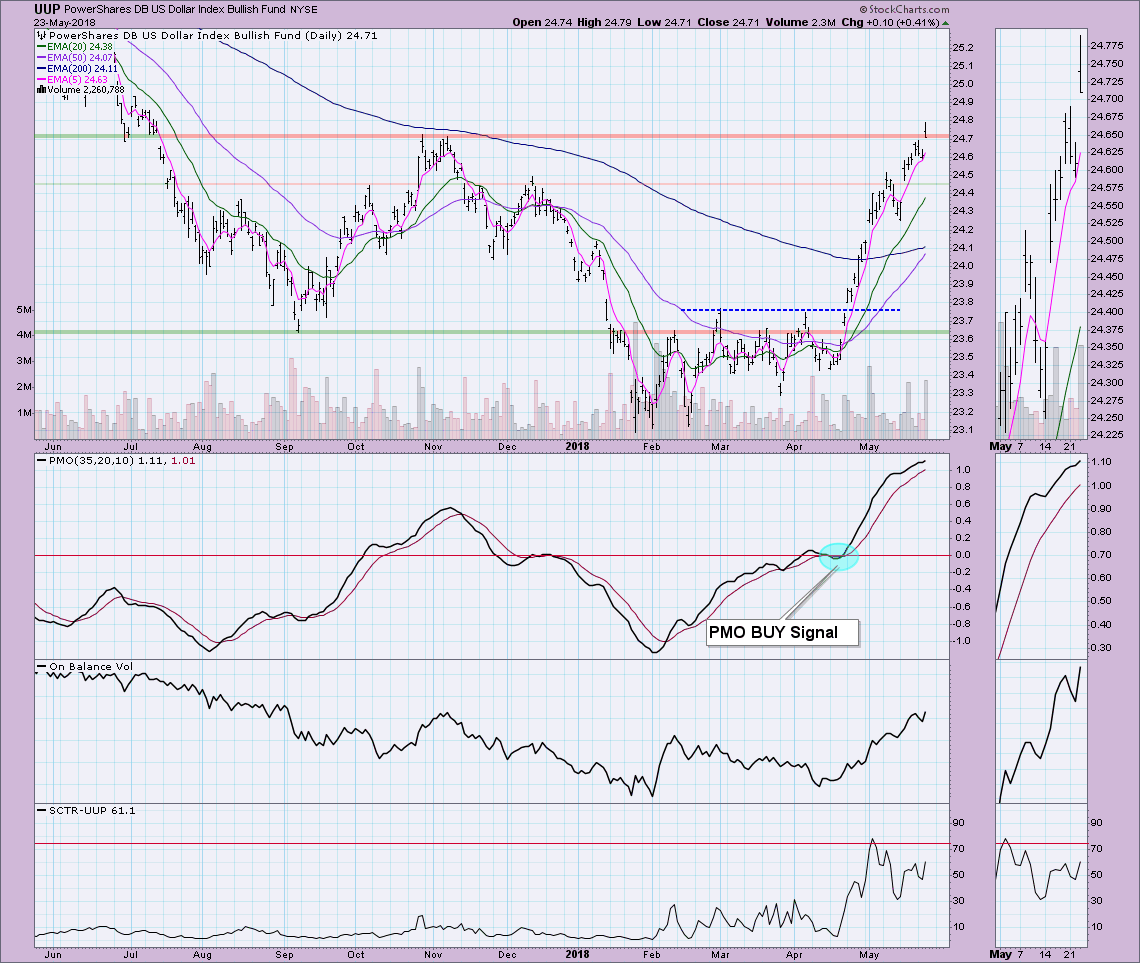
UUP Daily Chart: UUP broke out on a gap up today. The chart looks promising, but the PMO is very overbought right now. This would actually be a great place for the Dollar to consolidate and reel in the PMO. After breaking through important overhead resistance at the November 2017 high, I can't get bearish on the Dollar. Additionally, I note that we are about to see a golden cross of the 50/200-EMAs; that would give UUP a Long-Term Trend Model BUY signal.
GOLD
IT Trend Model: Neutral as of 5/2/2018
LT Trend Model: BUY as of 4/12/2017
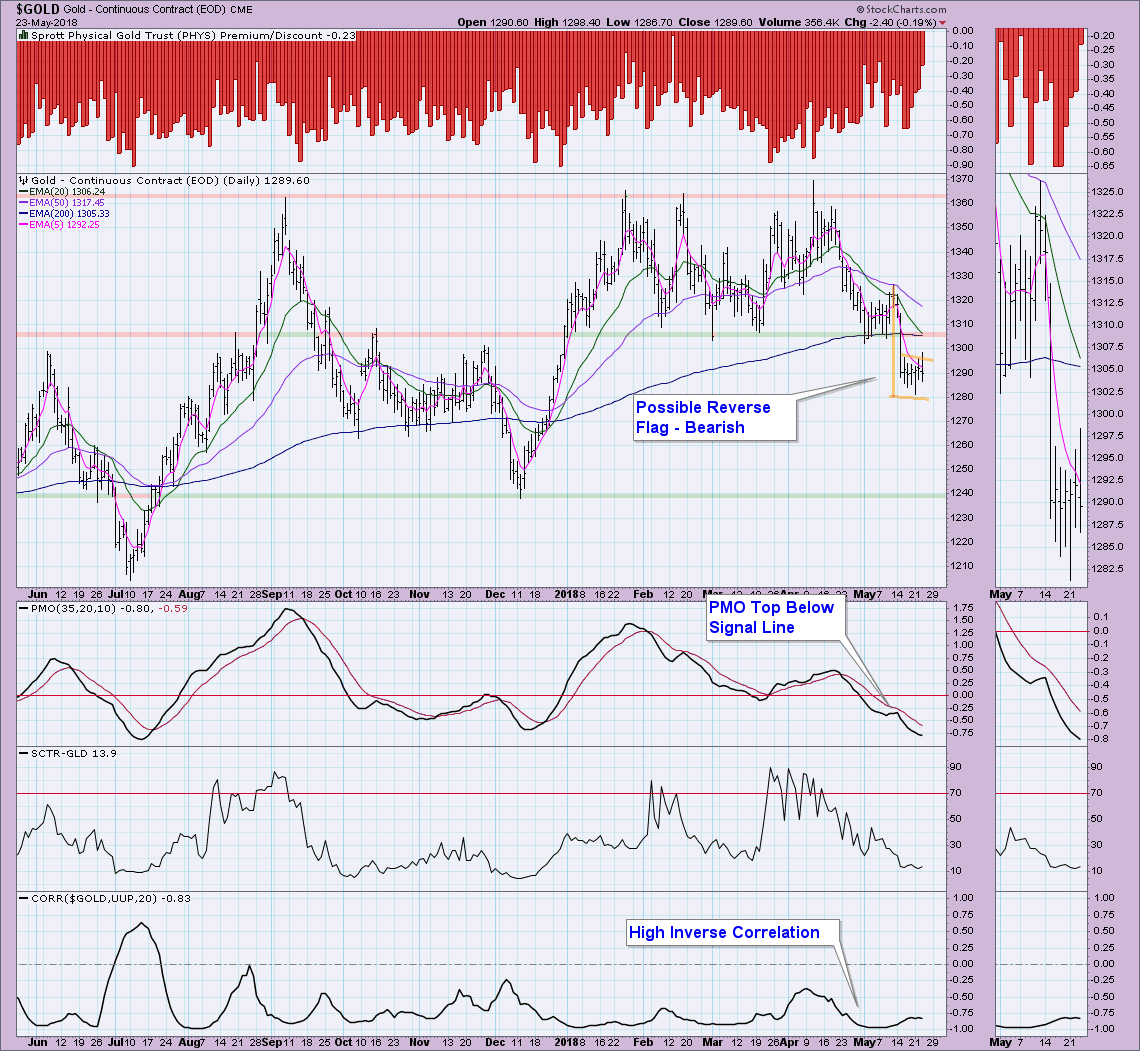
GOLD Daily Chart: First I want you to note that the reverse correlation of Gold to the Dollar is still prevalent. The Dollar is ready to consolidate or pause. Gold has already been doing this. Unfortunately it has formed a bearish reverse flag formation. Price did attempt to break out of the flag to the upside, but suspect it won't be able to break above overhead resistance at about 1308. PMO, OBV and SCTR are all negative right now, so my expectation is bearish for gold. If this reverse flag executes, I would be looking for a test at 1240.
CRUDE OIL (USO)
IT Trend Model: BUY as of 9/6/2017
LT Trend Model: BUY as of 11/2/2017
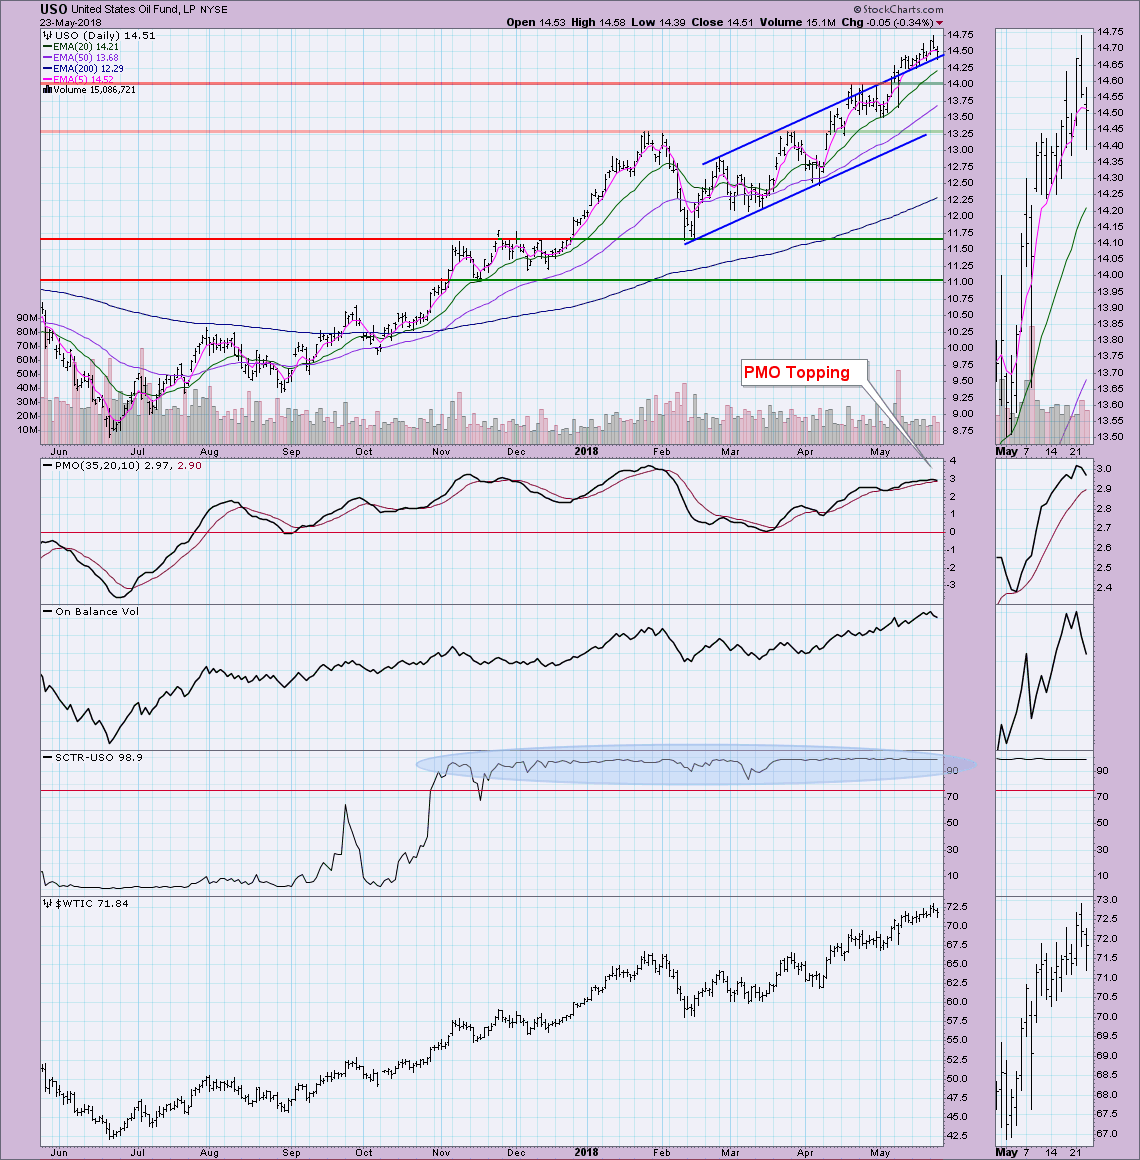
USO Daily Chart: I remain mostly bullish on USO. What concerns me is topping PMO in overbought territory. However, I do note we've seen the PMO reach higher levels. I'm pleased to see that after price broke above the rising trend channel, it managed to trade above the channel.
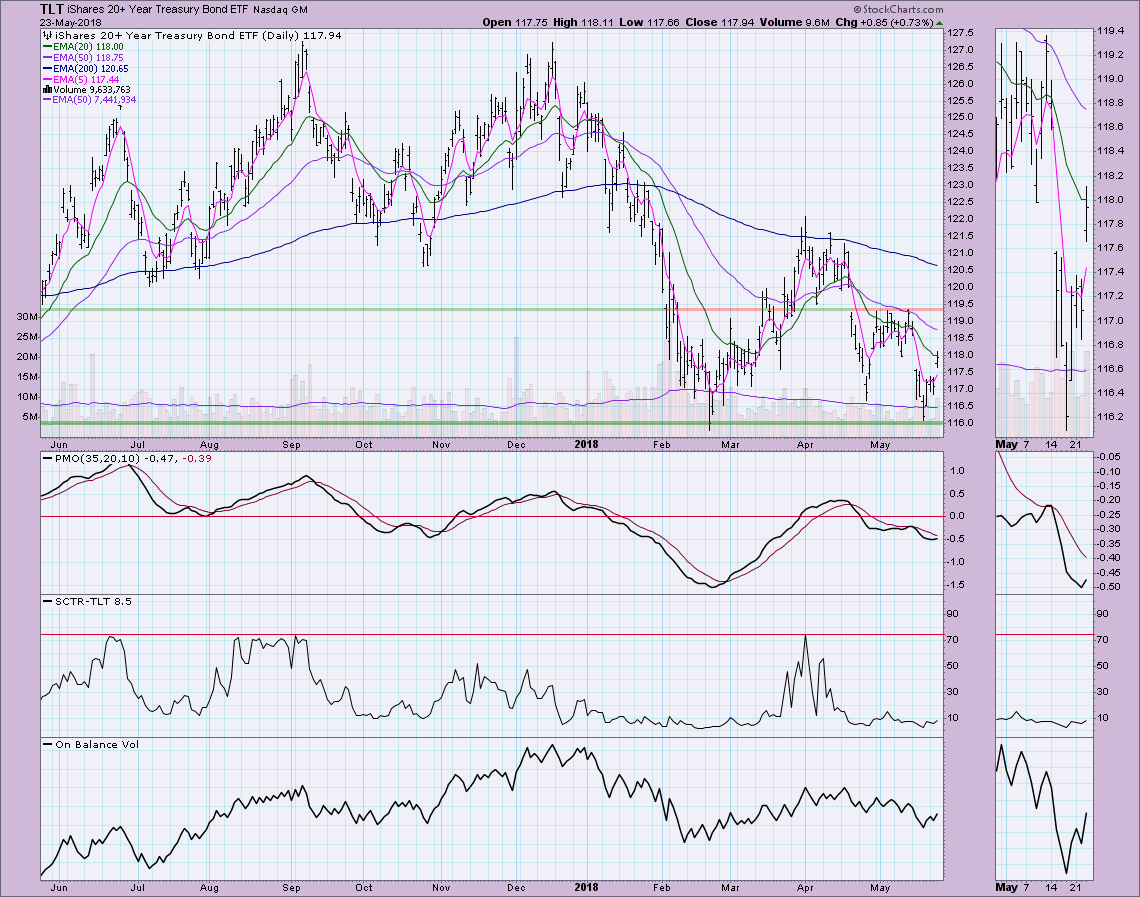
BONDS (TLT)
IT Trend Model: SELL as of 4/20/2018
LT Trend Model: SELL as of 2/8/2018
TLT Daily Chart: Yields rose rapidly last week so we saw a huge decline in Bonds; however, this week the picture is somewhat brighter. Price ended up forming an island and today we saw the reversal and a close of the gap that helped form the island. Unfortunately I don't see enough bullish evidence to look for strength in bonds. We could see a test of overhead resistance around $119.50, but ultimately I am looking for a drop below support at $116.
Technical Analysis is a windsock, not a crystal ball.
Happy Charting!
- Erin
**Don't miss any of the DecisionPoint commentaries! Go to the "Notify Me" box toward the end of this blog page to be notified as soon as they are published.**
NOTE: The signal status reported herein is based upon mechanical trading model signals, specifically, the DecisionPoint Trend Model. They define the implied bias of the price index based upon moving average relationships, but they do not necessarily call for a specific action. They are information flags that should prompt chart review. Further, they do not call for continuous buying or selling during the life of the signal. For example, a BUY signal will probably (but not necessarily) return the best results if action is taken soon after the signal is generated. Additional opportunities for buying may be found as price zigzags higher, but the trader must look for optimum entry points. Conversely, exit points to preserve gains (or minimize losses) may be evident before the model mechanically closes the signal.
Helpful DecisionPoint Links:
DecisionPoint Shared ChartList and DecisionPoint Chart Gallery
Price Momentum Oscillator (PMO)
Swenlin Trading Oscillators (STO-B and STO-V)


