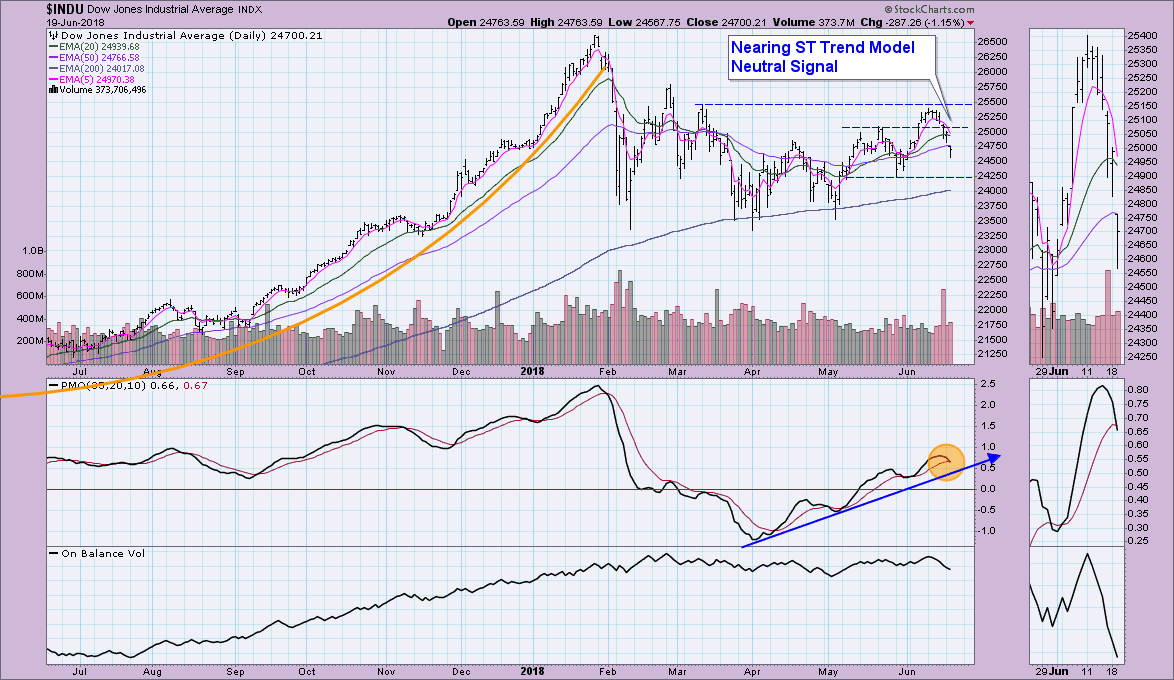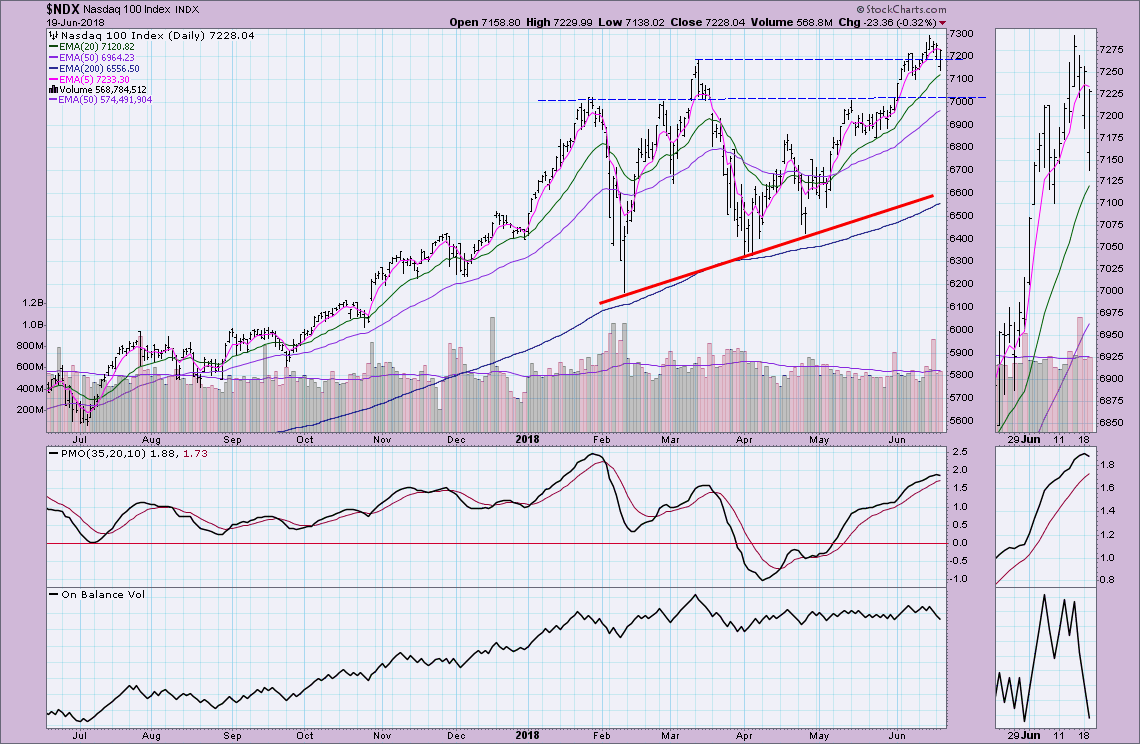
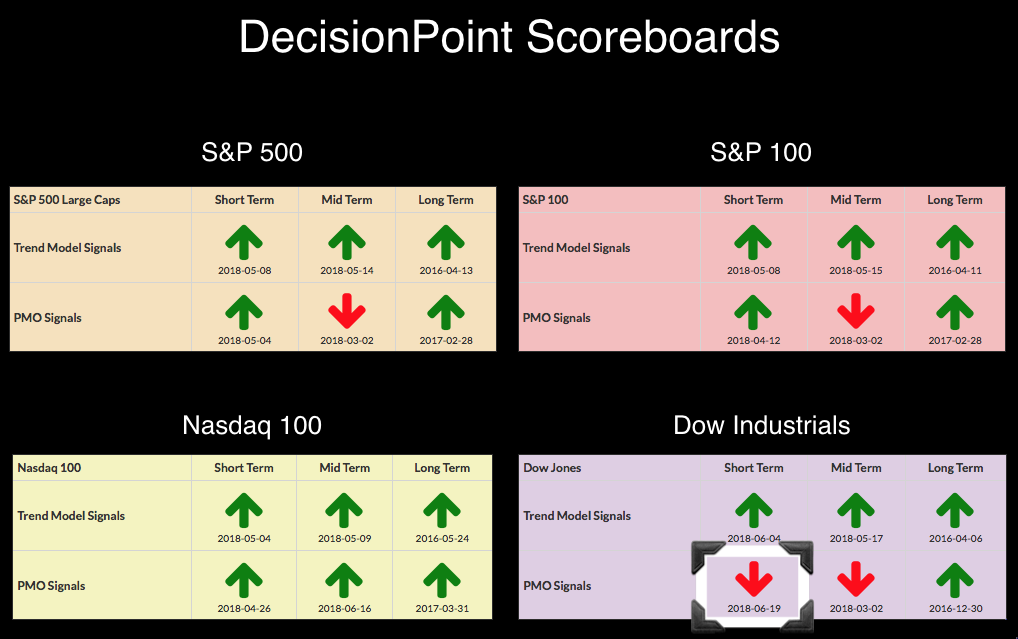
The DecisionPoint Scoreboards nearly made it to "all green" as the NDX was the first to manage a PMO crossover on the weekly chart and the others seemed sure to follow until this recent pullback. To make matters worse, the Dow which had just managed a PMO BUY signal on its daily chart two weeks ago, lost it.
The new PMO BUY signal was triggered when the daily PMO crossed below its signal line. There's plenty to dislike about this chart. While NDX and Small-Caps enjoy new all-time highs, the Dow has floundered. Trading was below the 50-EMA the entire day and the OBV is beginning to dive. Good-ish news is that support seems available in the short term at 24250. And, the rising trend on the PMO hasn't yet been broken despite today's SELL signal.
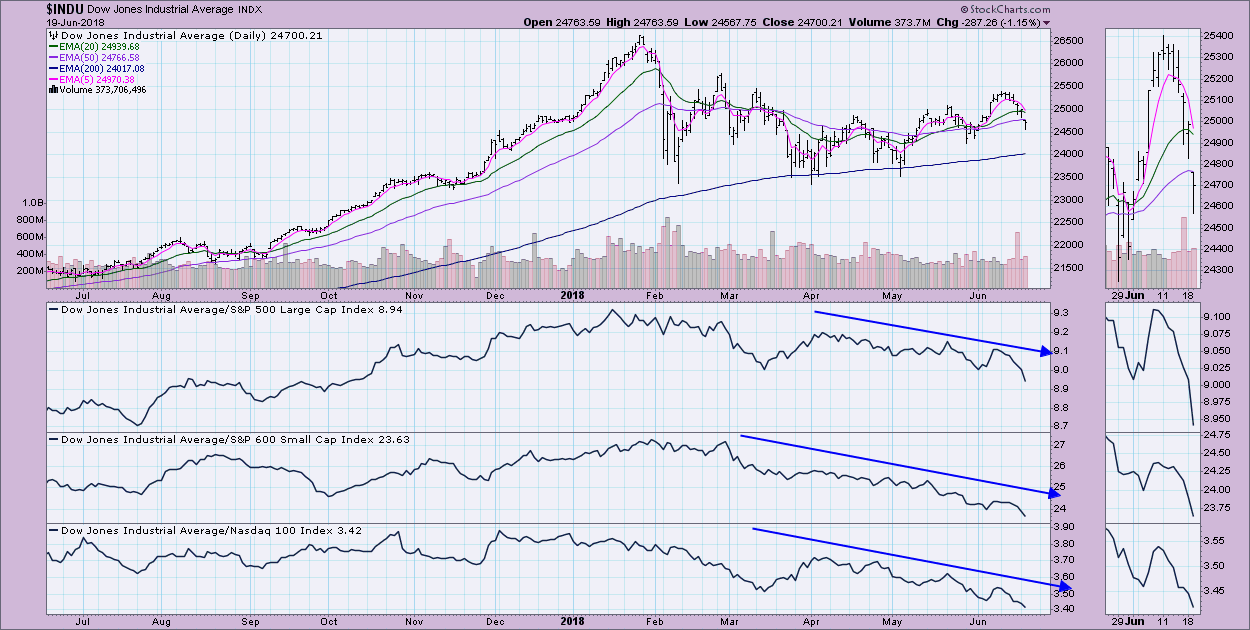
To give you some context on how terrible the Dow has been performing among the major indexes, I annotated a chart that shows price relative to the SPX, NDX and Small-Caps. The ratio is dropping very quickly among all. Note the negative divergence as well; declining tops on the relative ratios and rising tops on price.
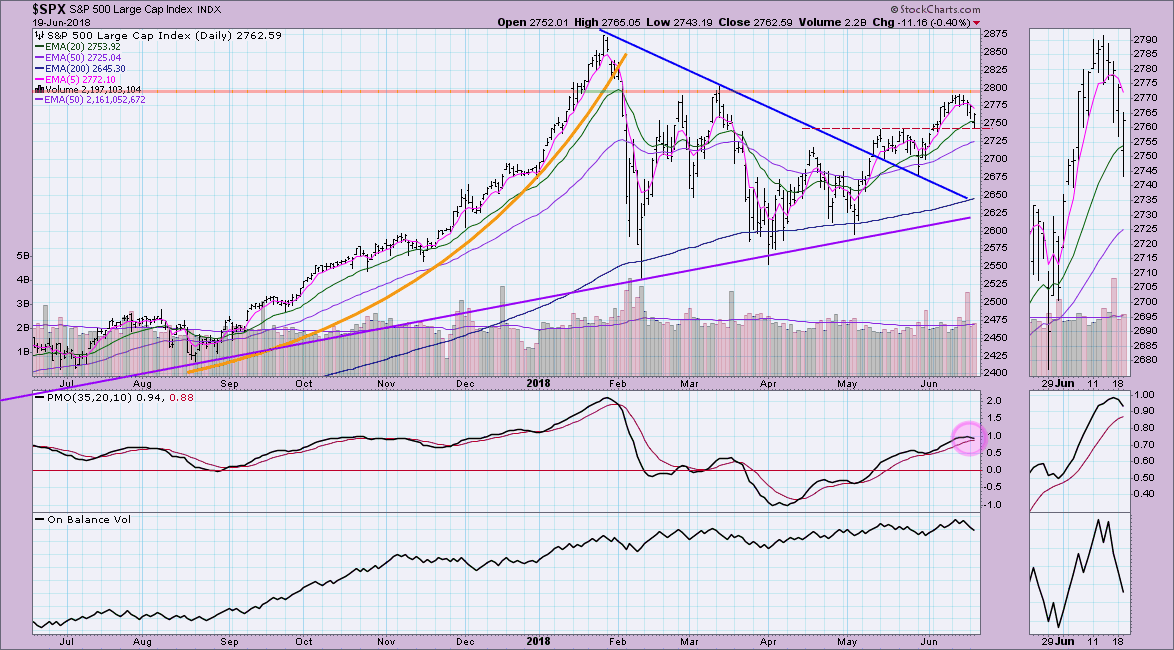
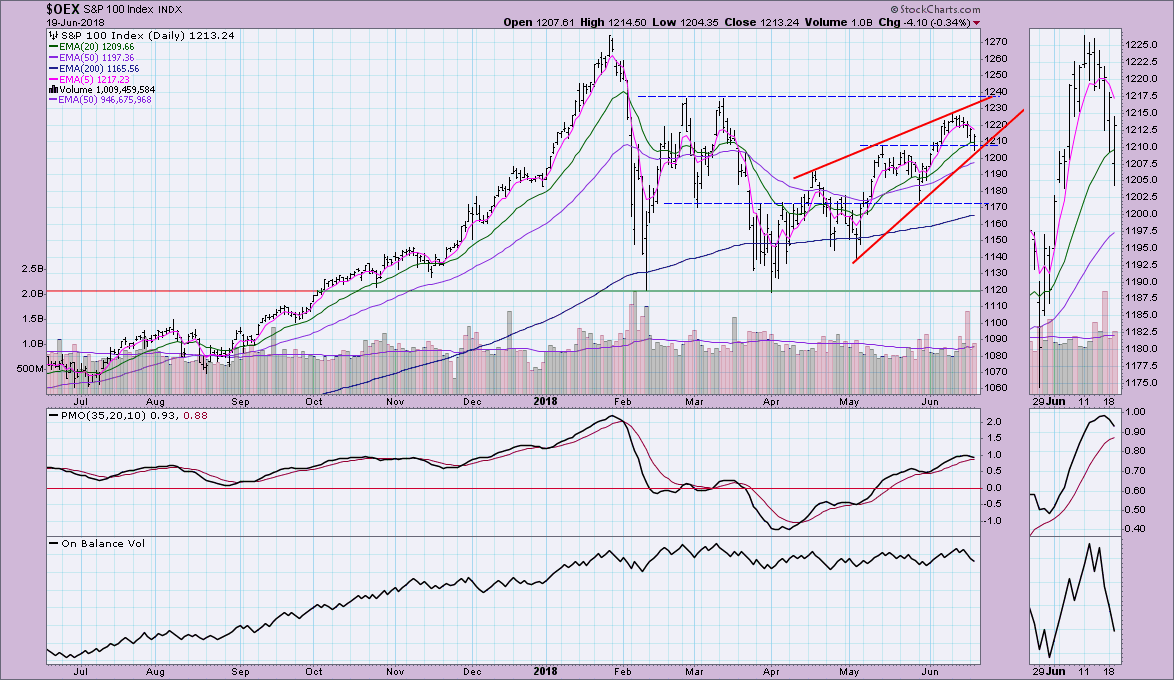
Looking at the rest of the Scoreboard indexes, you'll note that the margin is still thinning between the PMOs and their signal lines. This means all of these indexes are vulnerable to the same fate as the Dow.
Technical Analysis is a windsock, not a crystal ball.
Happy Charting!
- Erin
Helpful DecisionPoint Links:
DecisionPoint Shared ChartList and DecisionPoint Chart Gallery
Price Momentum Oscillator (PMO)
Swenlin Trading Oscillators (STO-B and STO-V)
**Don't miss DecisionPoint Commentary! Add your email below to be notified of new updates"**

