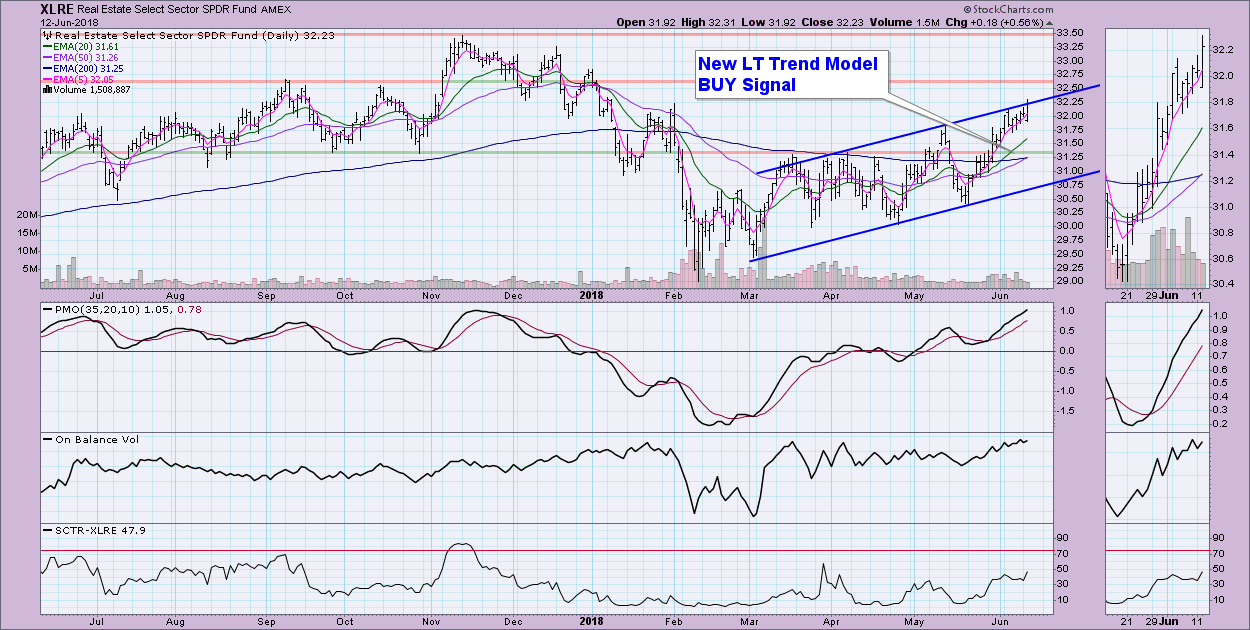
I have alerts set on my ChartList of sector SPDRs that alert me to Trend Model and PMO signal changes (Check our Support area for directions on how to set these). Today the alarm triggered when the Real Estate SPDR (XLRE) had a Long-Term Trend Model BUY signal. An LT Trend Model BUY signal is a 50-EMA positive crossover the 200-EMA. These signals don't happen often, so I try to keep my readers updated as soon as they arrive.
This sector has enjoyed a great rally and rising trend. Consequently, the LT Trend Model BUY signal was triggered. As part of the DecisionPoint analysis process, these positive crossovers move a stock, ETF, etc from a bear market configuration to a bull market configuration. Now that XLRE is in a bullish LT configuration, we can start looking for bullish outcomes. The PMO appears overbought, but I checked its history on XLRE and noted that the range seems to be between -1.5 and 1.5 so the PMO isn't really as overbought as it appears. Resistance is certainly nearing but the indicators and EMAs now support the breakout hypothesis.
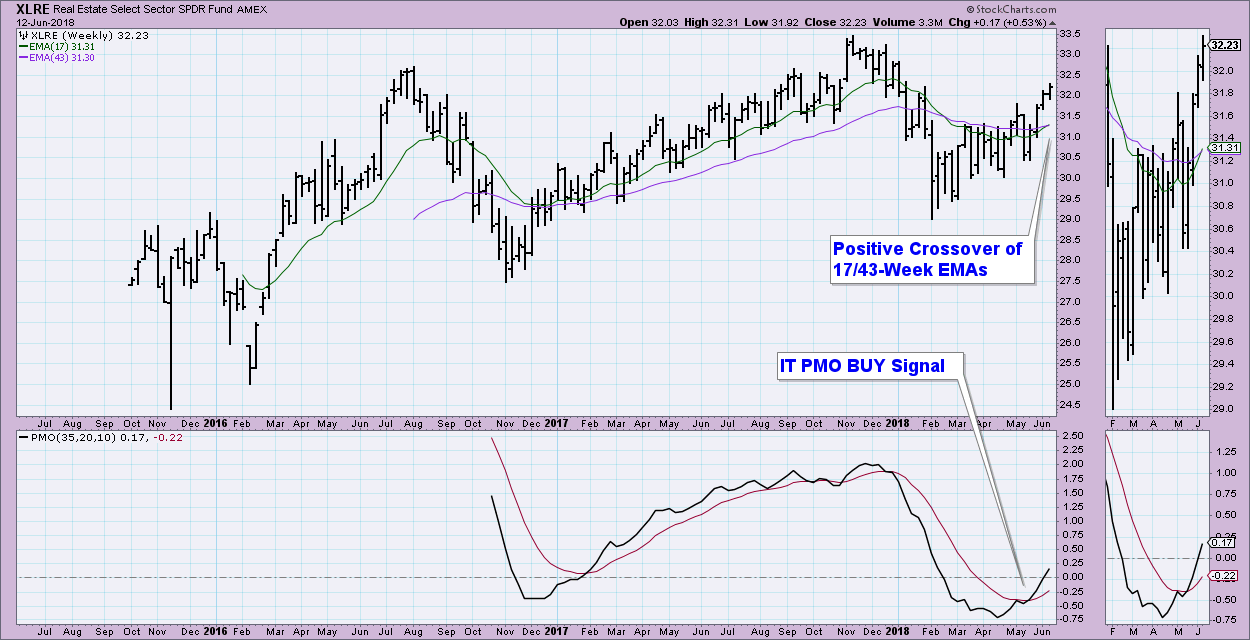
The intermediate term picture is bright. The 17/43-EMAs are in the process of logging a positive crossover (crossovers and signals on the weekly chart don't go final until the final trading day close of the week. This set-up suggests a test of all-time highs.
Conclusion: XLRE is showing LT bullish biases on both the daily and weekly charts so the expectation is higher prices in the long term.
** Corrected Version **
Technical Analysis is a windsock, not a crystal ball.
Happy Charting!
- Erin
Helpful DecisionPoint Links:
DecisionPoint Shared ChartList and DecisionPoint Chart Gallery
Price Momentum Oscillator (PMO)
Swenlin Trading Oscillators (STO-B and STO-V)
**Don't miss DecisionPoint Commentary! Add your email below to be notified of new updates"**


