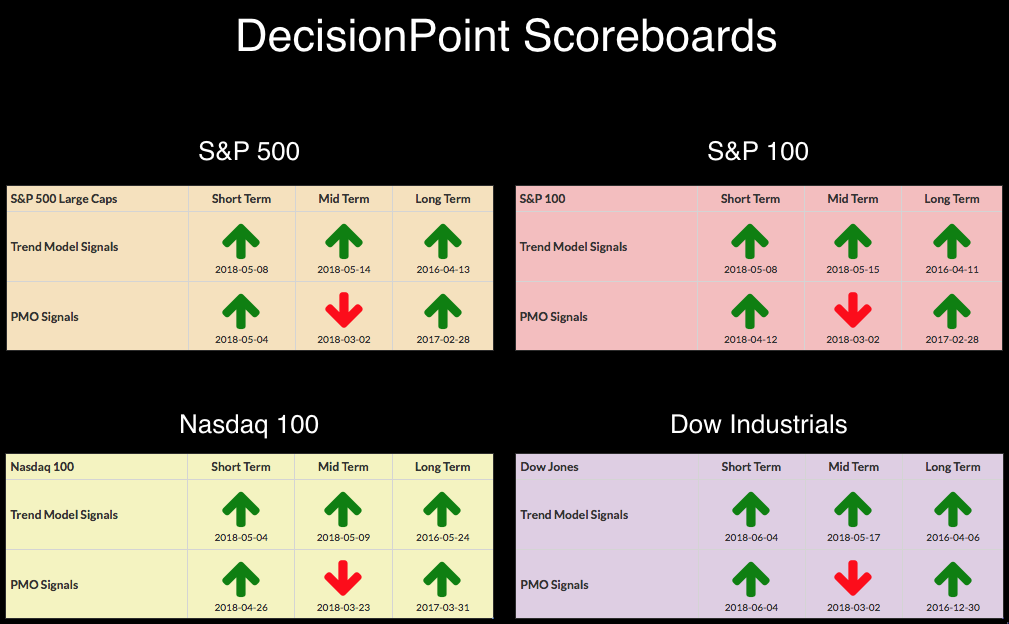
 The DecisionPoint Scoreboards remain bullish, except for intermediate-term PMO SELL signals. Those should be replaced by BUY signals soon as all four indexes have rising PMOs. In fact, the NDX already has the PMO positive crossover on its weekly chart, it just has to remain by the close on Friday when the chart goes final. The market is stalling at resistance and our short-term indicators are confirming that we may have to wait a few more trading days for the breakout.
The DecisionPoint Weekly Wrap presents an end-of-week assessment of the trend and condition of the stock market (S&P 500), the U.S. Dollar, Gold, Crude Oil, and Bonds.
SECTORS
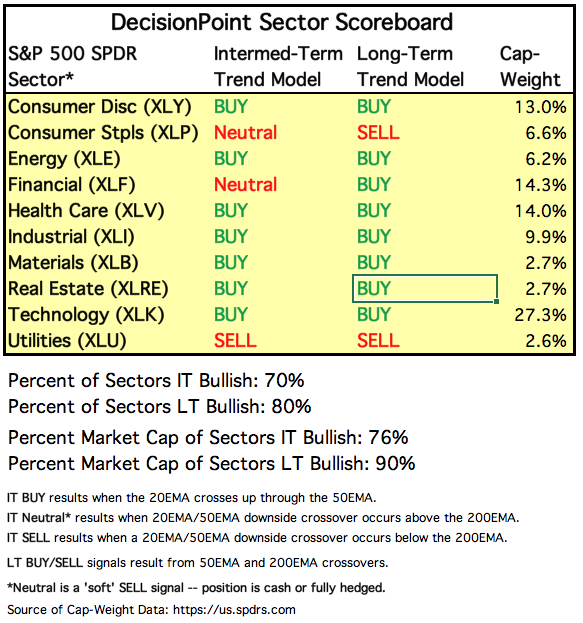
A LT BUY Signal triggered yesterday on XLRE. Currently the only sectors with problems are Staples and Utilities. The Financials are turning up and with interest rates rising, you'll typically see them perk up.
Each S&P 500 Index component stock is assigned to one, and only one, of 10 major sectors. This is a snapshot of the Intermediate-Term and Long-Term Trend Model signal status for those sectors.
STOCKS
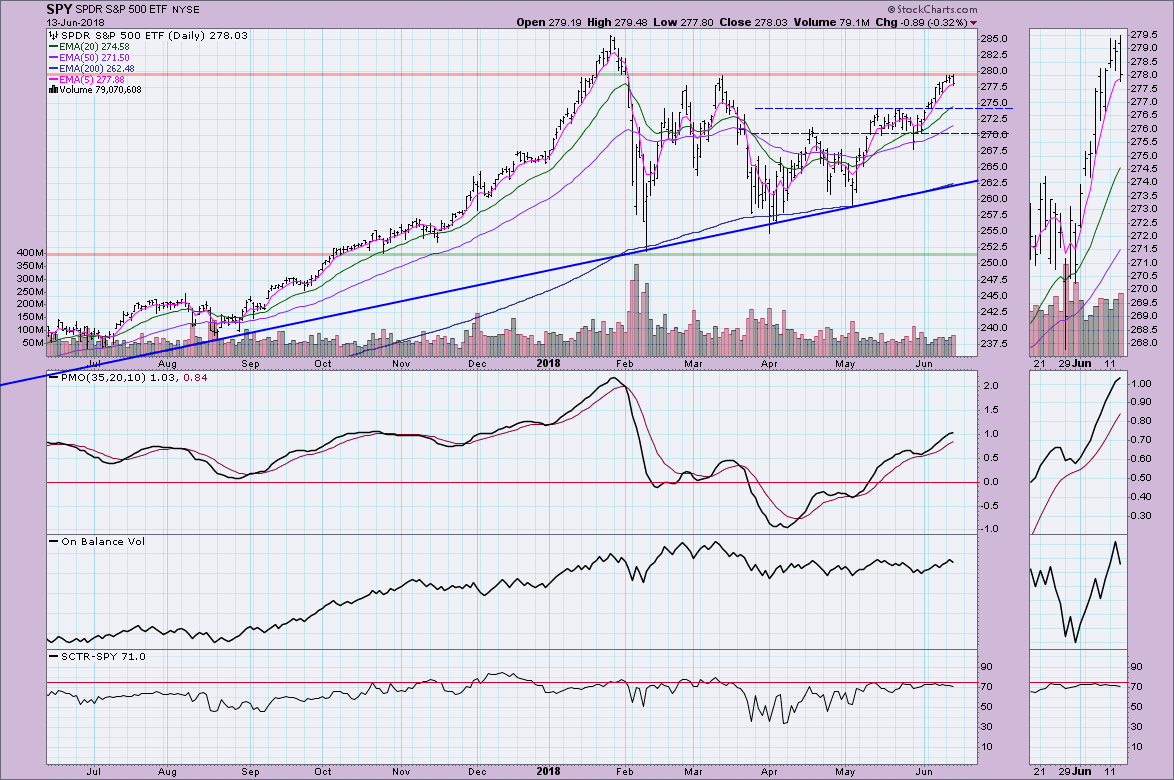
IT Trend Model: BUY as of 5/11/2018
LT Trend Model: BUY as of 4/1/2016
SPY Daily Chart: Carl pointed out on Friday that overhead resistance was nearing for the SPY. It hit that resistance this week and has been stuck. I don't see much deterioration of the PMO, SCTR and OBV, so I suspect that rather than a sharp decline after another failed test, we'll see consolidation or a small pullback.
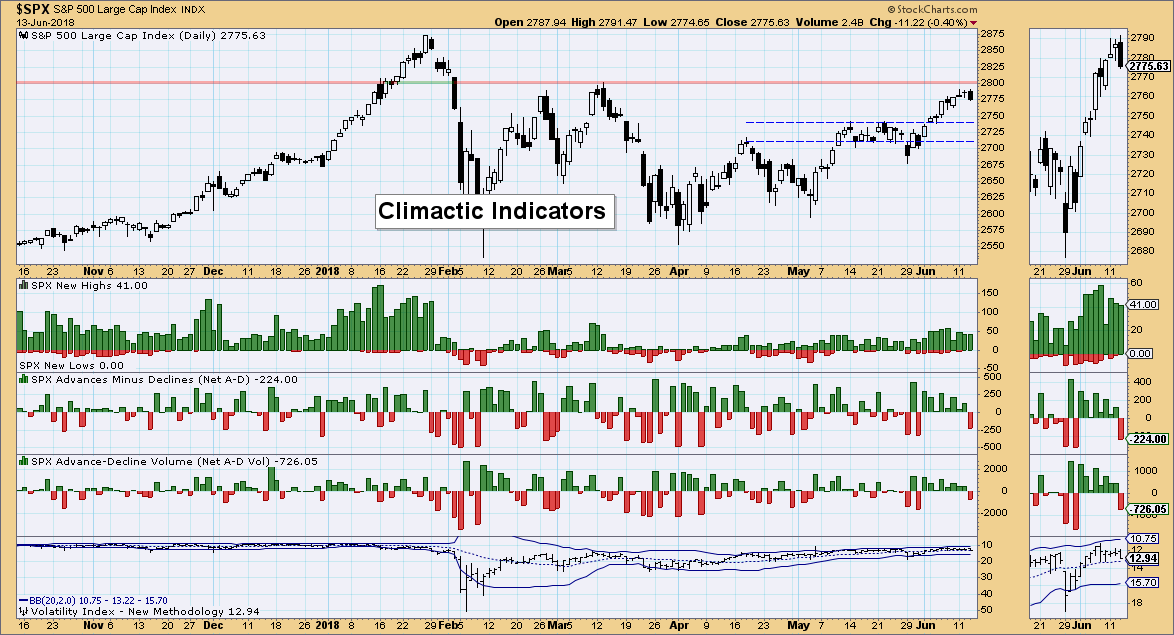
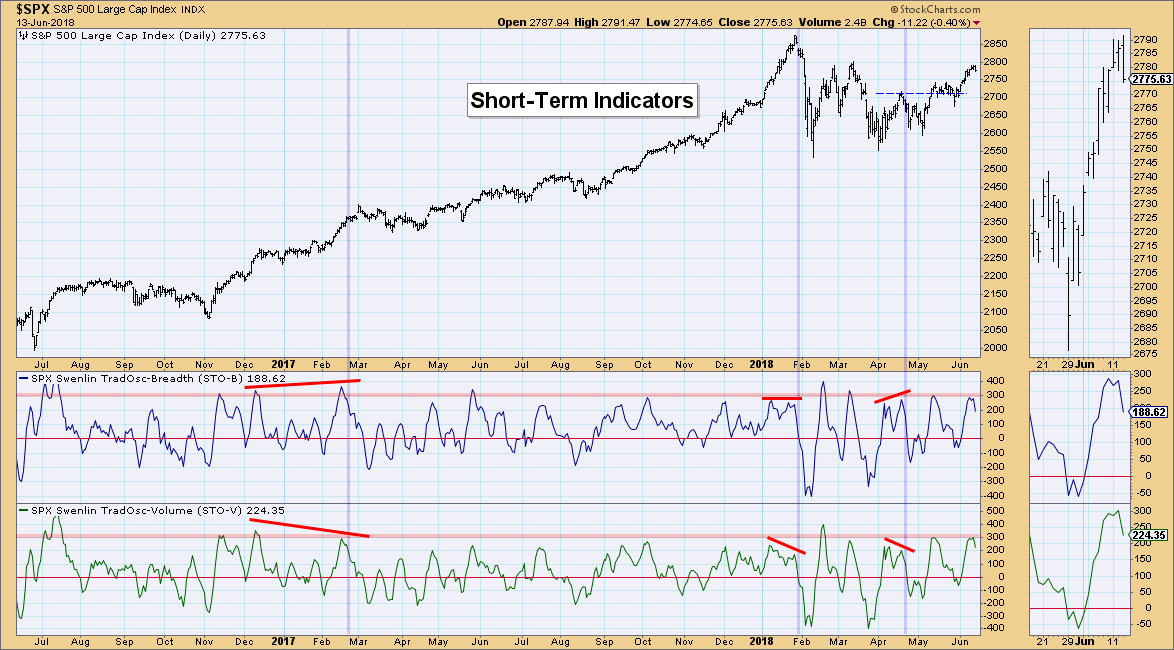
Climactic Market Indicators: Nothing much here. We are finally seeing some negative breadth on Net A-Ds, but not really climactic enough and not accompanied by any new lows. The VIX is low and sitting on its average, so unfortunately not much here this week.
Short-Term Market Indicators: These are very bearish. They topped in overbought territory and appear heading down with little resistance. As noted above, indicators haven't deteriorated enough, so I would look for these indicators to unwind with a small pullback or consolidation.
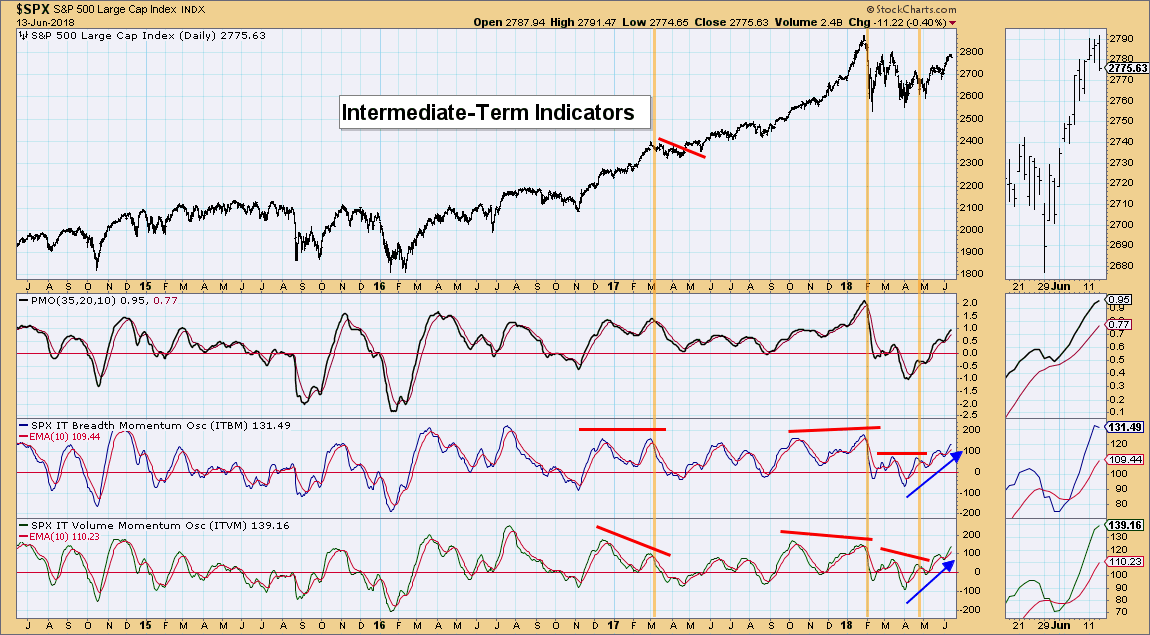
Intermediate-Term Market Indicators: These all remain positive. Rising trends aren't being compromised and we only see a small twitch lower on the ITBM.
Conclusion: Price's failure to break above resistance is troublesome. The short-term Swenlin Trading Oscillators are heading lower quickly; however, with the SPY's PMO, OBV and SCTR I am not looking for a deep decline. More likely we will see some consolidation or a small pullback to clear overbought conditions on the Swenlin Trading Oscillators.
DOLLAR (UUP)
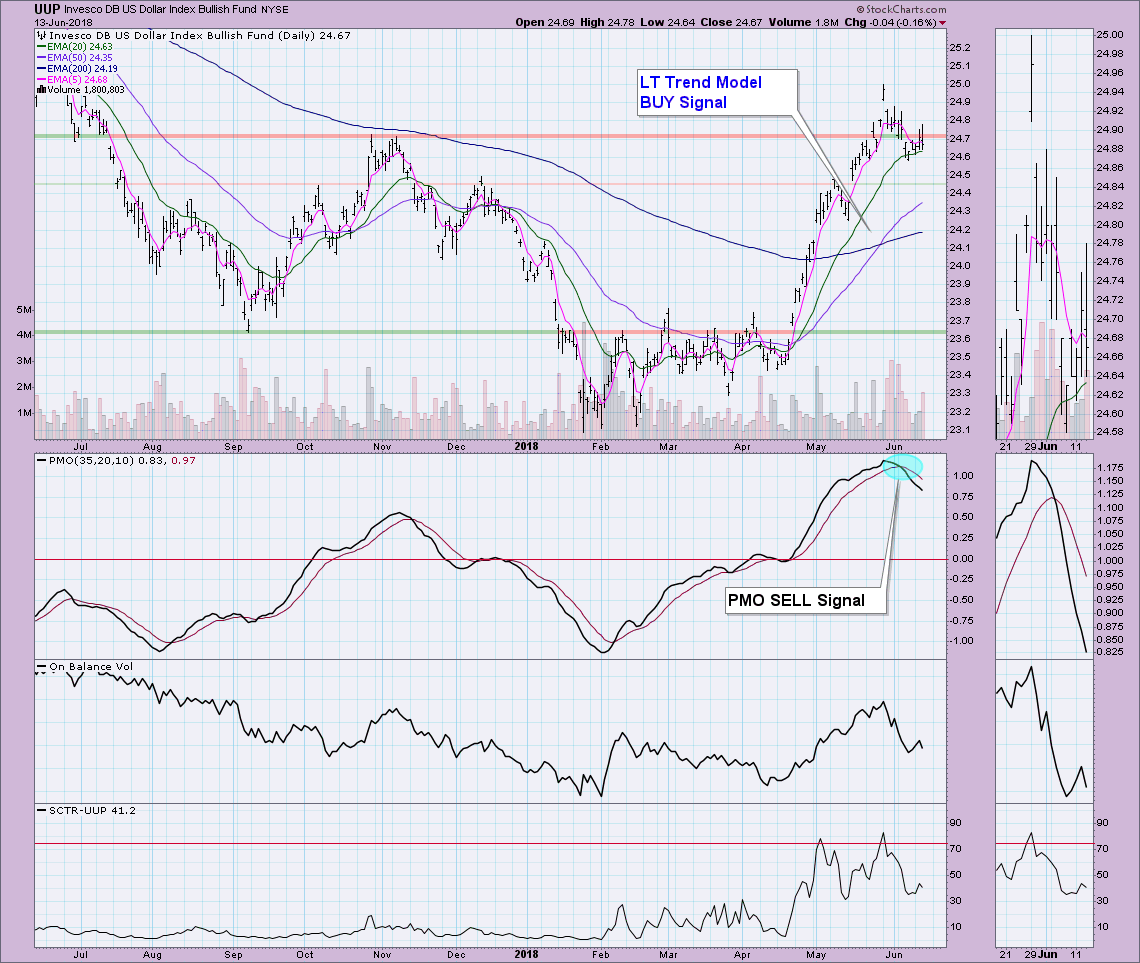
IT Trend Model: BUY as of 4/24/2018
LT Trend Model: BUY as of 5/25/2018
UUP Daily Chart: UUP bounced off its 20-EMA which is good. I don't like that it is accompanied by a declining PMO. The Dollar may struggle longer at resistance, but ultimately, the EMAs are configured positively and a look at the weekly chart shows gathering momentum.
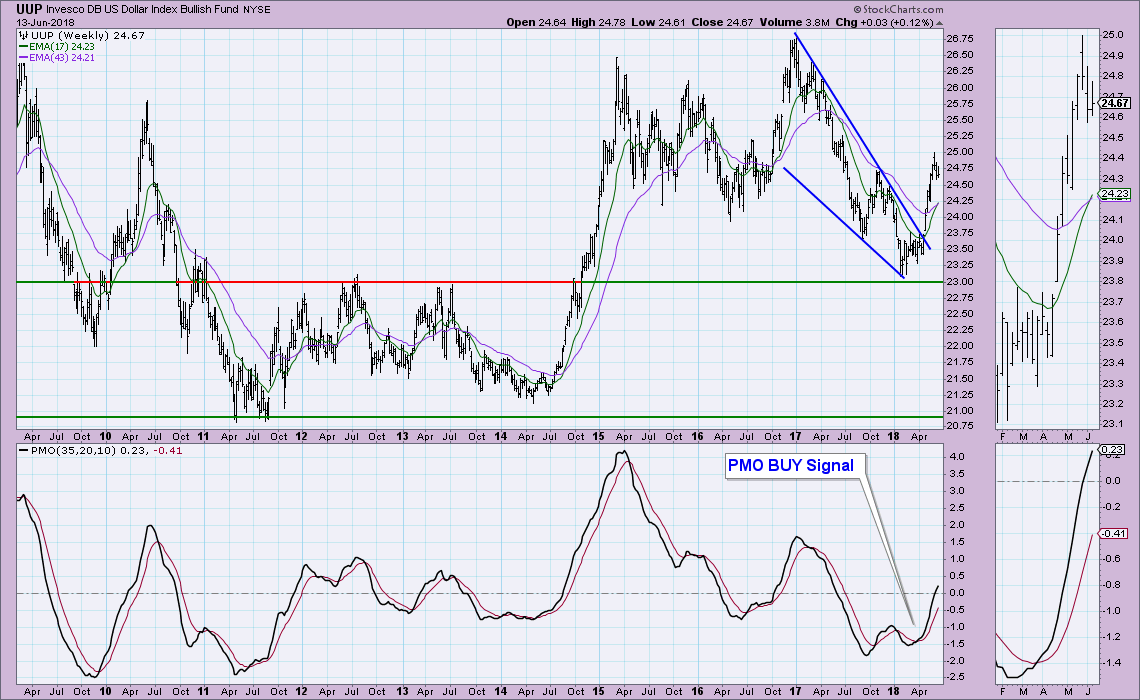
The 17-week EMA just crossed above the 43-week EMA on UUP and it could be forming a flag. It may take a bit more consolidation or a pullback to clear the PMO overbought conditions on the daily chart, but the longer-term picture still looks good.
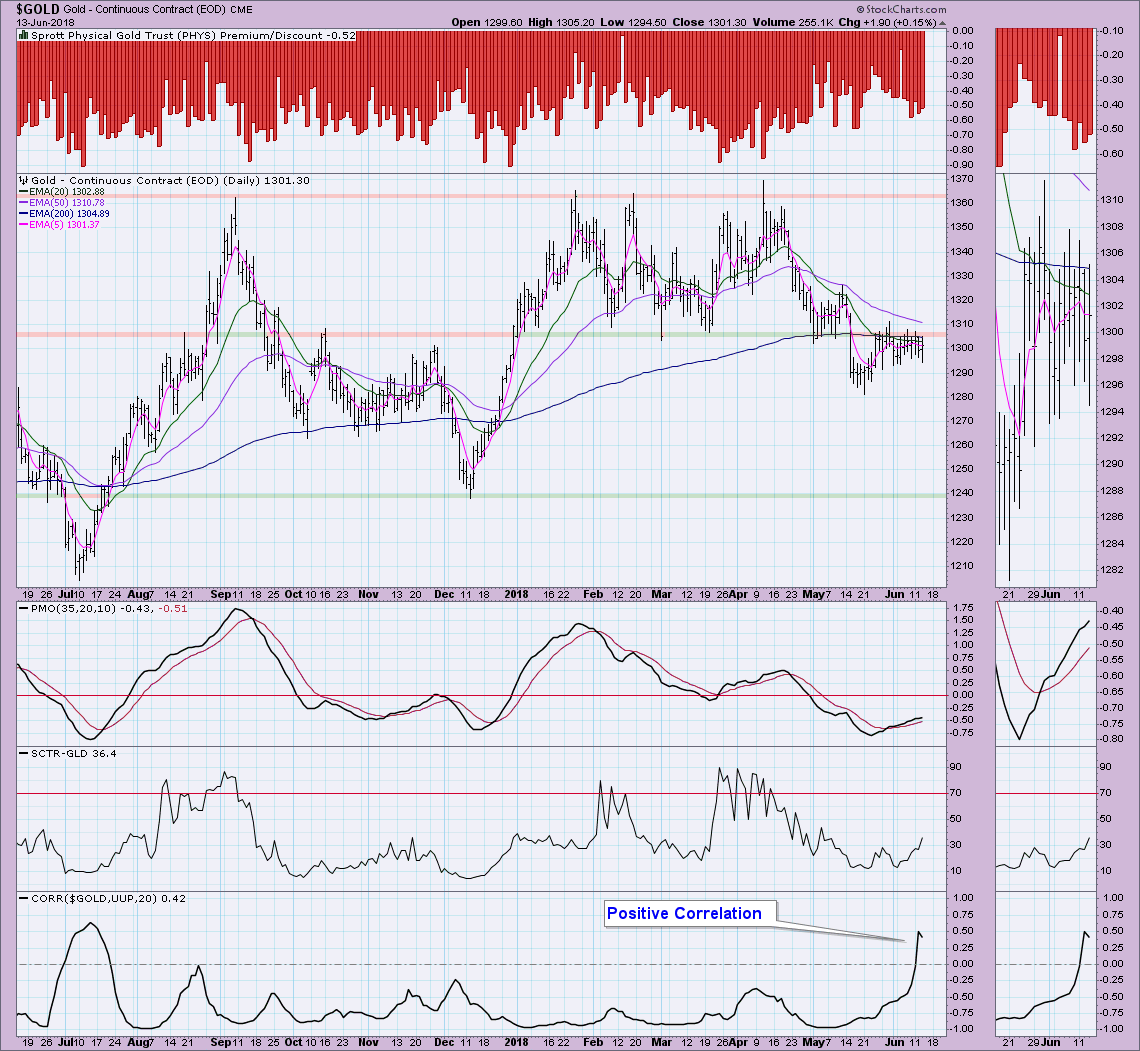
GOLD
IT Trend Model: Neutral as of 5/2/2018
LT Trend Model: BUY as of 4/12/2017
GOLD Daily Chart: The news today is that we how have a positive correlation between the Dollar and Gold. As you can see it doesn't happen often. I don't think this is good news for Gold in the short term given that the Dollar may consolidate or pullback a bit more. This suggests that Gold could be vulnerable to the same fate. Overhead resistance is holding strongly. I see a slight positive divergence between price and the PMO. Notice the PMO is rising even though for the most part we've seen Gold moving sideways. The SCTR is also improving. For the record, I put more weight on the indicators than the correlation.
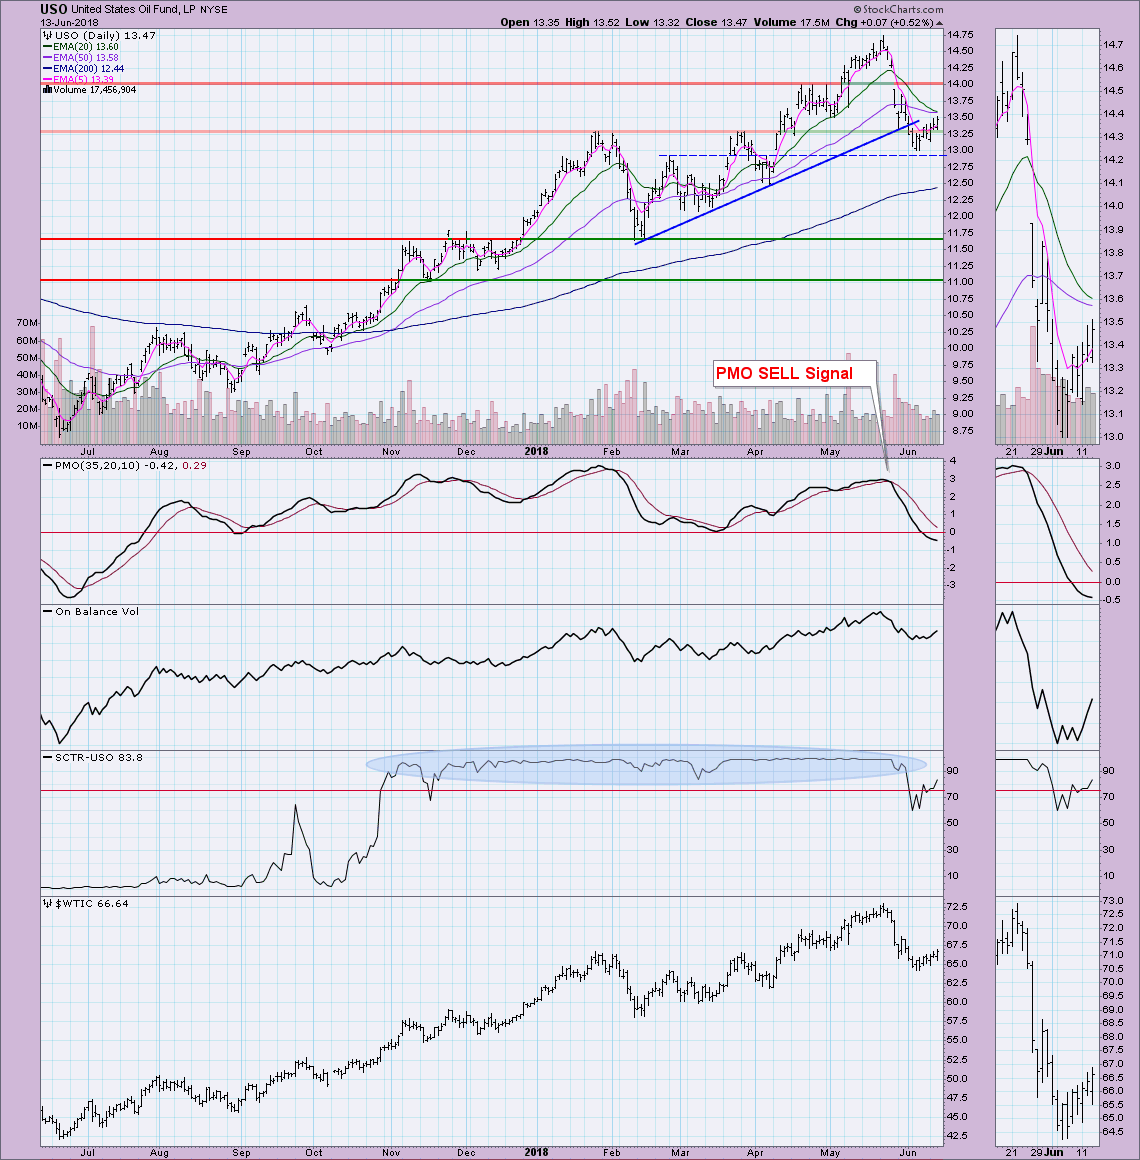
CRUDE OIL (USO)
IT Trend Model: BUY as of 9/6/2017
LT Trend Model: BUY as of 11/2/2017
USO Daily Chart: USO is making a come back after bouncing off support along the late February top. We're just about ready to get an Intermediate-Term Trend Model Neutral signal since the 20-EMA is about ready to cross below the 50-EMA. Since both EMAs are above the 200-EMA, it would be a neutral signal and not a sell signal. Indicators are definitely improving as the PMO begins to scoop up with OBV. The SCTR is also back in the hot zone. I'm looking for price to test overhead resistance at $14.00.
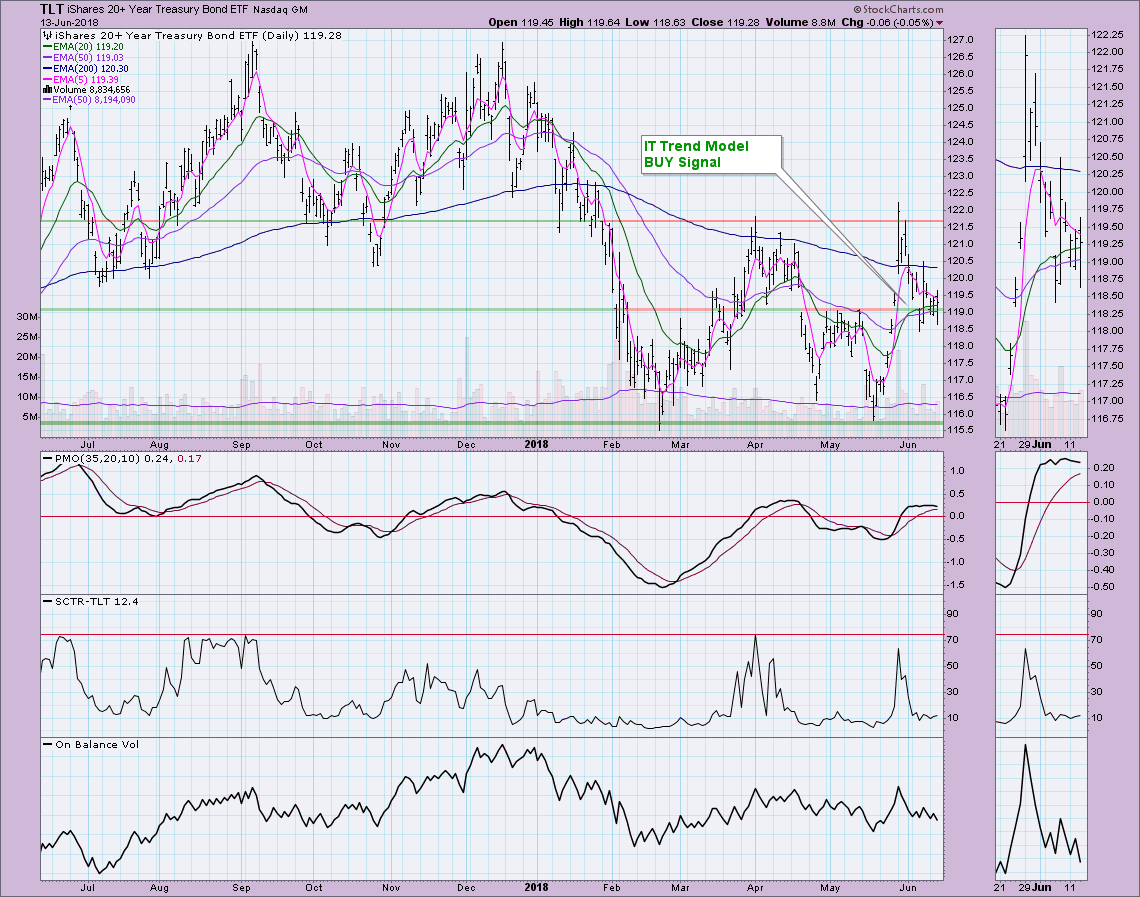
BONDS (TLT)
IT Trend Model: SELL as of 4/20/2018
LT Trend Model: SELL as of 2/8/2018
TLT Daily Chart: The PMO is heading for a negative crossover begrudgingly as price oscillates around the 20-EMA, not showing much acceleration/momentum. OBV is trending lower and the SCTR is heading further into the basement. The announcement today of the rate hikes that are on their way should cause TLT to fall, and the indicators seem to support that.
Technical Analysis is a windsock, not a crystal ball.
Happy Charting!
- Erin
**Don't miss any of the DecisionPoint commentaries! Go to the "Notify Me" box toward the end of this blog page to be notified as soon as they are published.**
NOTE: The signal status reported herein is based upon mechanical trading model signals, specifically, the DecisionPoint Trend Model. They define the implied bias of the price index based upon moving average relationships, but they do not necessarily call for a specific action. They are information flags that should prompt chart review. Further, they do not call for continuous buying or selling during the life of the signal. For example, a BUY signal will probably (but not necessarily) return the best results if action is taken soon after the signal is generated. Additional opportunities for buying may be found as price zigzags higher, but the trader must look for optimum entry points. Conversely, exit points to preserve gains (or minimize losses) may be evident before the model mechanically closes the signal.
Helpful DecisionPoint Links:
DecisionPoint Shared ChartList and DecisionPoint Chart Gallery
Price Momentum Oscillator (PMO)
Swenlin Trading Oscillators (STO-B and STO-V)


