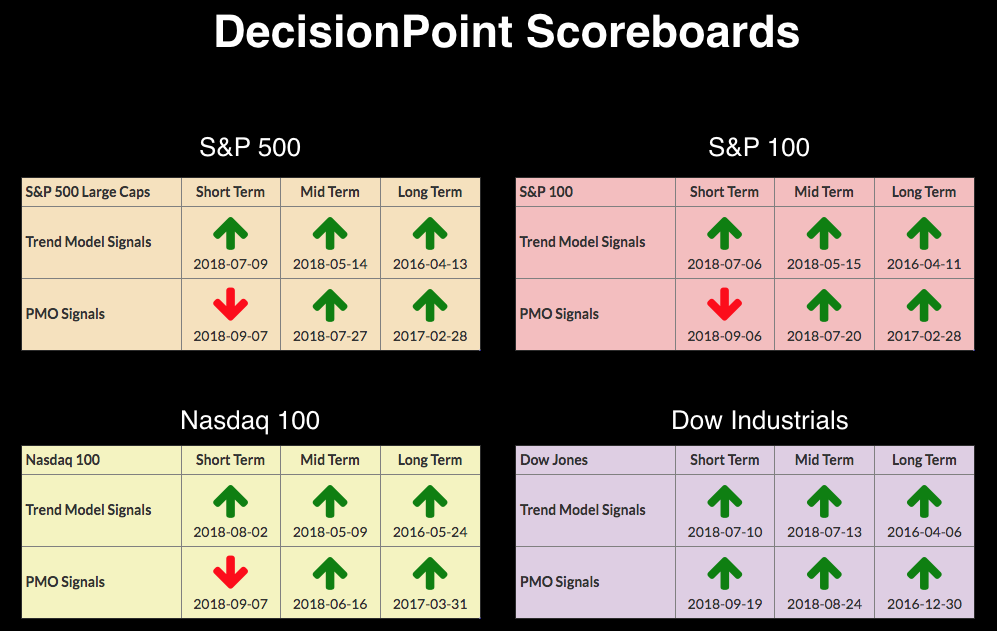
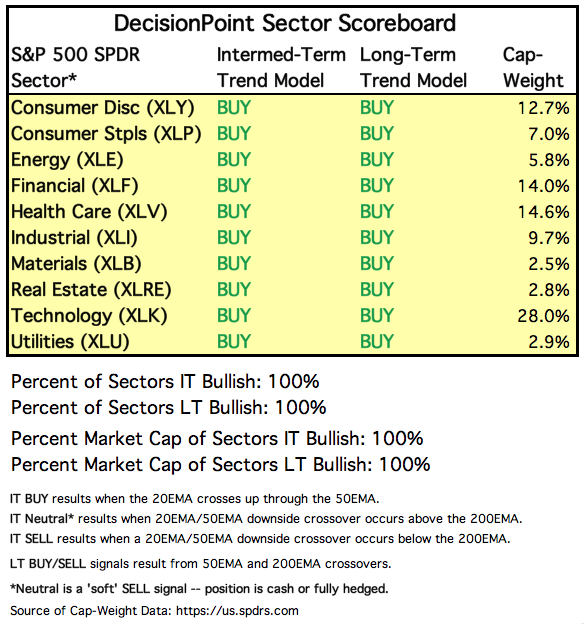
 Advances minus declines readings over the past few days are suggesting a short-term selling exhaustion. And, what's up with Gold? It's been poised to breakout for some time and we're still waiting. There were no changes to the Scoreboards this past week, but, there were two whipsaw signals that I opted not to put on the DecisionPoint Scoreboards. Both the OEX and SPX had PMO BUY signals for one day that switched back to SELL signals. The Dow is still clinging to its PMO BUY signal, but its PMO is declining. The DecisionPoint Sector Scoreboard saw a new ITTM BUY on XLE yesterday which put all sectors in the intermediate to long term on BUY signals. I wrote about this is yesterday's article.
The DecisionPoint Alert presents an mid-week assessment of the trend and condition of the stock market (S&P 500), the U.S. Dollar, Gold, Crude Oil, and Bonds.
SECTORS
Each S&P 500 Index component stock is assigned to one, and only one, of 10 major sectors. This is a snapshot of the Intermediate-Term and Long-Term Trend Model signal status for those sectors.
STOCKS
IT Trend Model: BUY as of 5/11/2018
LT Trend Model: BUY as of 4/1/2016
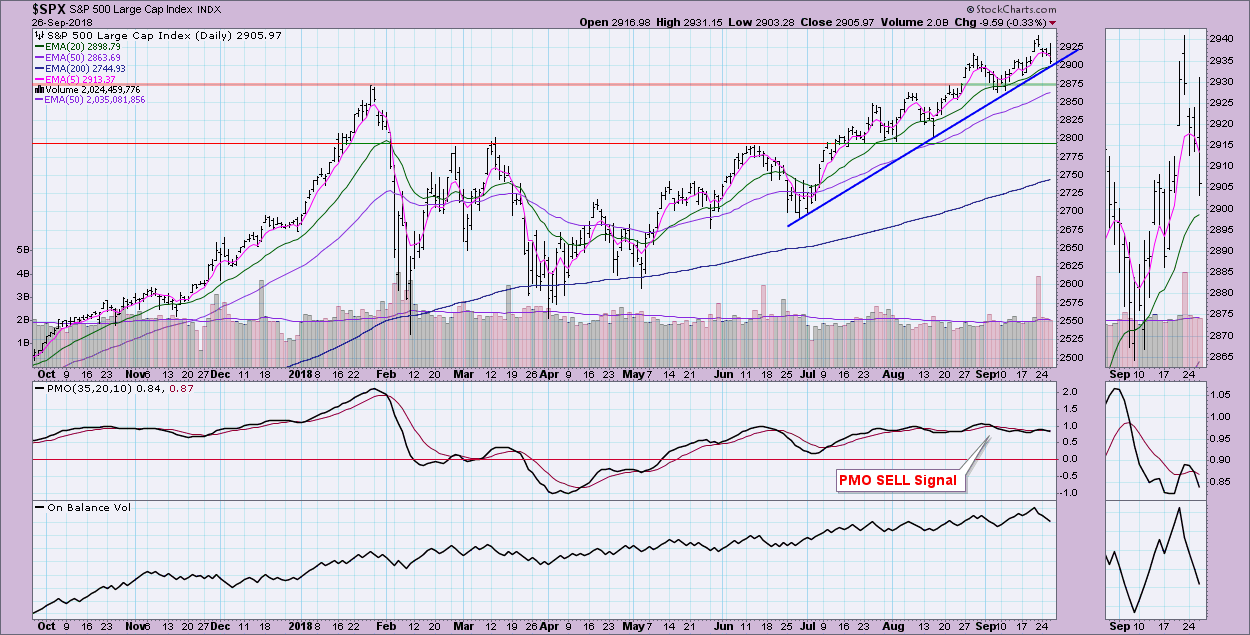
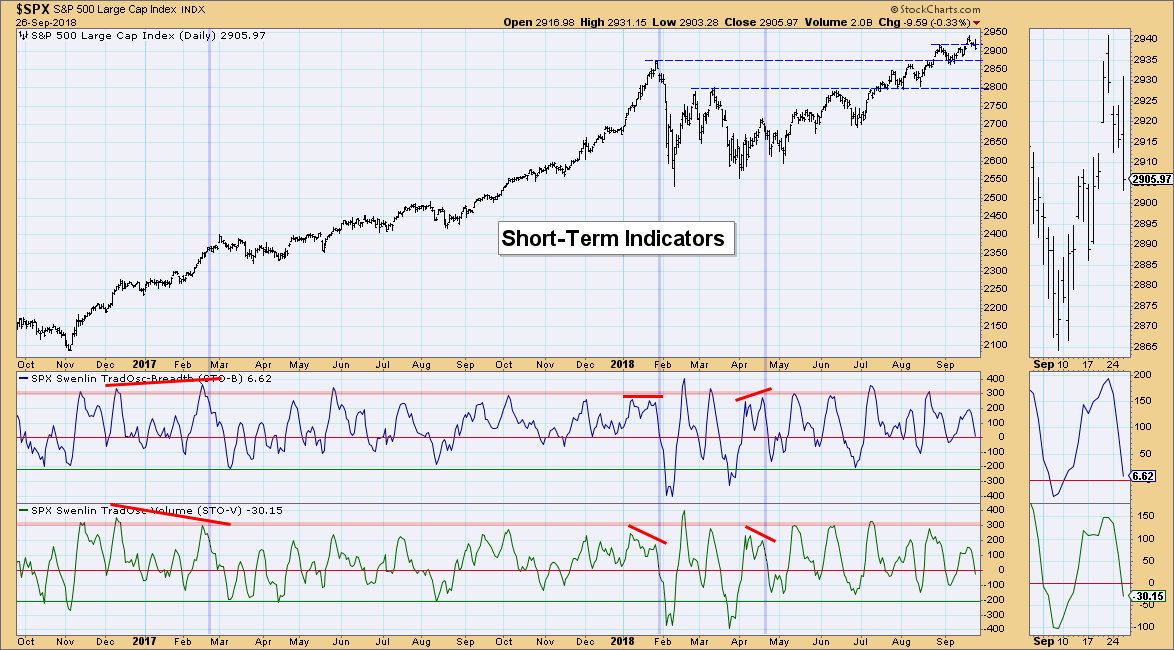
SPX Daily Chart: You can see the PMO whipsaw. As I said earlier, I made a 'command decision' not to switch up the Scoreboards. Right now I'm watching the rising bottoms trendline closely. Today price successfully tested it as it flew lower just before the close on news from the Fed. The PMO has flattened out since August mainly due to the steady price acceleration of the rising trend.
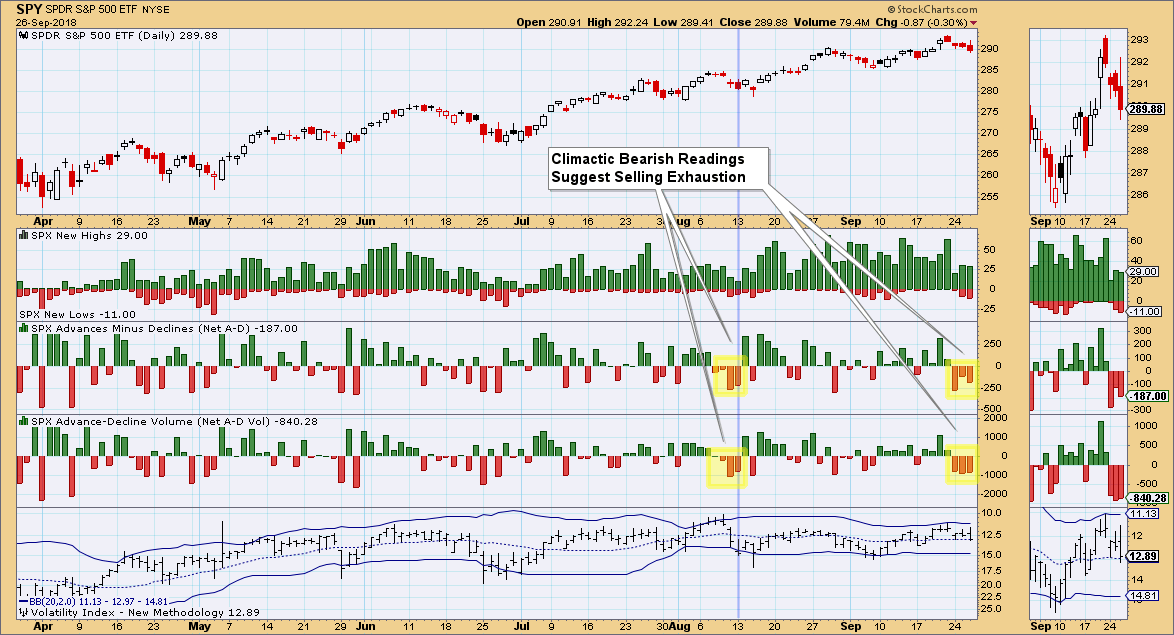
Climactic Market Indicators: Notice we have now had three days in a row of sustained high negative readings on the advance/decline readings. This suggests a selling exhaustion or upside reversal in the very short term. I would've liked the VIX to be at the bottom of the Bollinger Band to confirm it as an exhaustion, but you can't have everything.
Short-Term Market Indicators: These indicators easily cleared overbought-ish conditions with the decline after logging new all-time highs. They are now in neutral and still falling. This could mean more downside coming following any lift price gets off this likely very short-term selling exhaustion.
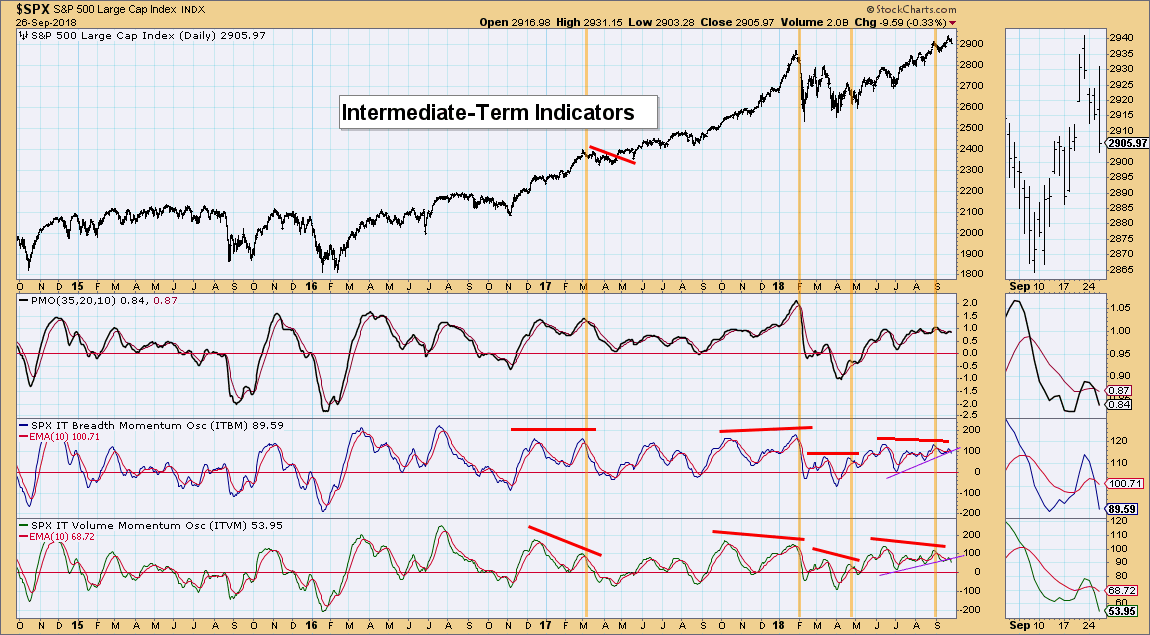
Intermediate-Term Market Indicators: These indicators have me worried. They've managed to avoid a break below the rising trend, but they are really close to giving up. For now, I consider them somewhat bearish given recent hesitation of the past two weeks.
Conclusion: I suspect we will see a rebound off the rising bottoms trendline tomorrow and/or Friday based on the highly negative advance/decline indicator readings. Unfortunately, any upside will likely be negated by the decline that short and intermediate-term indicators are calling for.
DOLLAR (UUP)
IT Trend Model: BUY as of 4/24/2018
LT Trend Model: BUY as of 5/25/2018
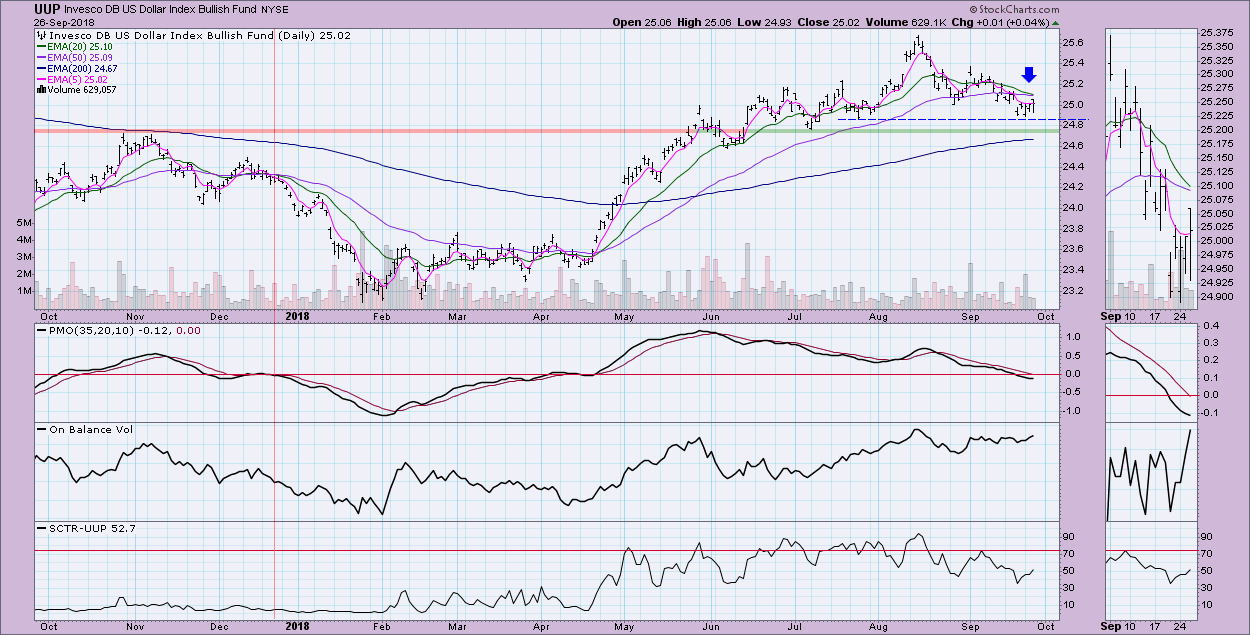
UUP Daily Chart: The Dollar has been in a declining trend since the beginning of September but it has avoided a correction by staying above support at about $24.90. The Intermediate-Term Trend Model will post a Neutral signal if the 20-EMA crosses below the 50-EMA (it would be a SELL if the crossover occurred below the 200-EMA). If you look back in December of 2017, you can see very similar conditions with the PMO just starting to fall into negative territory and a 20/50-EMA negative crossover. I'm still bearish on the Dollar.
GOLD
IT Trend Model: Neutral as of 5/2/2018
LT Trend Model: SELL as of 6/22/2018
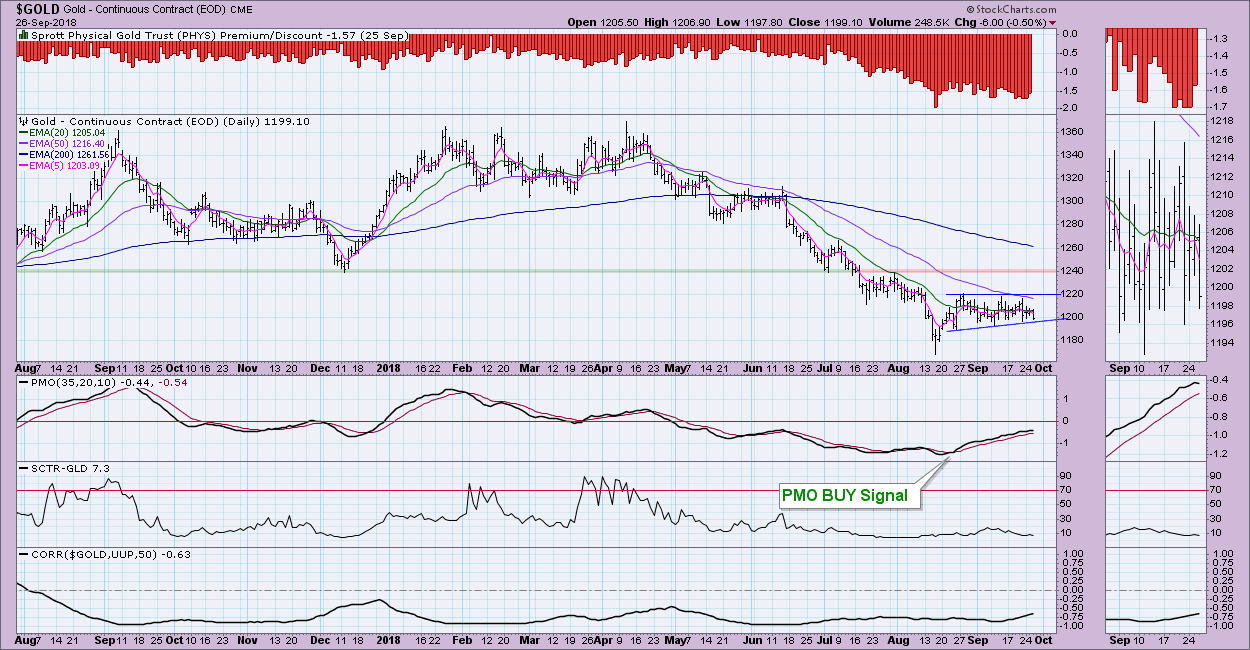
GOLD Daily Chart: Given the declining trend and weakness in the Dollar, I've been expecting Gold to take off, but it stubbornly refuses to. So much so, that it is really starting to decouple from the Dollar. Correlation reading is now -0.63 when it generally resides much closer to -1.0. The problem is that by decoupling, it won't get the tailwinds from a weak Dollar. Discounts continue to be very high, suggesting bearish sentiment. Sentiment being contrarian, I would expect to see a rally. One bit of good news is that I am seeing an ascending triangle which is bullish and implies a breakout above $1220.
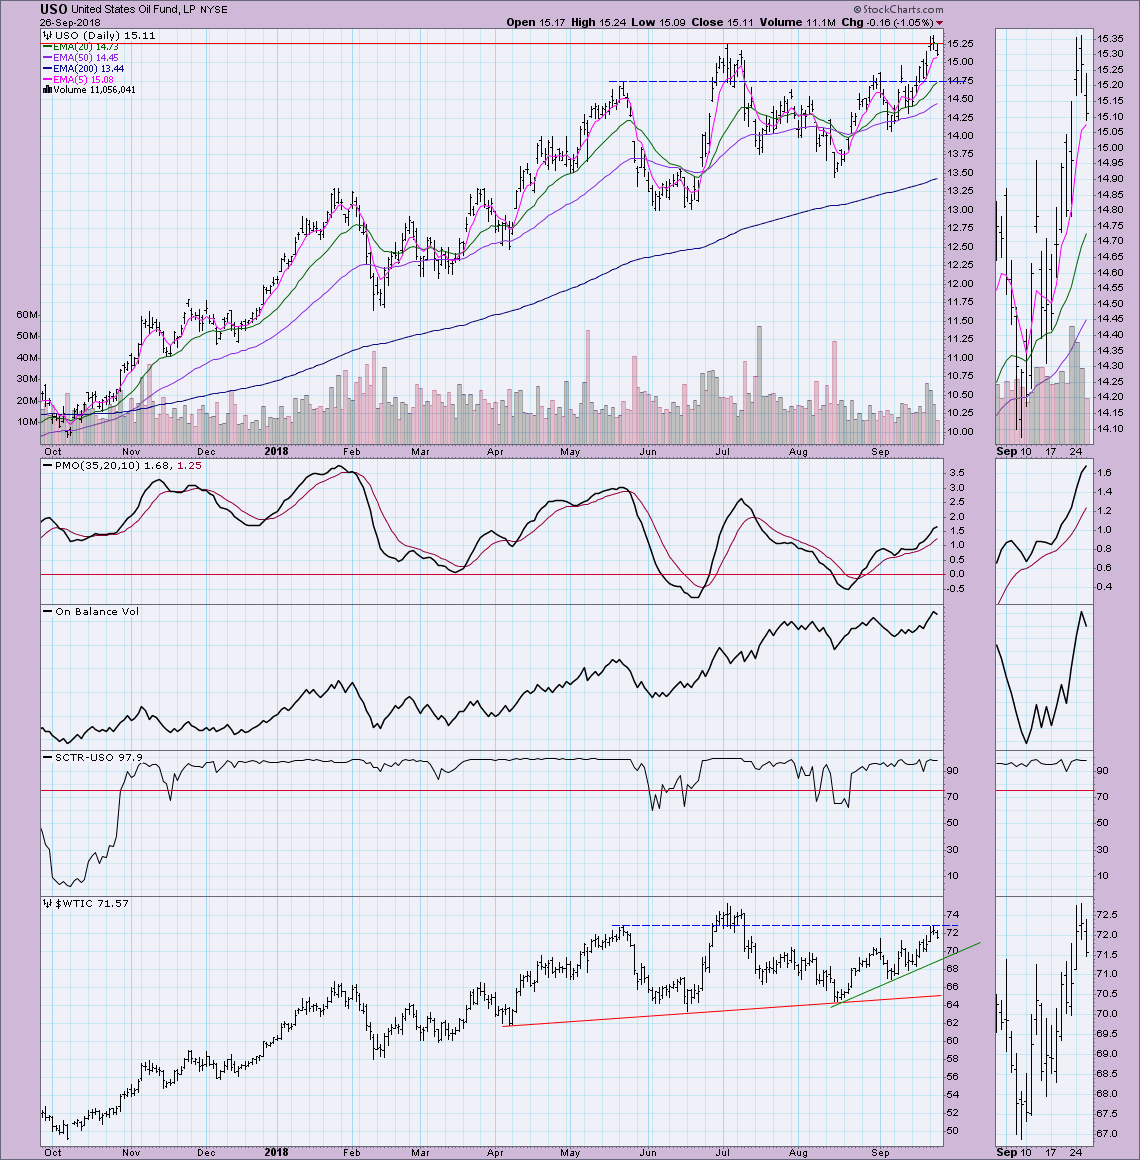
CRUDE OIL (USO)
IT Trend Model: Neutral as of 8/16/2018
LT Trend Model: BUY as of 11/2/2017
USO Daily Chart: $WTIC in the bottom pane of the chart shows that price hit resistance at May's top and was turned away. For USO, resistance was overcome at the July top, but price couldn't sustain that annual price high. The PMO is not overbought and is rising. Both the OBV and SCTR look healthy, so I expect we are seeing a pullback at resistance, but it likely will be followed with a breakout to make another 2018 high.
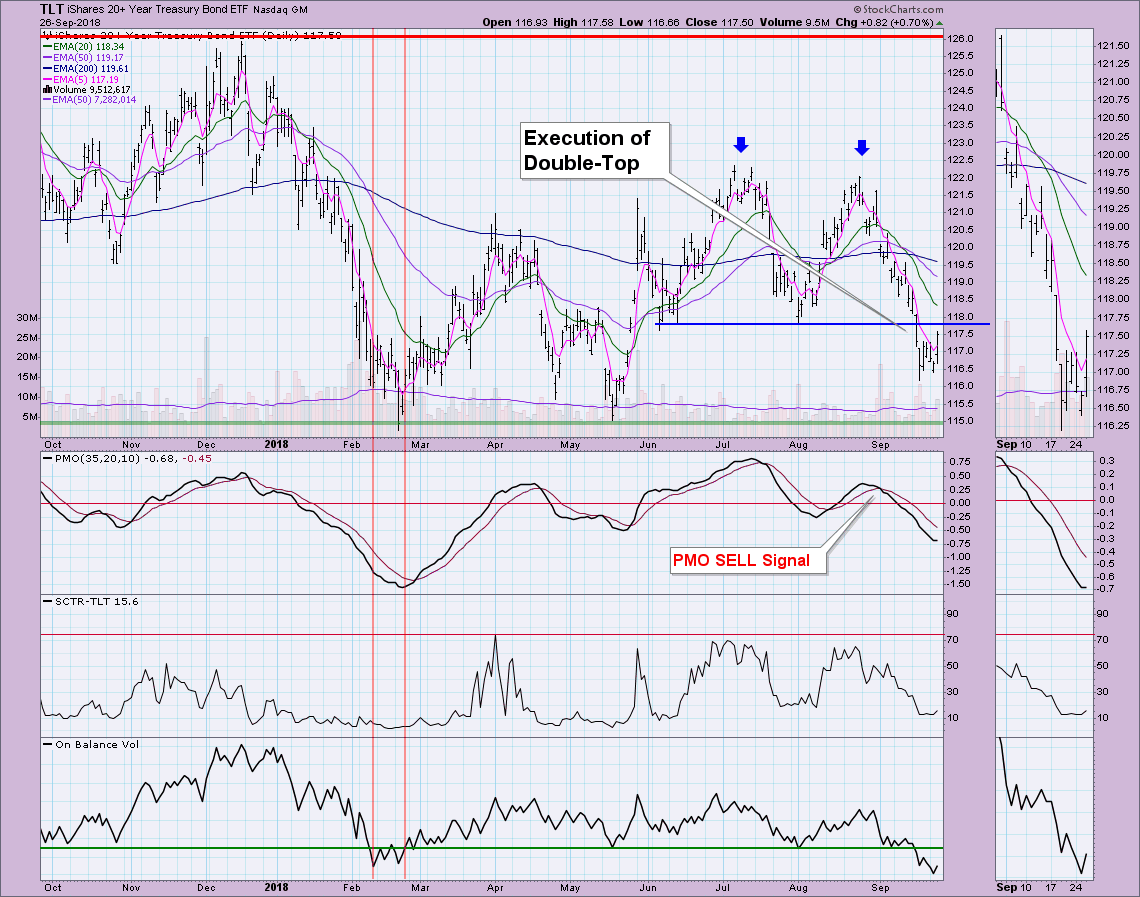
BONDS (TLT)
IT Trend Model: Neutral as of 9/13/2018
LT Trend Model: SELL as of 9/18/2018
TLT Daily Chart: Price is snapping back toward the area of the breakdown at the confirmation line for executing the double-top. The PMO put on the brakes, but I suspect this was just a reactionary bounce. I wanted to point out that when the OBV has reached these low levels, price continued lower until it rebounded back above. I'm looking for a test of the 2018 lows and a drop even lower by the end of the year.
Technical Analysis is a windsock, not a crystal ball.
Happy Charting!
- Erin
**Don't miss any of the DecisionPoint commentaries! Go to the "Notify Me" box toward the end of this blog page to be notified as soon as they are published.**
NOTE: The signal status reported herein is based upon mechanical trading model signals, specifically, the DecisionPoint Trend Model. They define the implied bias of the price index based upon moving average relationships, but they do not necessarily call for a specific action. They are information flags that should prompt chart review. Further, they do not call for continuous buying or selling during the life of the signal. For example, a BUY signal will probably (but not necessarily) return the best results if action is taken soon after the signal is generated. Additional opportunities for buying may be found as price zigzags higher, but the trader must look for optimum entry points. Conversely, exit points to preserve gains (or minimize losses) may be evident before the model mechanically closes the signal.
Helpful DecisionPoint Links:
DecisionPoint Shared ChartList and DecisionPoint Chart Gallery
Price Momentum Oscillator (PMO)
Swenlin Trading Oscillators (STO-B and STO-V)


