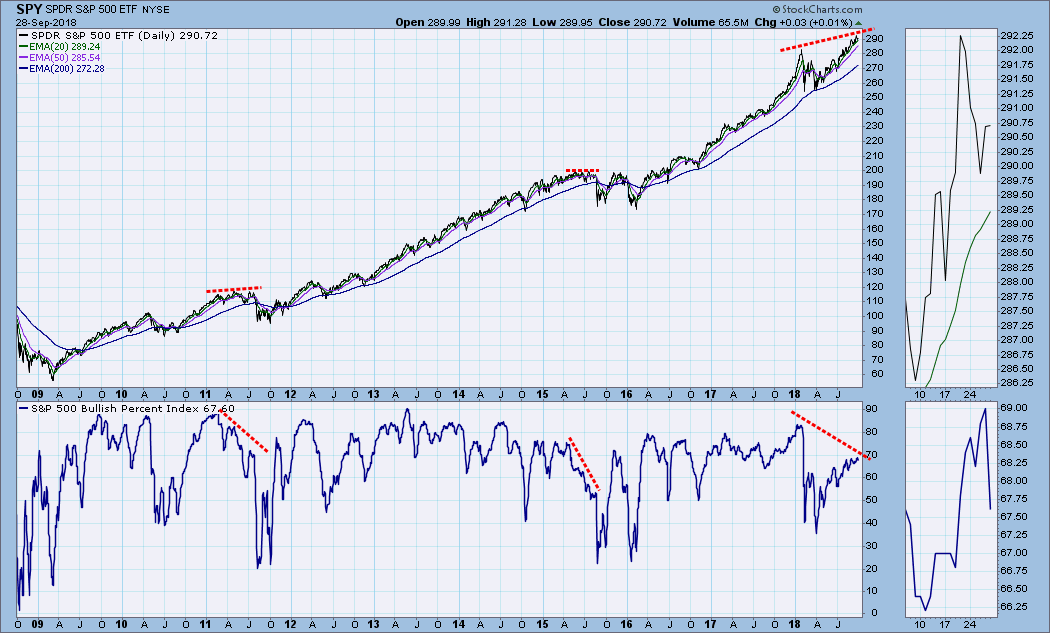
This chart was added almost as an afterthought in last Friday's DP Weekly Wrap, but throughout the week I kept thinking that it should elevated to the lead chart this week. The Bullish Percent Index (BPI) shows the percentage of S&P 500 stocks with point and figure (PnF) BUY signals. I have annotated three significant negative divergences. The first two show the BPI dropping while prices rise or remain flat. This undermining eventually results in sharp price pullbacks. The current divergence is different but still significant. Here prices are pushing to record highs, but the BPI, struggling to reach 68, falls far short of the BPI of 83 back in January, hence, my description Failure to Thrive.
What the BPI is telling us is that fewer stocks are helping to push the index higher, and that the larger-cap stocks are probably doing more of the work. As I said last week, this may not be of immediate concern -- the BPI was at about 60 at the 2000 market highs -- but there is enough of a divergence to discourage complacency in the face of a seemingly bulletproof market.
The DecisionPoint Weekly Wrap presents an end-of-week assessment of the trend and condition of the stock market (S&P 500), the U.S. Dollar, Gold, Crude Oil, and Bonds.
SECTORS
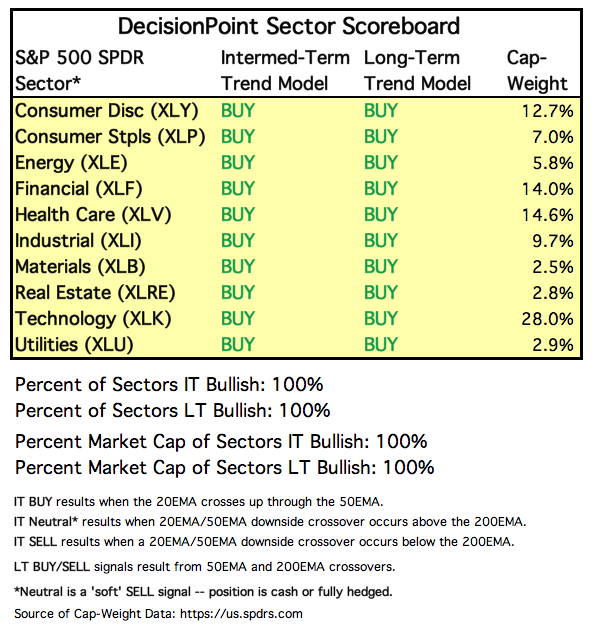
Each S&P 500 Index component stock is assigned to one, and only one, of 10 major sectors. This is a snapshot of the Intermediate-Term and Long-Term Trend Model signal status for those sectors.
STOCKS
IT Trend Model: BUY as of 5/11/2018
LT Trend Model: BUY as of 4/1/2016
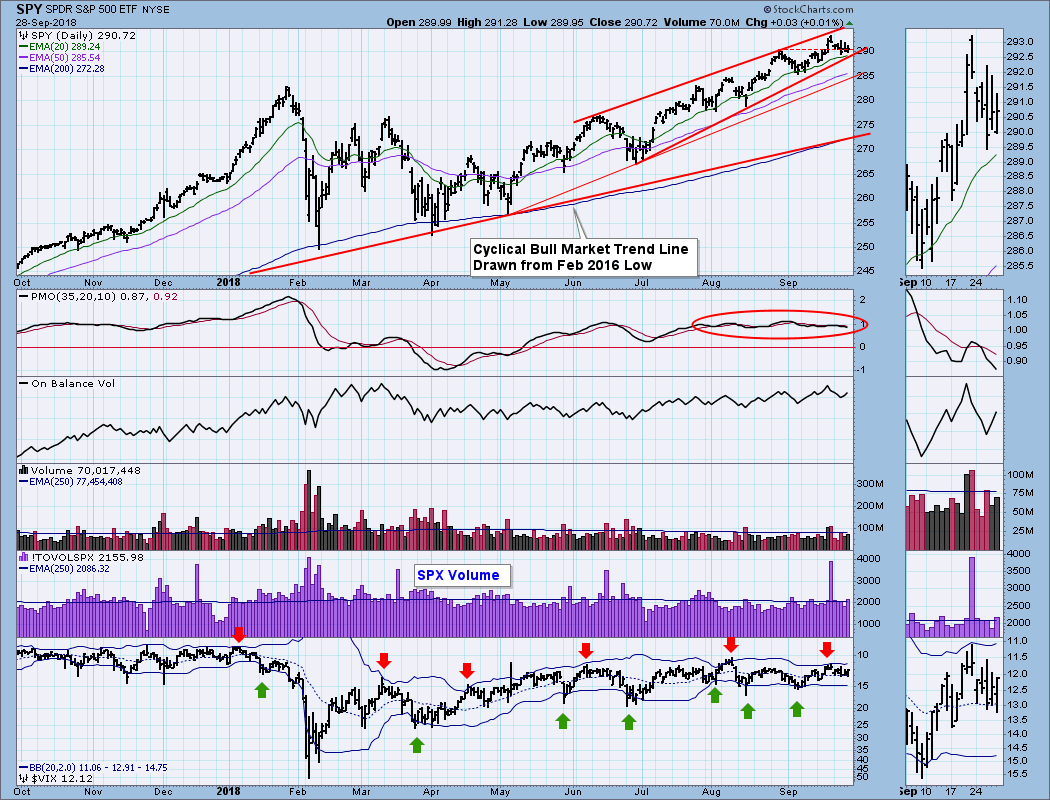
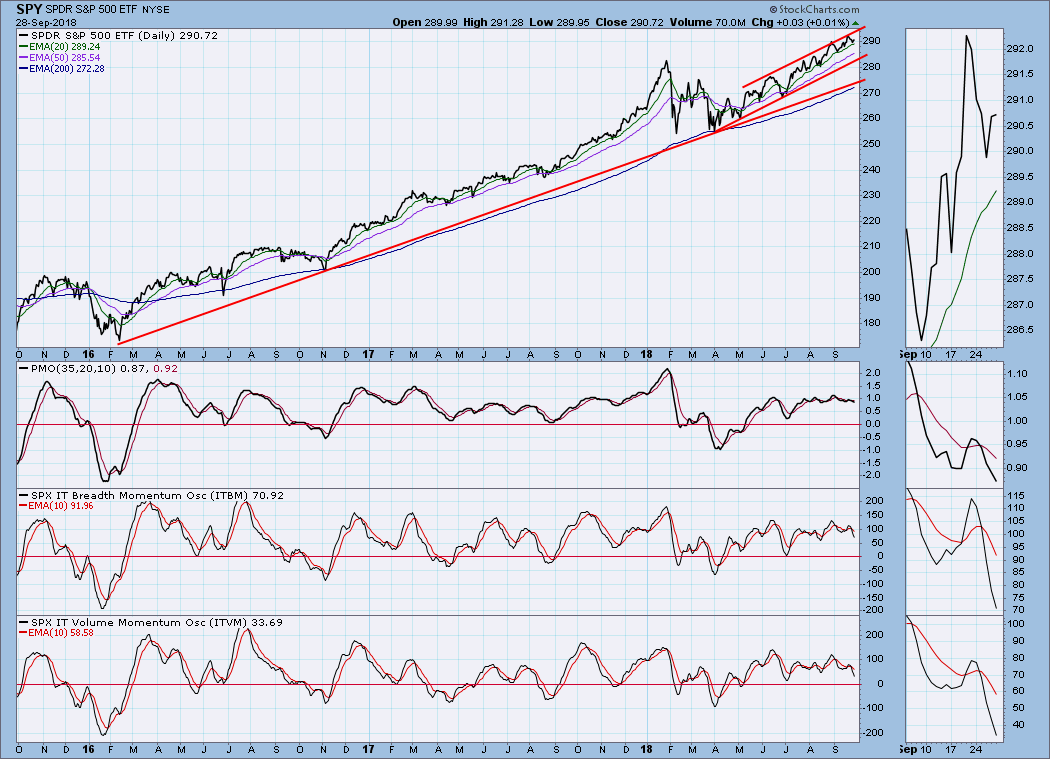
SPY Daily Chart: Last week I observed that price had reached the top of a rising wedge formation, and that the VIX had reached the top Bollinger Band. My conclusion was that there would probably be a short pullback, but that it was unlikely to amount to much. So far that projection has been correct. Now price has nearly reached the bottom of the wedge, and the VIX has reached its 20SMA, which often proves to be support. At this point, I find myself more or less neutral regarding what will happen next in the short term.
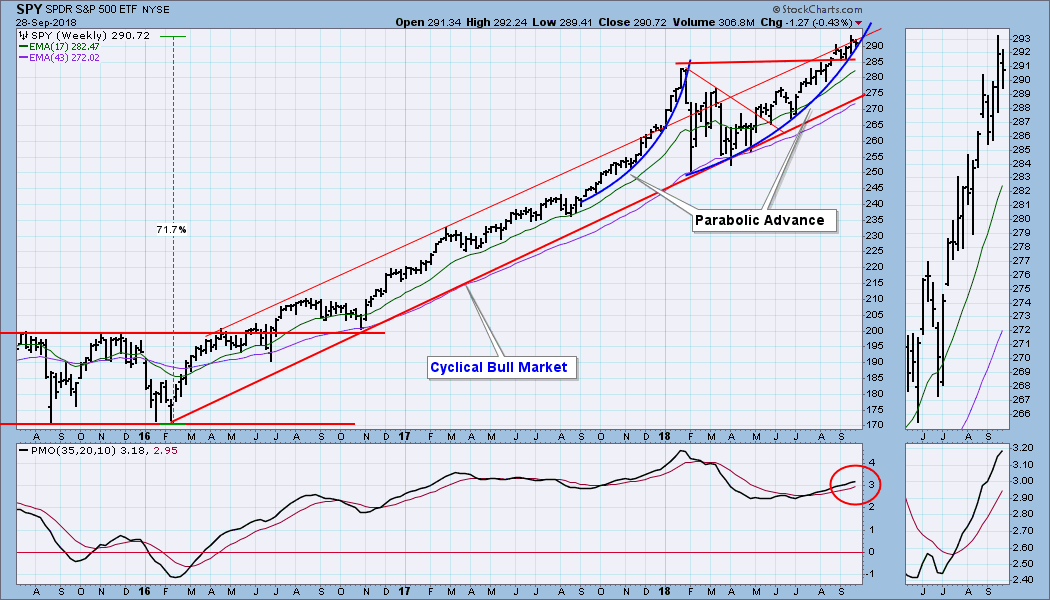
SPY Weekly Chart: Price is pressing the top of the rising trend channel, and it will take less than a -10% decline for price to reach the bottom of the channel; however, the nascent parabolic arc is still forcing price higher.
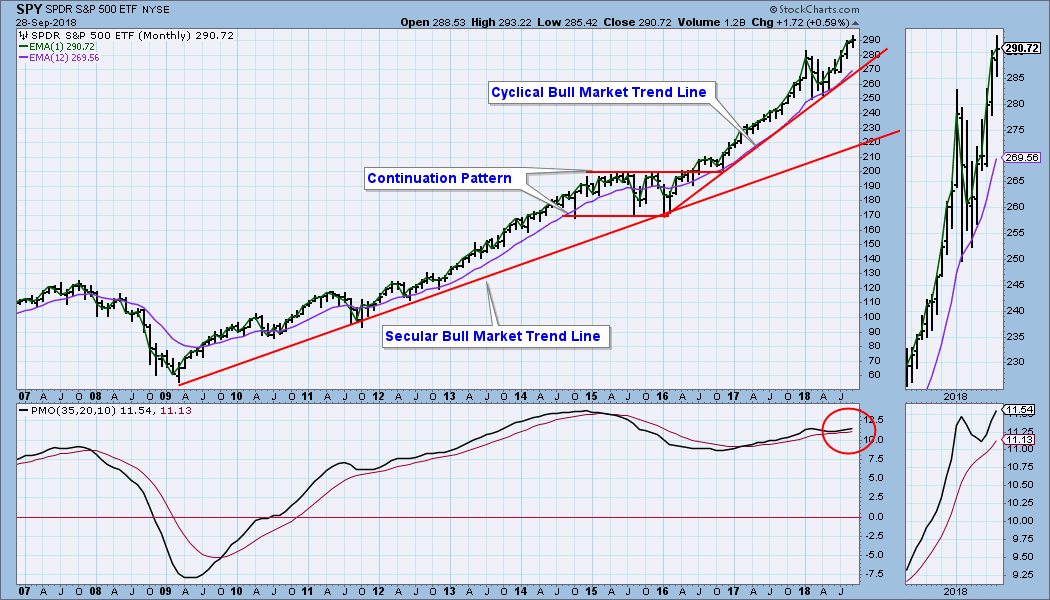
SPY Monthly Chart: This chart is super bullish. Price is well above the secular and cyclical bull market rising trend lines, and the monthly PMO is rising and reflects strong positive momentum. Something of which to make note, price is about 25% above the secular rising trend line. Such a large departure demands a correction eventually, but the positive aspect is that a cyclical bear market of a healthy -20% would still leave price above the secular trend line.
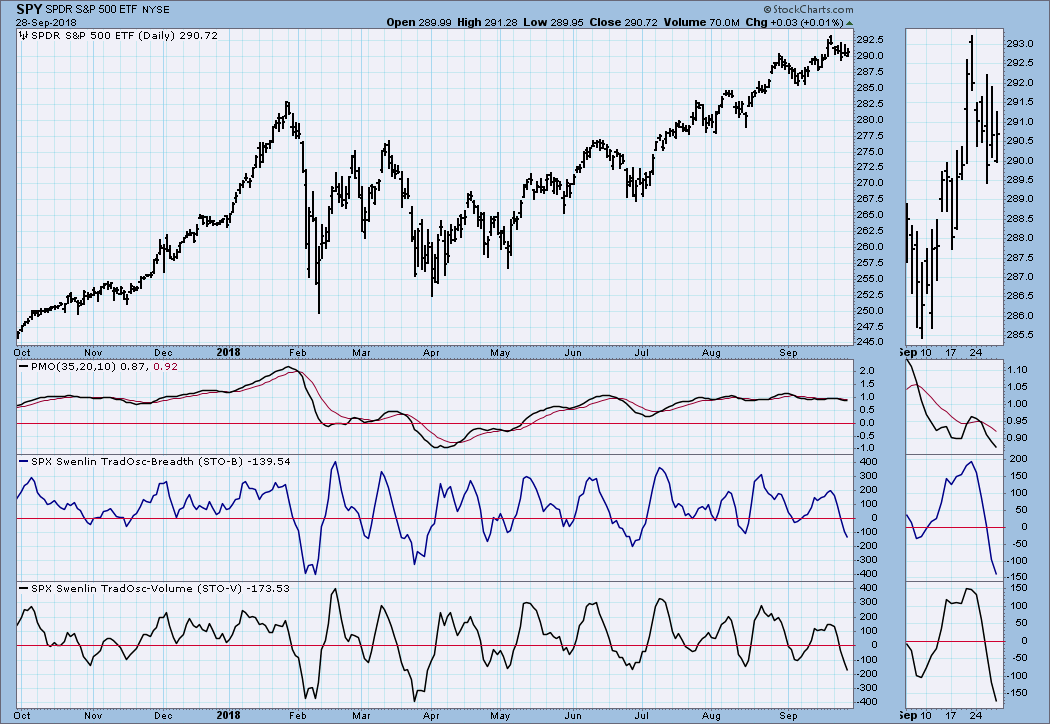
Short-Term Market Indicators: Based upon their range for the last six months, the STO-B and STO-V are both oversold. This fact favors a short-term rally.
Intermediate-Term Market Indicators: These indicators range from slightly overbought to neutral. They are all headed lower toward the zero line, but I'm not getting any red flares from what I see.
CONCLUSION: The parabolic advance on the SPY chart that I have been tracking looks to be on the verge of resolution -- arcing higher or breaking down. Maybe next week we'll get the answer. The BPI issue discussed above jumped out at me last week, and, after a week of contemplation, it still seems important. It may not be a signal to take any specific action, but it could confirm other bearish indications. For example, if the market begins to show weakness and you're looking for a technical reason why it is, this is it.
DOLLAR (UUP)
IT Trend Model: BUY as of 4/24/2018
LT Trend Model: BUY as of 5/25/2018
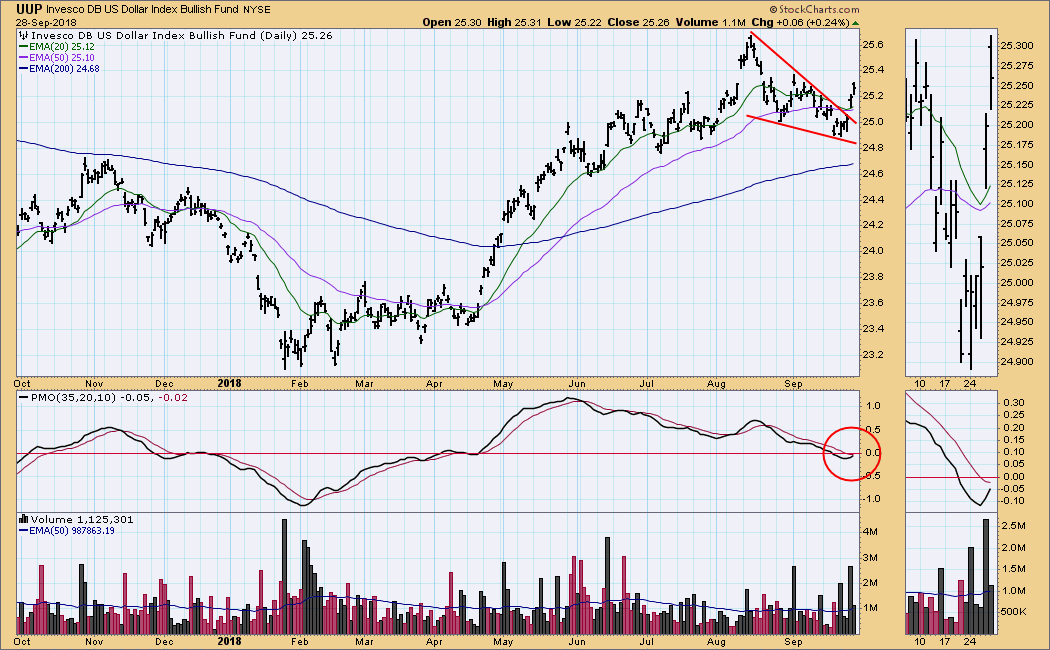
UUP Daily Chart: A tight falling wedge formation resolved to the upside on Thursday, just as we would expect it to do. The daily PMO has bottomed, so the picture is looking bullish.
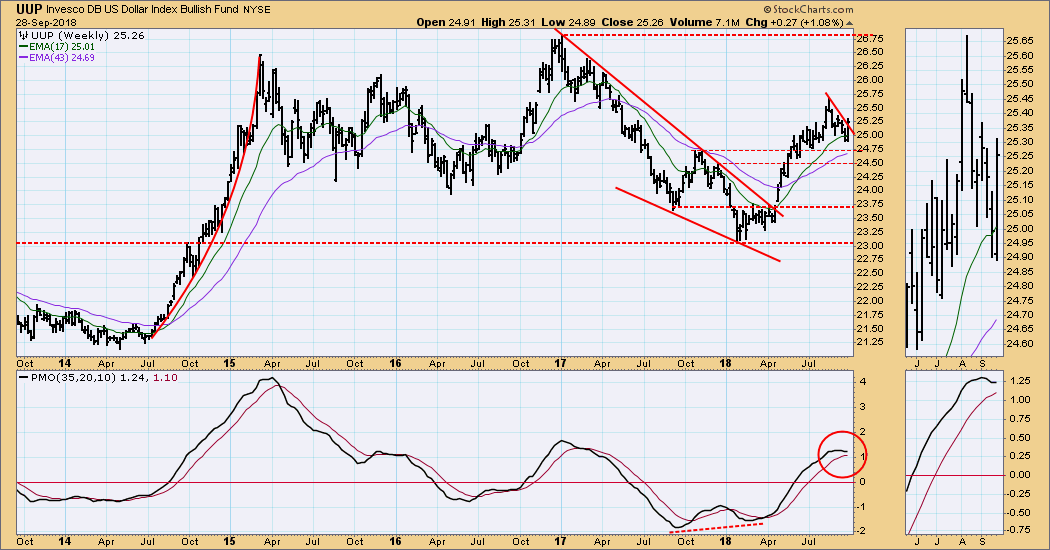
UUP Weekly Chart: The price breakout is clear in this time frame, and the weekly PMO is trying to turn up. Definitely a bullish picture.
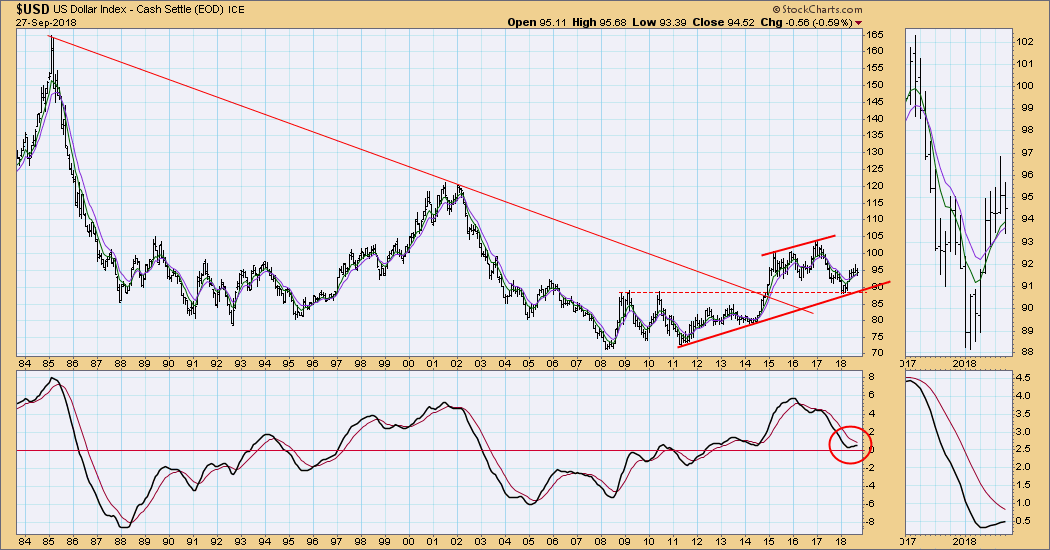
$USD Monthly Chart: There is a long-term rising trend coming off the 2008/2011 double bottom, and the monthly PMO is rising. While there is a somewhat sluggish feel to this chart, it is still bullish.
GOLD
IT Trend Model: NEUTRAL as of 5/2/2018
LT Trend Model: SELL as of 6/22/2018
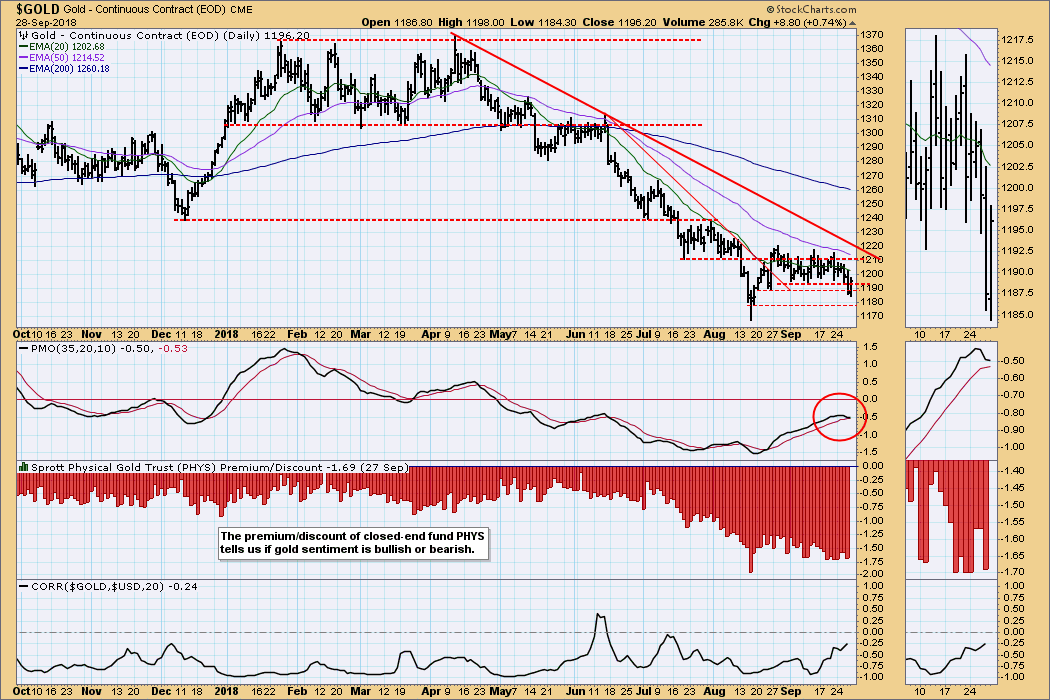
GOLD Daily Chart: After rallying off the August low, gold consolidated for about five weeks. On Thursday gold broke down through the bottom of that trading range, but it bounced back on Friday. The peculiar thing is that the correlation chart shows that gold, which is normally negatively correlated with the dollar, has been decoupling for about three weeks. For example, both gold and the dollar rallied on Friday. The daily PMO has topped, so we may see a retest of the August low.
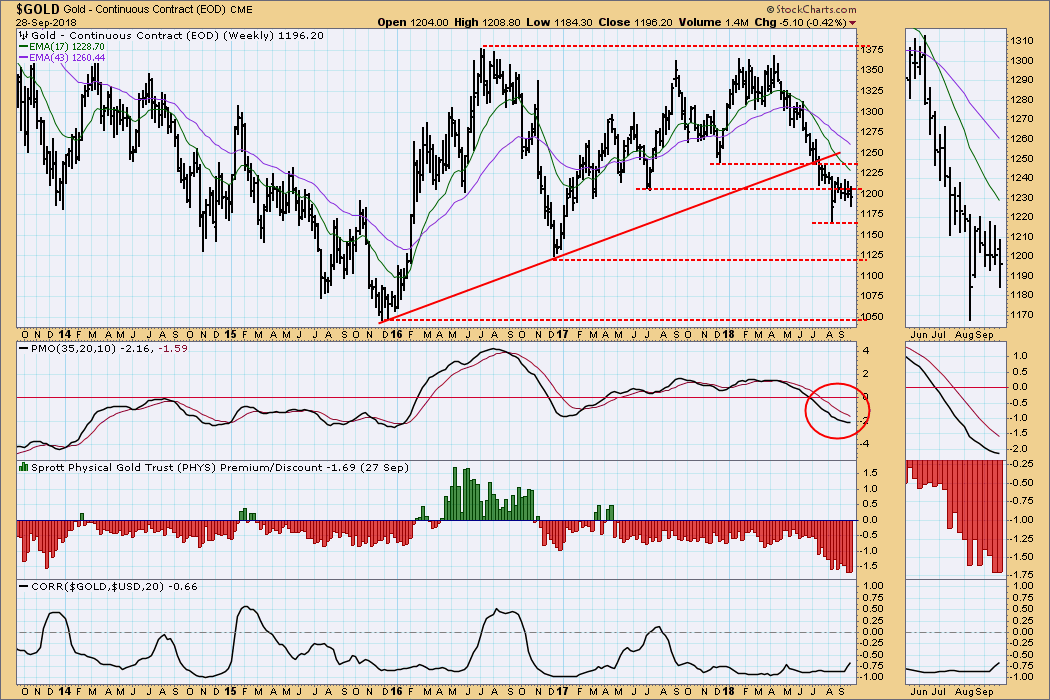
GOLD Weekly Chart: The weekly PMO is falling and sentiment remains negative, so the retest mentioned above seems likely.
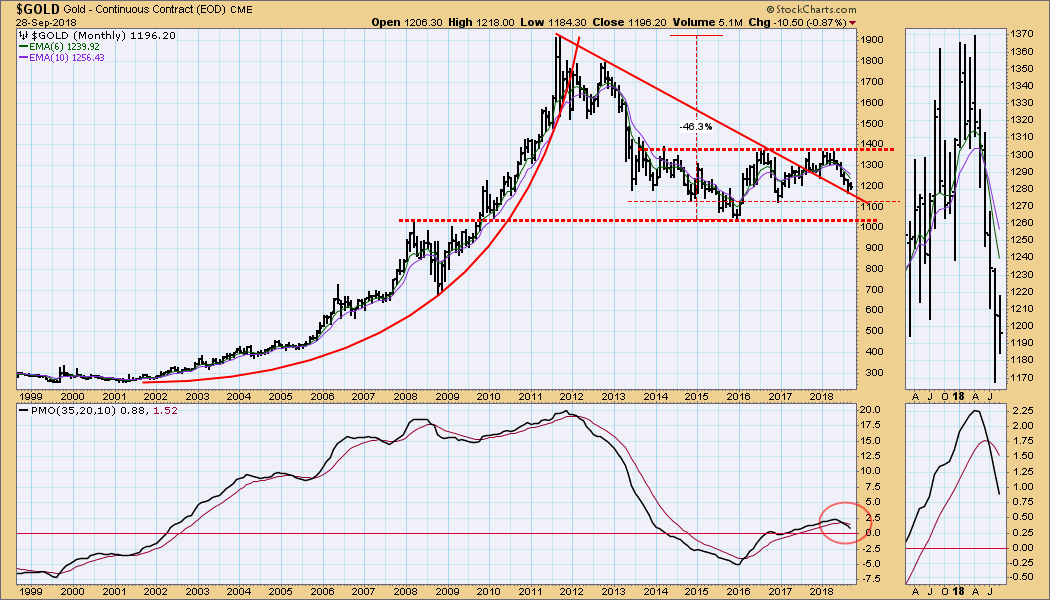
GOLD Monthly Chart: Gold failed to make upward progress after breaking above the declining tops line that defined the last bear market. The monthly PMO is below the signal line and falling, so we may see a retest of the 2015 lows.
CRUDE OIL (USO)
IT Trend Model: BUY as of 8/24/2018
LT Trend Model: BUY as of 11/2/2017
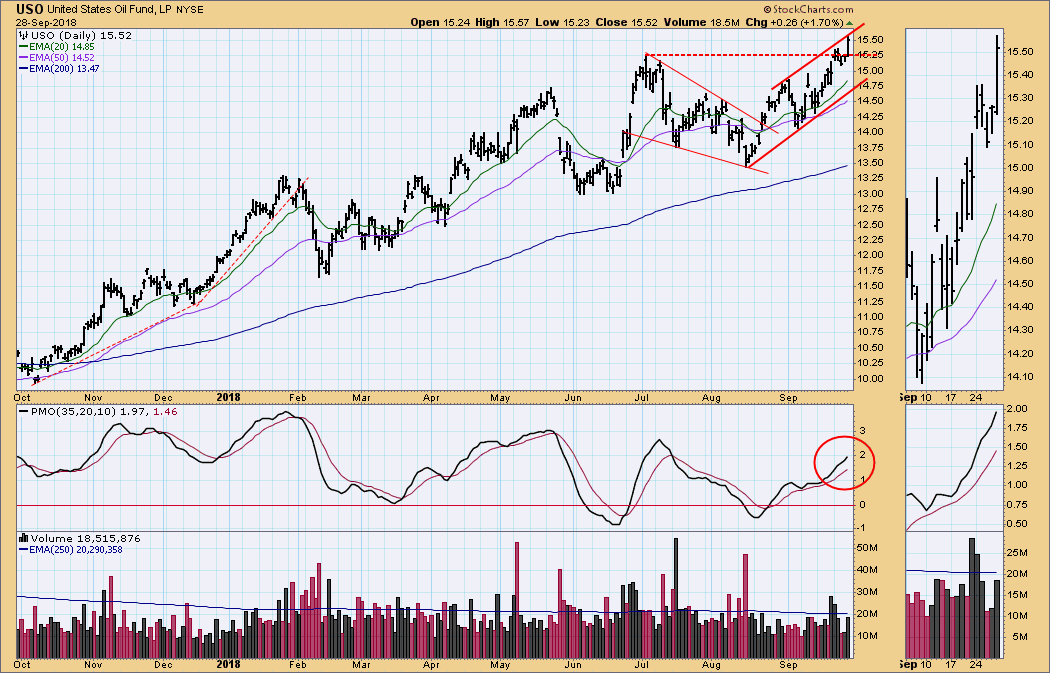
USO Daily Chart: There was a strong breakout on Friday, but USO has reached the top of a rising trend channel, and the weekly chart will show more resistance just ahead.
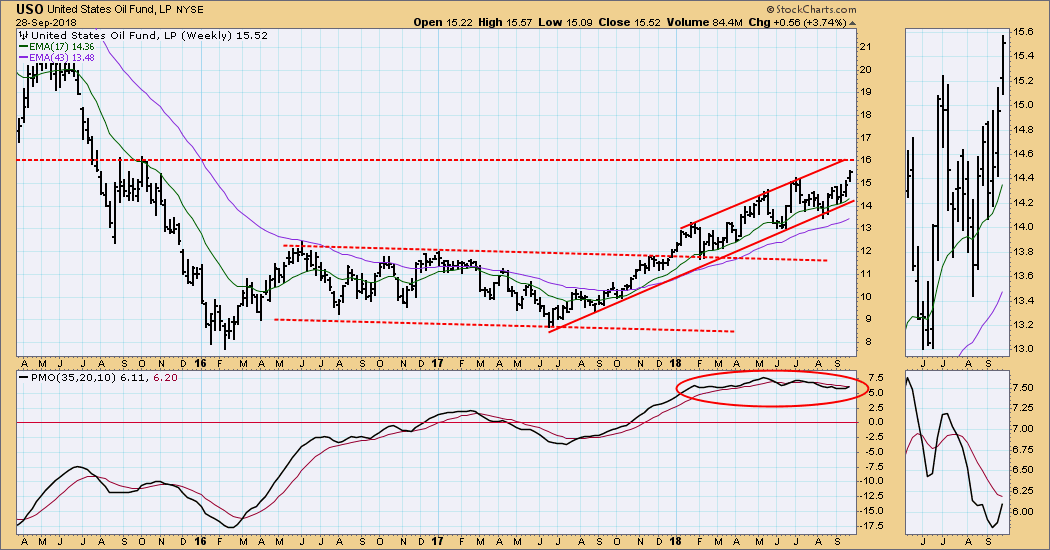
USO Weekly Chart: Price is very close to the best looking resistance on the weekly chart, but the monthly chart shows the resistance zone to be much more vague. Note that the resistance line and the top of the rising trend channel have intersected to combine resistance at about 16.
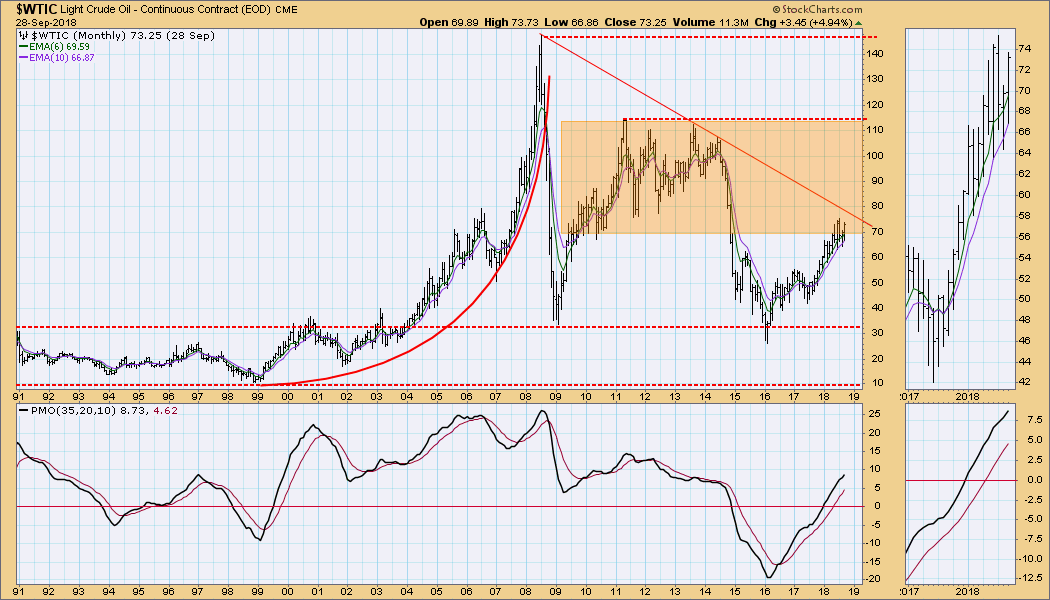
$WTIC Monthly Chart: Crude oil is running into a broad band of resistance, but it is impossible for me to pinpoint exactly where price will be stopped within that band. My gut says that 80-ish is a reasonable target, and I truly do not think that we'll see the 2011 or 2008 tops challenged for years to come.
BONDS (TLT)
IT Trend Model: NEUTRAL as of 9/13/2018
LT Trend Model: SELL as of 9/18/2018
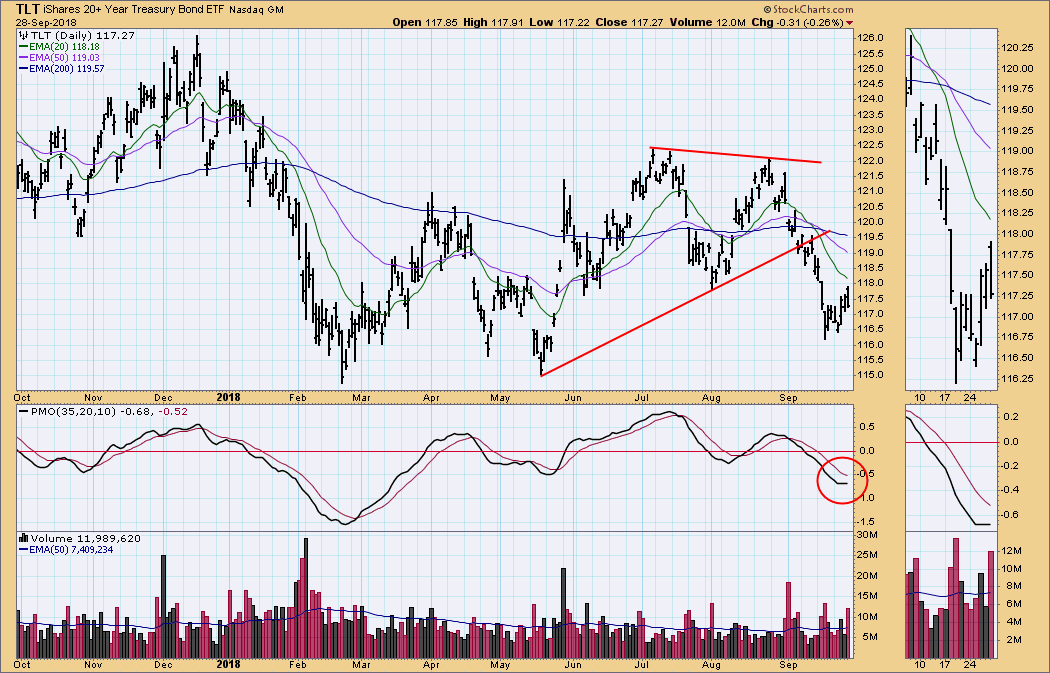
TLT Daily Chart: While the Fed raised interest rates again on Wednesday, TLT perversely rallied into midday Friday. I will be surprised if the decline from the August high does not resume next week.
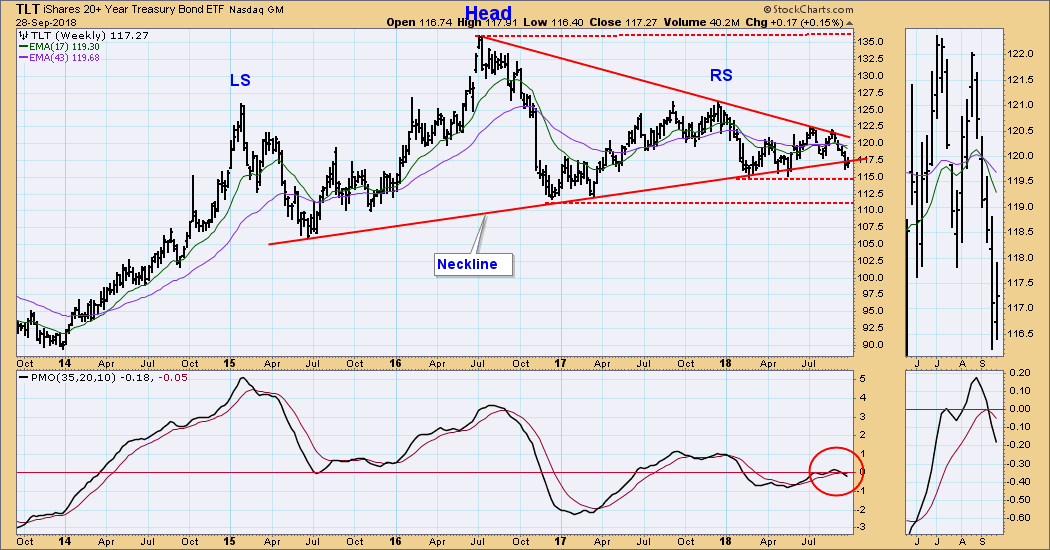
TLT Weekly Chart: The weekly PMO has crossed down through the signal line, which I believe is a precursor to the head and shoulders pattern breaking down.
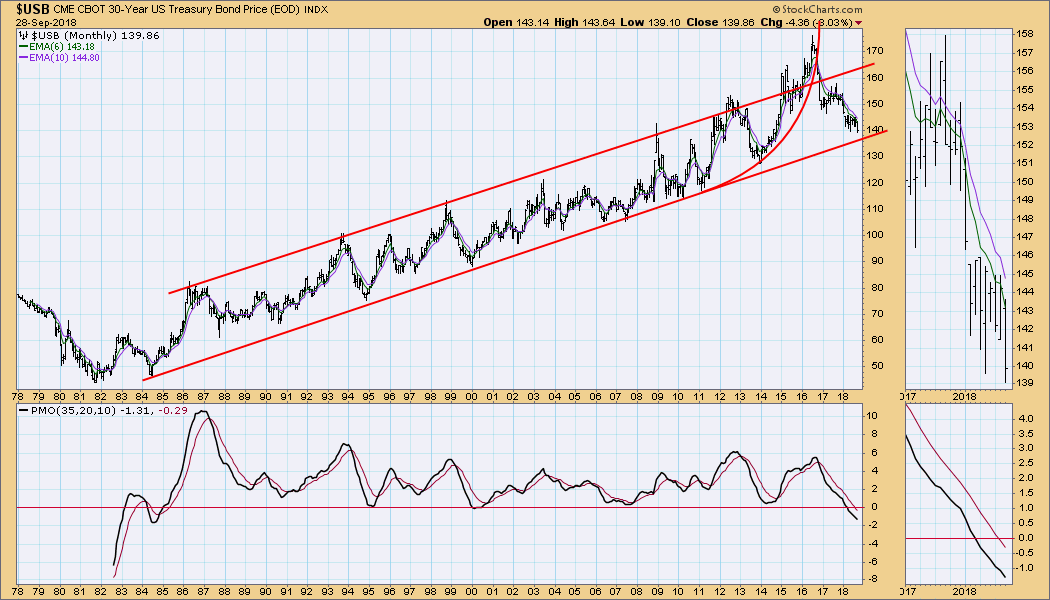
$USB Monthly Chart: The 30-Year T-Bond chart shows a parabolic collapse in 2016, following which price has entered a trend down toward the long-term rising trend line. The monthly PMO is falling and is at its lowest point in 33 years. In my opinion, a bear market in long bonds has begun, and we will see the trend line support fail within a year or less.
**Don't miss any of the DecisionPoint commentaries! Go to the "Notify Me" box toward the end of this blog page to be notified as soon as they are published.**
Technical Analysis is a windsock, not a crystal ball.
Happy Charting!
- Carl
NOTE: The signal status reported herein is based upon mechanical trading model signals, specifically, the DecisionPoint Trend Model. They define the implied bias of the price index based upon moving average relationships, but they do not necessarily call for a specific action. They are information flags that should prompt chart review. Further, they do not call for continuous buying or selling during the life of the signal. For example, a BUY signal will probably (but not necessarily) return the best results if action is taken soon after the signal is generated. Additional opportunities for buying may be found as price zigzags higher, but the trader must look for optimum entry points. Conversely, exit points to preserve gains (or minimize losses) may be evident before the model mechanically closes the signal.
Helpful DecisionPoint Links:
DecisionPoint Shared ChartList and DecisionPoint Chart Gallery
Price Momentum Oscillator (PMO)
Swenlin Trading Oscillators (STO-B and STO-V)

