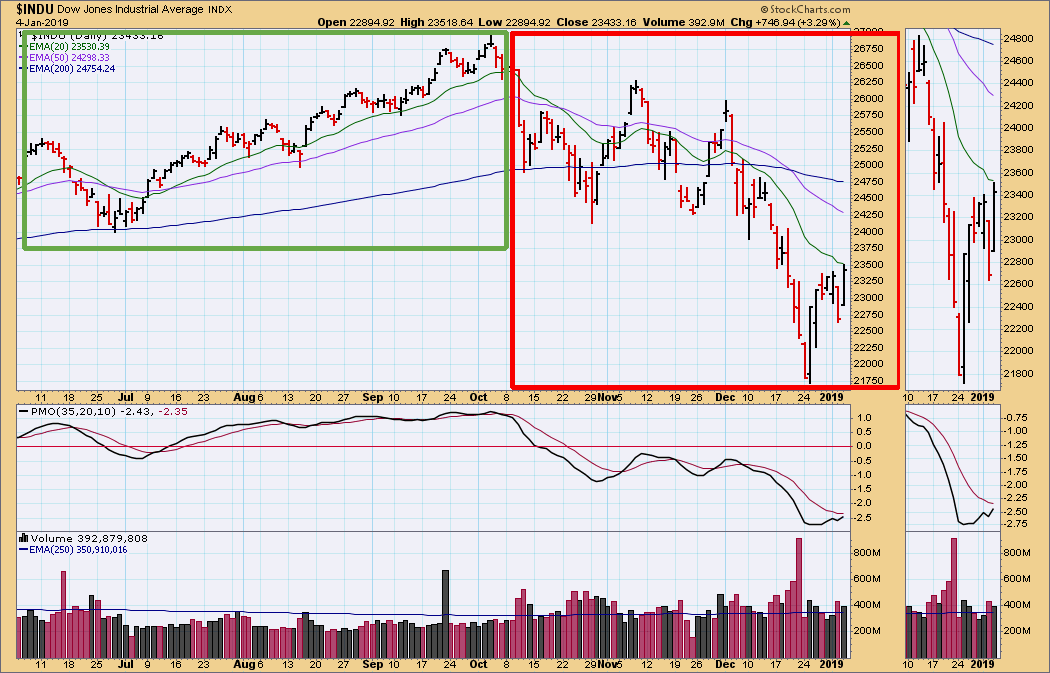
With another short-covering rally, I am reminded that the primary benefit of using price charts is that they provide context. For example, I look at the TV and see that the Dow is up 800+ points, and I think holy cow what is going on? Do I need to completely reformulate my concept of the market? Then I look at the chart and I see that the current price bar resides in a neighborhood of price bars that are so similar that it doesn't even stand out. Peace and serenity restored!
I have bracketed two price groups: the four months leading up to the bull market top in October, and the three months immediately after. It is hard to believe they belong to the same market index. Meet Doctor Jekyll and Mister Hyde.
The DecisionPoint Weekly Wrap presents an end-of-week assessment of the trend and condition of the stock market (S&P 500), the U.S. Dollar, Gold, Crude Oil, and Bonds.
SECTORS
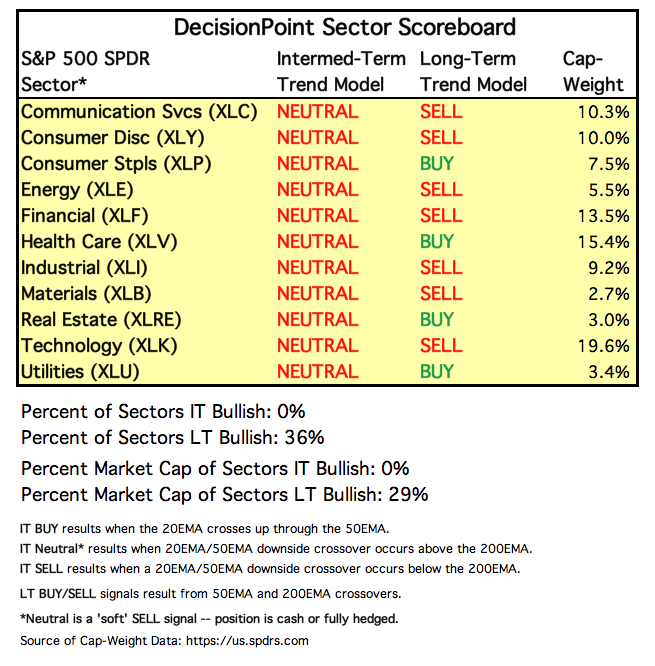
Each S&P 500 Index component stock is assigned to one, and only one, of 11 major sectors. This is a snapshot of the Intermediate-Term and Long-Term Trend Model signal status for those sectors.
STOCKS
IT Trend Model: NEUTRAL as of 10/15/2018
LT Trend Model: SELL as of 12/14/2018
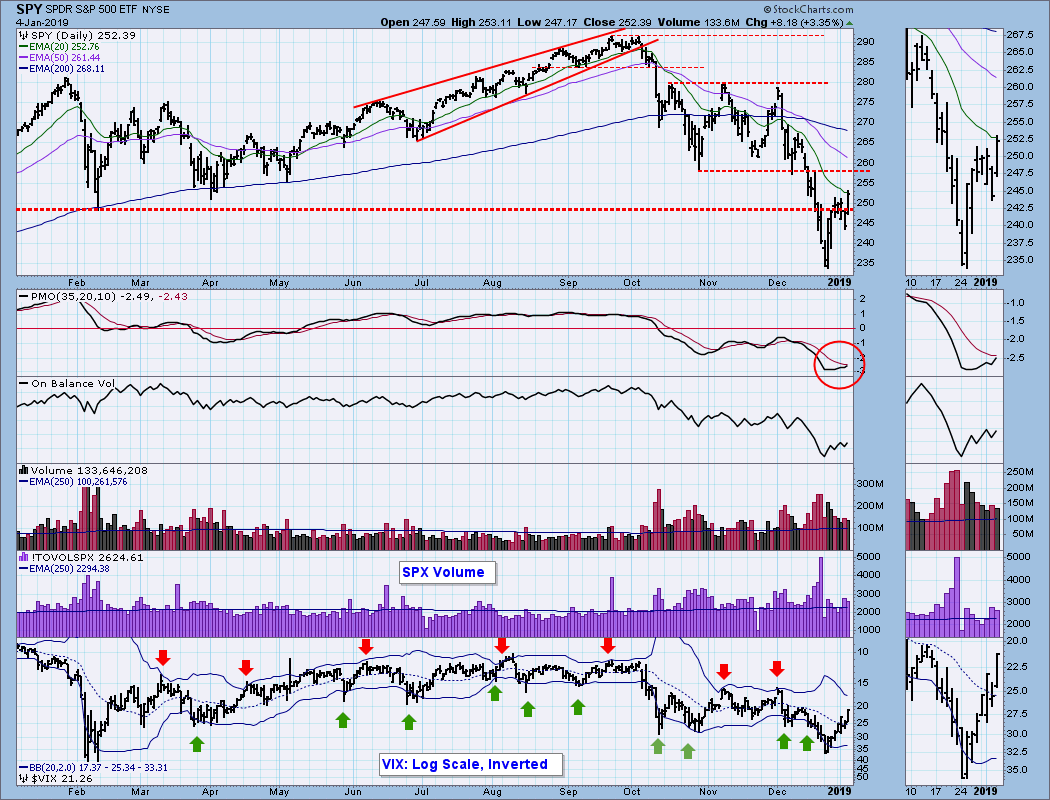
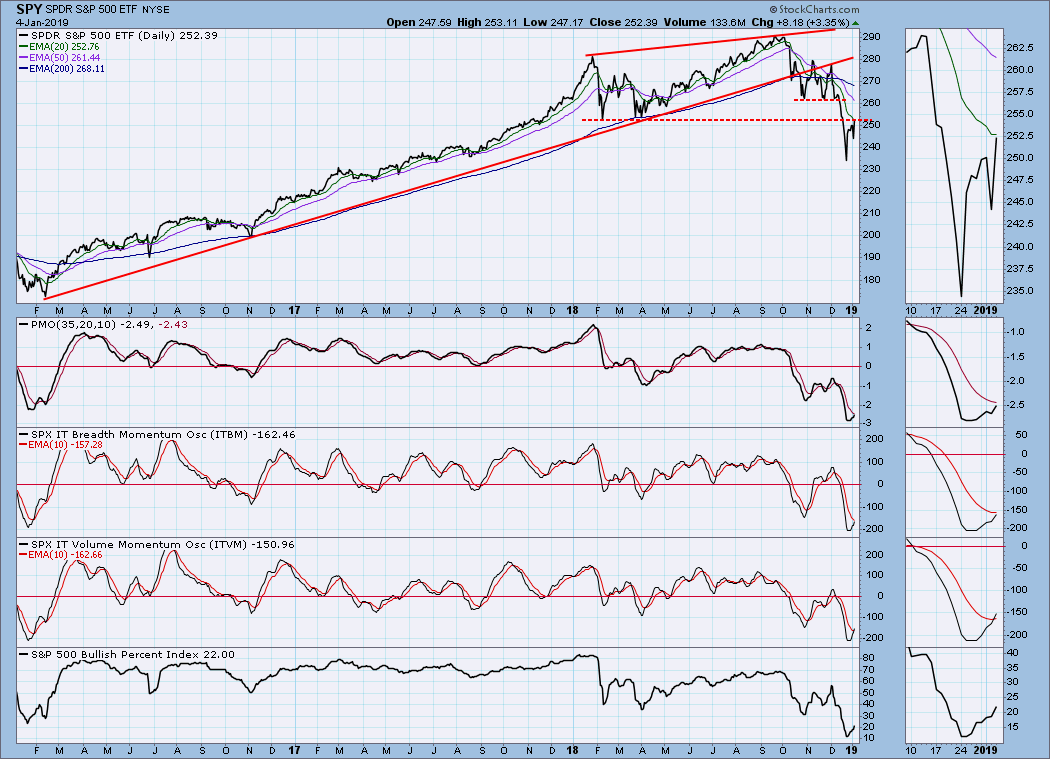
SPY Daily Chart: The daily PMO is close to crossing up through the signal line, but SPY is about 2% below the next resistance level drawn across the October low, and the VIX will be hitting the top Bollinger Band soon. I'm thinking that the rally is near an end.
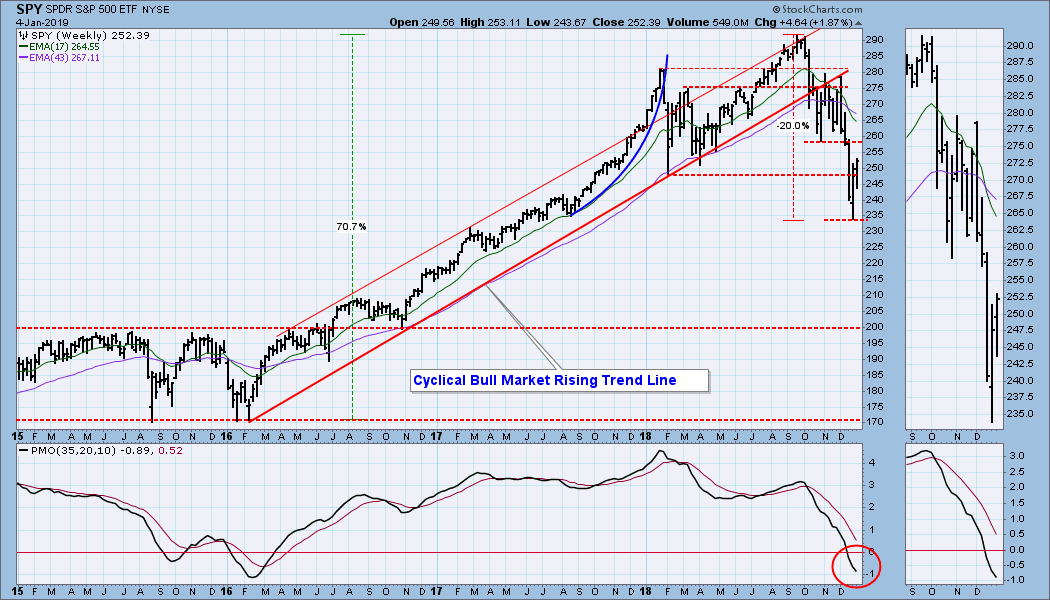
SPY Weekly Chart: The line drawn from the February 2018 low seems to be irrelevant as support or resistance at this point. The weekly PMO is falling, so we're still negative in this time frame.
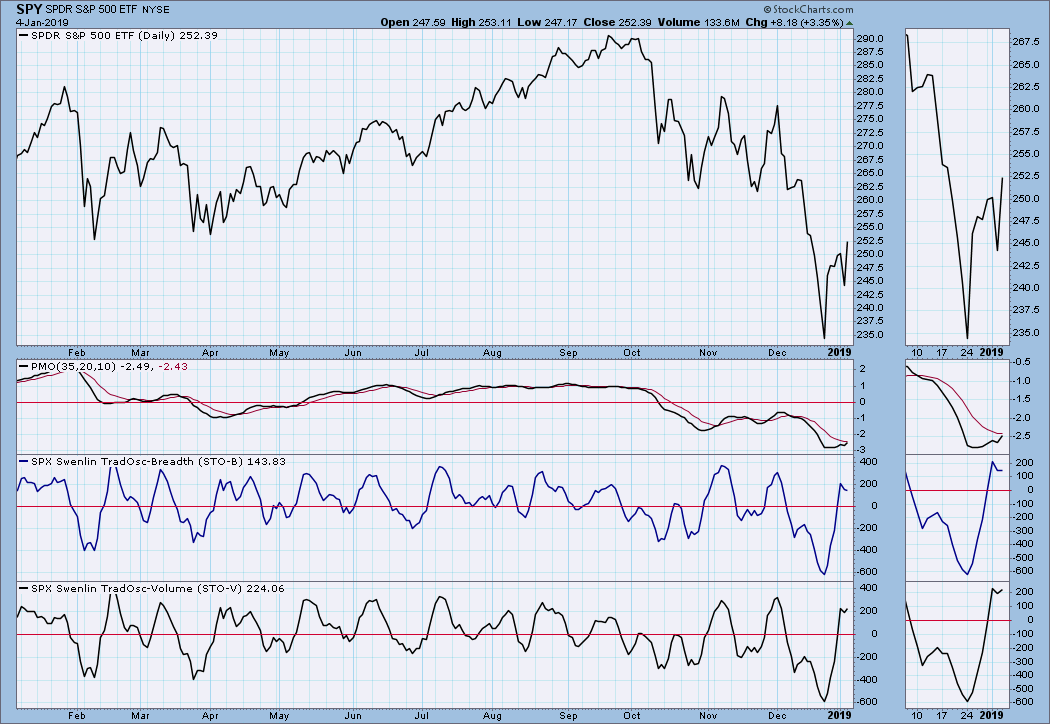
Short-Term Market Indicators: The STO-B and STO-V are overbought, not good in a bear market.
Intermediate-Term Market Indicators: These indicators became very oversold, and they are now moving higher; however, the problem is that we're in a bear market, and I don't think we'll get much upside mileage out of the oversold condition. The BPI has recovered from its recent low point to 22, but only eight percent (8%) of S&P 500 stocks are currently on IT Trend Model BUY signals (20EMA is above the 50EMA).
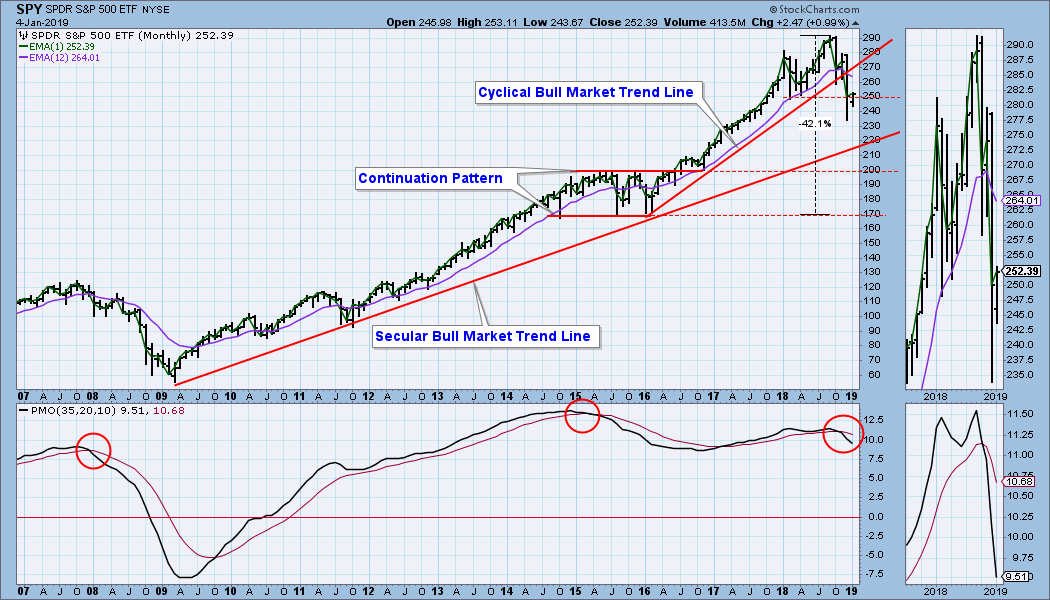
CONCLUSION: One has to wonder if the current rally off the December lows marks an important market bottom, and the wild price swings we have seen tend to present a lot of noise to cut through. I find that my anchor is the monthly PMO, which crossed down through its signal line at the end of November. I was on the DecisionPoint show (StockCharts TV) with Erin today, and she showed the history of the monthly PMO crossover SELL signals. There have only been 21 of those signals in the last 90 years. Not all proved to be deadly, but deadly market moves always have monthly PMO SELL signal at their start. The 12-year chart below has three of them. One announced the 2007-2009 bear market, and the one in 2015 was followed by a consolidation. The current one launched a bear market. I will not be much interested in thinking in a bullish vein until the monthly PMO at least turns up. Until then, I'll be expecting the worst.
DOLLAR (UUP)
IT Trend Model: BUY as of 4/24/2018
LT Trend Model: BUY as of 5/25/2018
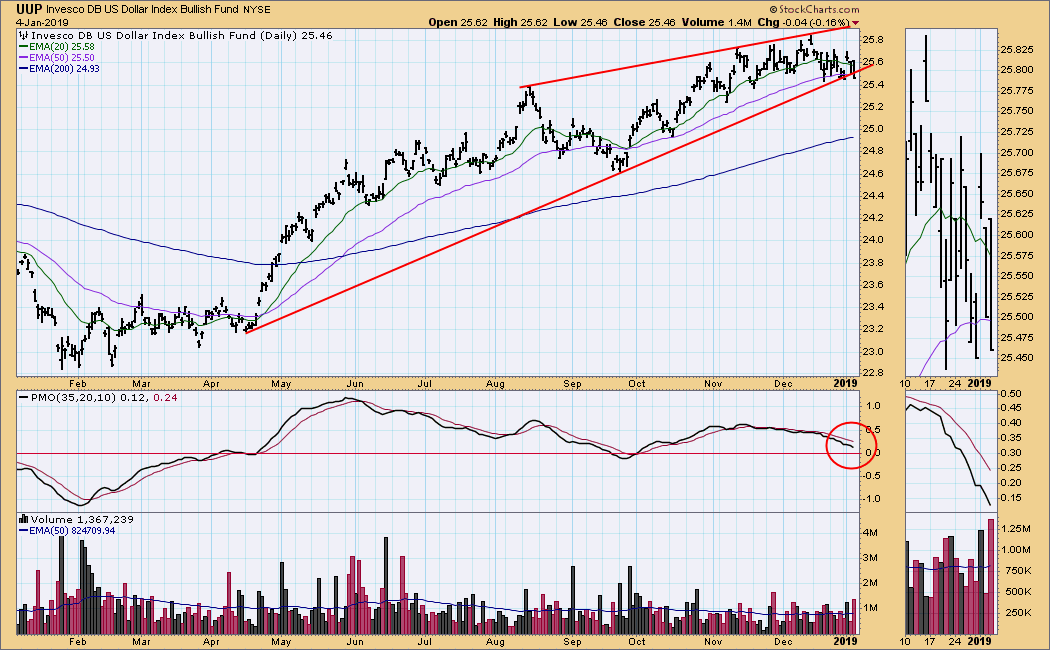
UUP Daily Chart: It appears as though the rising wedge pattern will resolve downward.
UUP Weekly Chart: The weekly PMO has topped, reinforcing my belief that UUP will break down.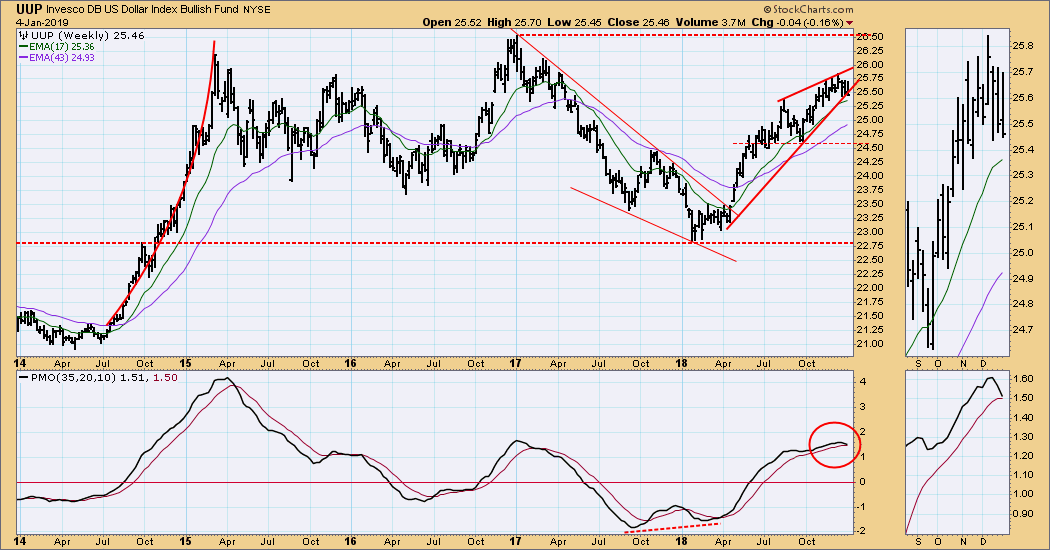
GOLD
IT Trend Model: BUY as of 10/19/2018
LT Trend Model: SELL as of 6/22/2018
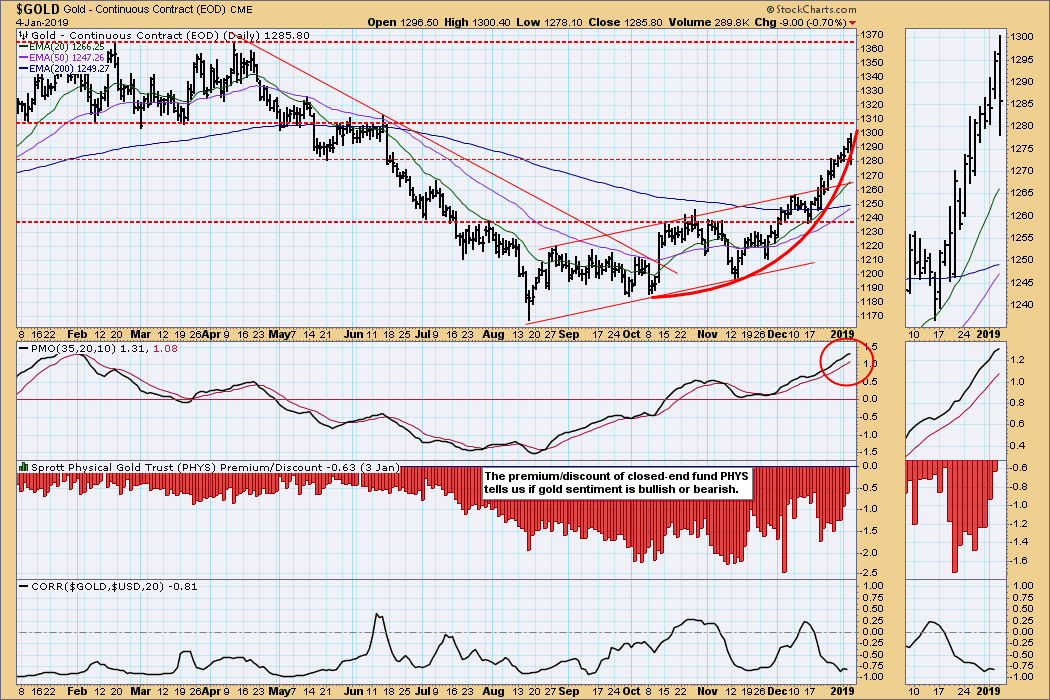
GOLD Daily Chart: I normally comment on parabolic advances when I see them on a monthly chart, but I recently noticed a mini-parabolic on gold's daily chart. The recent price advance got a bit frenzied, and the expected breakdown took place on Friday. A pullback to the top of the rising trend channel (around 1265) would be reasonable. Note that the 50EMA is closing in on the 200EMA, so I anticipate a LT Trend Model BUY signal soon.
GOLD Weekly Chart: The price pattern and weekly PMO look positive, and I anticipate that they will remain so during the short pullback I am expecting.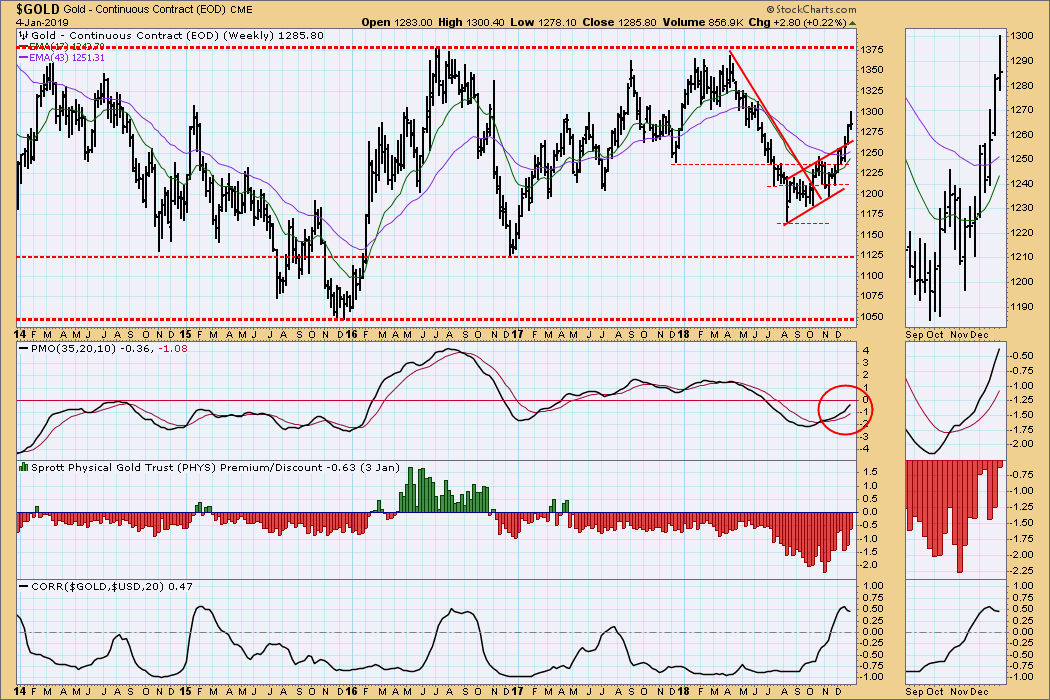
CRUDE OIL (USO)
IT Trend Model: NEUTRAL as of 10/29/2018
LT Trend Model: SELL as of 11/23/2018
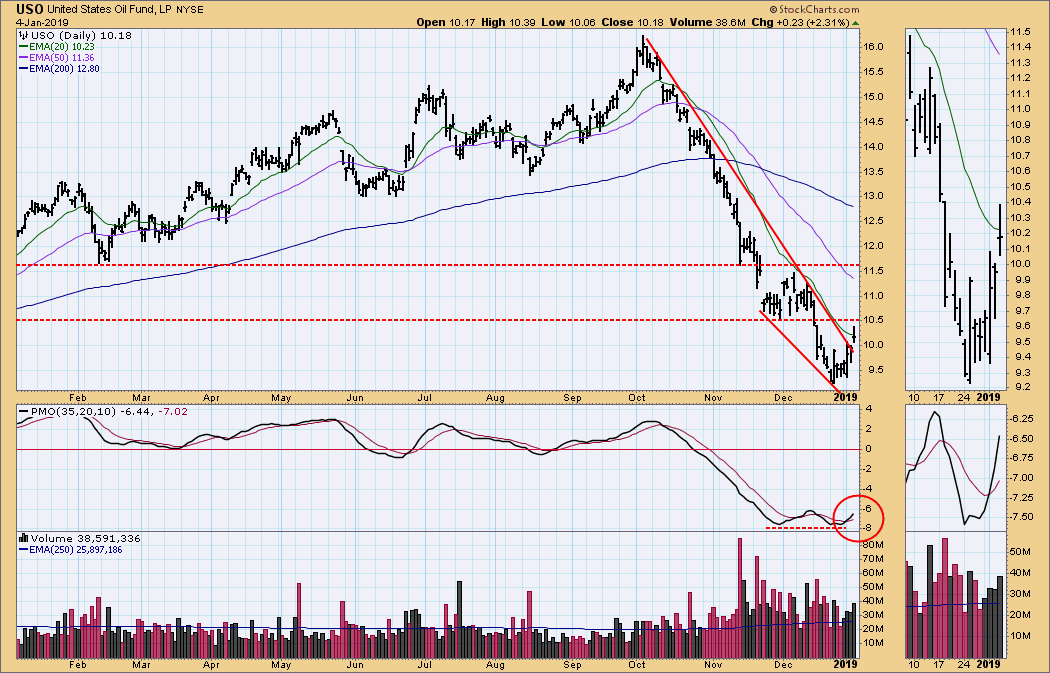
USO Daily Chart: The falling wedge resolved upward, as expected, and the daily PMO positive divergence allows for more rally.
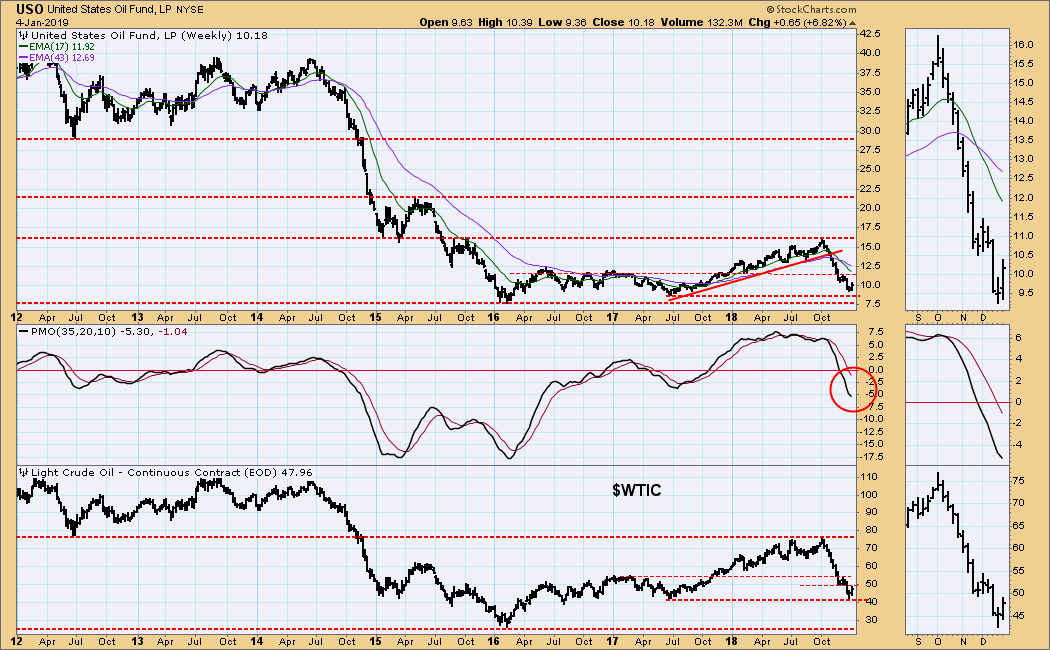
USO Weekly Chart: Crude oil ($WTIC) bottomed on the support line drawn from the 2017 low at 42.50. The breakout on the daily chart above offers hope of a new rally, but the weekly PMO needs to bottom to keep that hope alive.
BONDS (TLT)
IT Trend Model: BUY as of 12/6/2018
LT Trend Model: BUY as of 1/2/2019
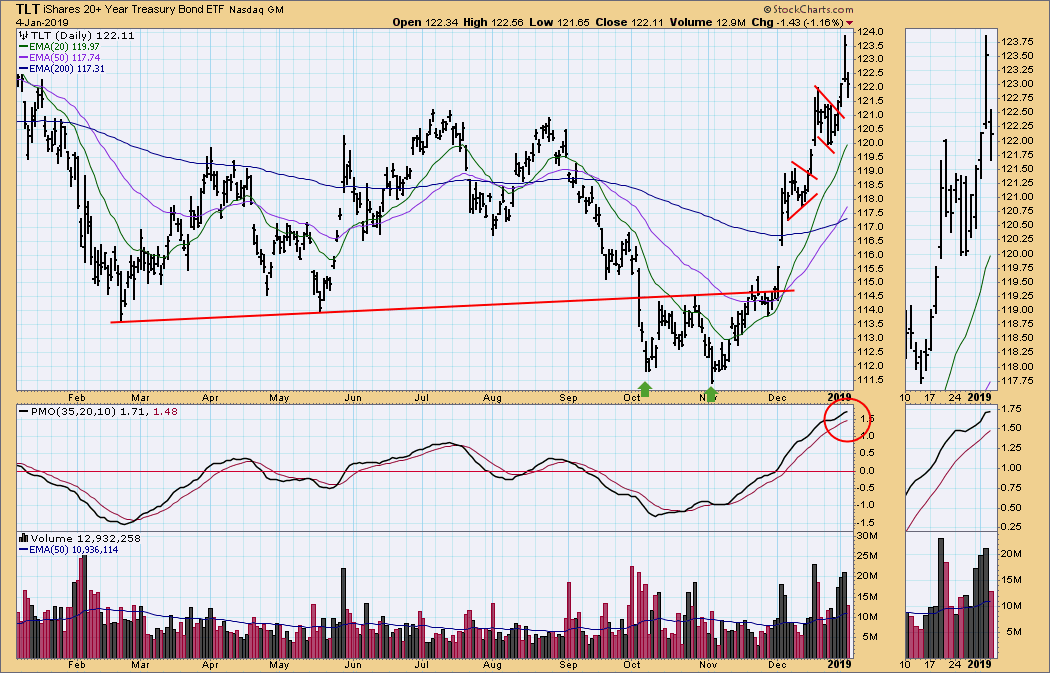
TLT Daily Chart: From the November low TLT has advanced +11%. This week it broke out of a bullish flag formation, and seemed to be adding another up leg on Thursday, but Friday brought a sharp price reversal along with a potential daily PMO top. A short-term pullback seems likely.
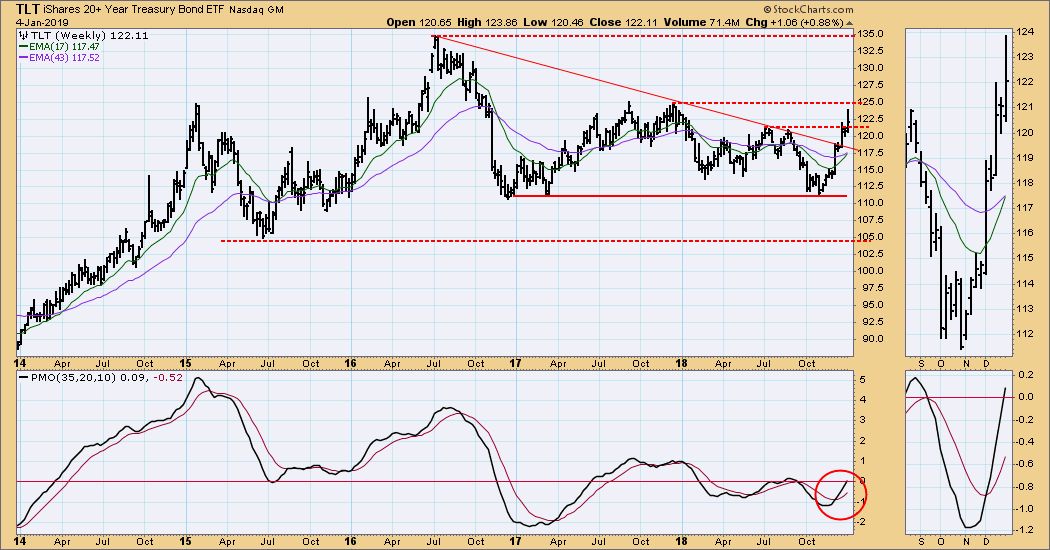
TLT Weekly Chart: The weekly PMO still looks strong, and price remains above the support line at 121.50.
**Don't miss any of the DecisionPoint commentaries! Go to the "Notify Me" box toward the end of this blog page to be notified as soon as they are published.**
Technical Analysis is a windsock, not a crystal ball.
Happy Charting!
- Carl
NOTE: The signal status reported herein is based upon mechanical trading model signals, specifically, the DecisionPoint Trend Model. They define the implied bias of the price index based upon moving average relationships, but they do not necessarily call for a specific action. They are information flags that should prompt chart review. Further, they do not call for continuous buying or selling during the life of the signal. For example, a BUY signal will probably (but not necessarily) return the best results if action is taken soon after the signal is generated. Additional opportunities for buying may be found as price zigzags higher, but the trader must look for optimum entry points. Conversely, exit points to preserve gains (or minimize losses) may be evident before the model mechanically closes the signal.
Helpful DecisionPoint Links:
DecisionPoint Shared ChartList and DecisionPoint Chart Gallery
Price Momentum Oscillator (PMO)
Swenlin Trading Oscillators (STO-B and STO-V)

