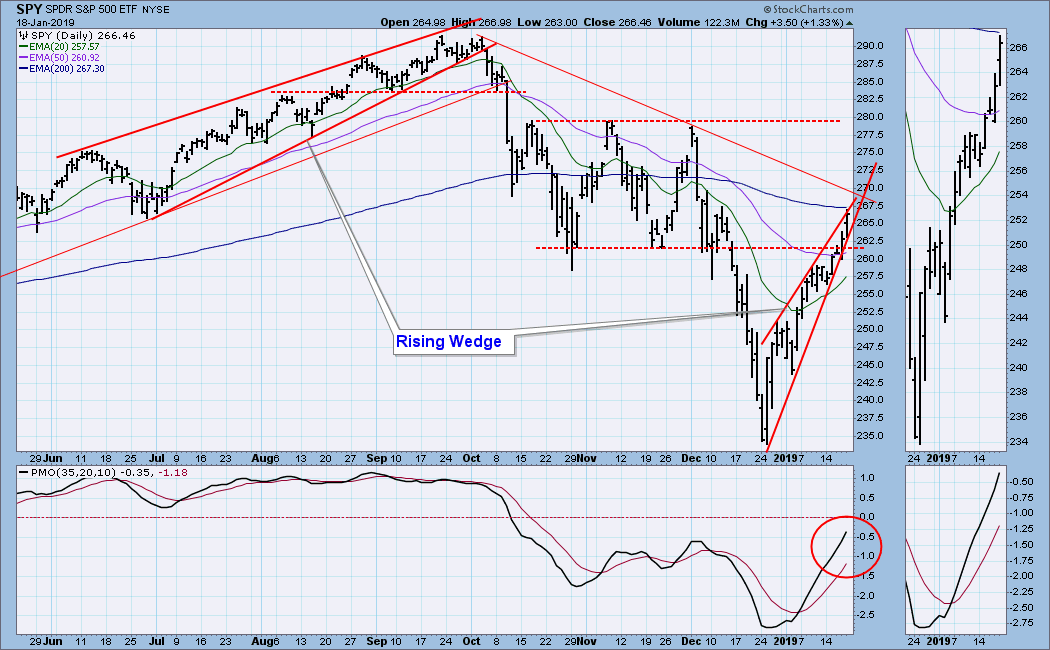
Just last week I wrote: There are two impending fundamental events to which the market is likely to react positively: (1) resolution of the trade issues with China; and (2) ending the government shutdown. Assuming that either event actually comes to pass, positive short-term reaction can be expected from either one, a reaction that could override negative short-term technical expectations; however, I don't think either of these events will end the bear market. On Thursday a rumor surfaced that the U.S. might lift some of the tariffs on Chinese goods, and the market rallied. The rally persisted even after the administration denied the story. Today a story broke that China had offered a way to eliminate the trade imbalance, and the market rally continued. Nevertheless, the dominant pattern on the chart is still the rising wedge, which is technically expected to resolve downward. Will this be one of those times when market beats the odds?
The DecisionPoint Weekly Wrap presents an end-of-week assessment of the trend and condition of the stock market (S&P 500), the U.S. Dollar, Gold, Crude Oil, and Bonds.
Watch the latest episode of DecisionPoint on StockCharts TV's YouTube channel here!
SECTORS
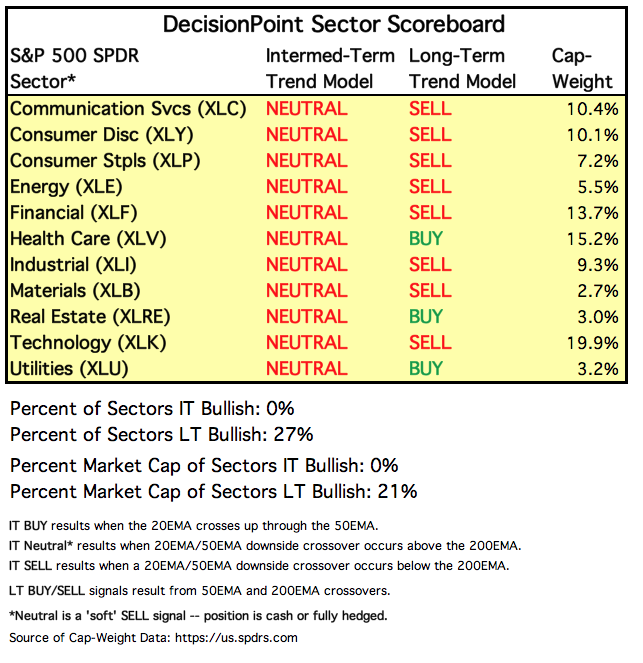
Each S&P 500 Index component stock is assigned to one, and only one, of 11 major sectors. This is a snapshot of the Intermediate-Term and Long-Term Trend Model signal status for those sectors.
We reported on the DecisionPoint show that an ITTM BUY signal had been generated today. That was an error on my part. Apologies.
STOCKS
IT Trend Model: NEUTRAL as of 10/15/2018
LT Trend Model: SELL as of 12/14/2018
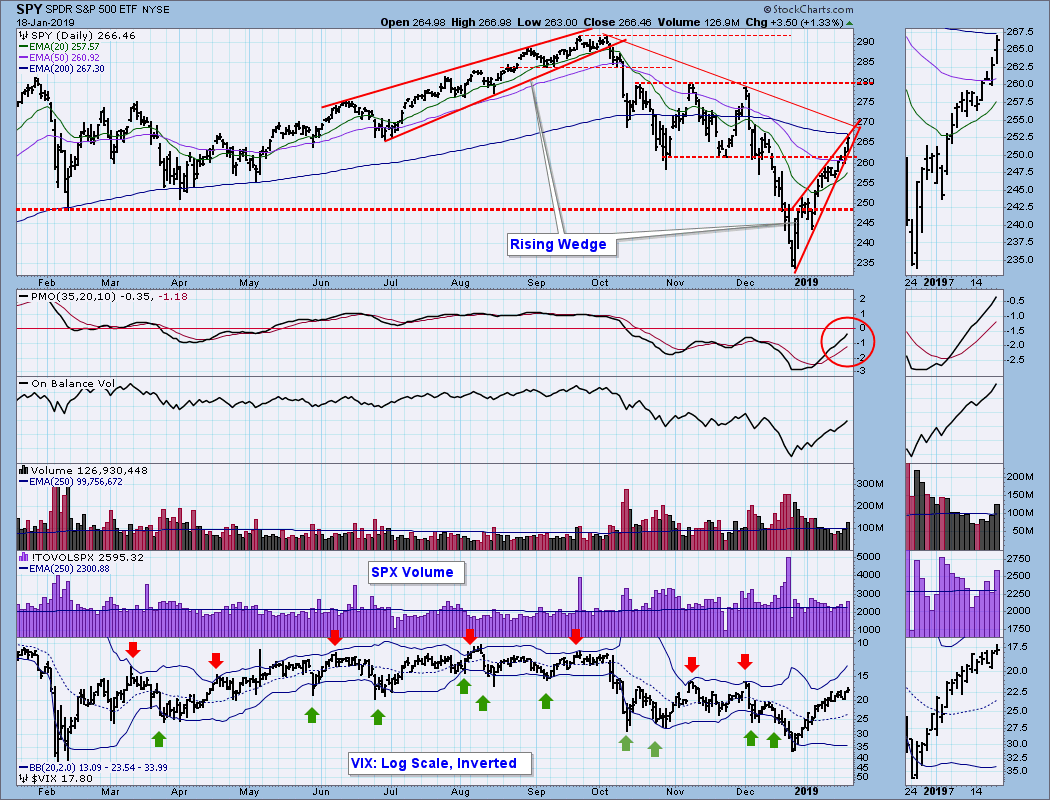
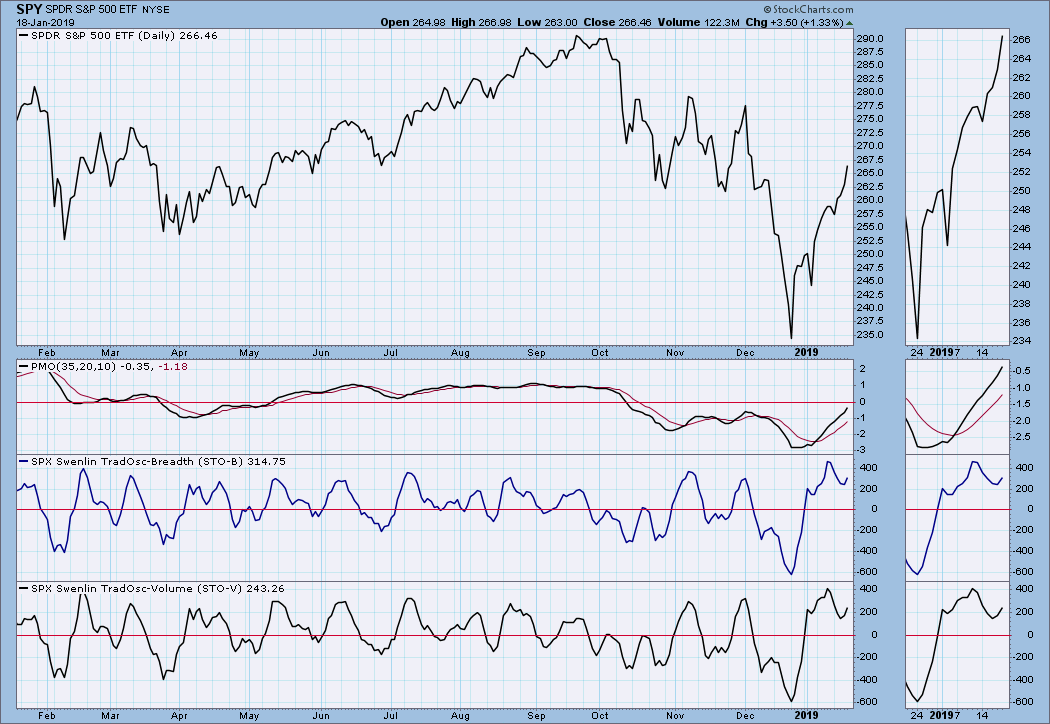
SPY Daily Chart: In spite of the news-fueled rally, the rising wedge has not yet been resolved, but there is very little room left inside the wedge, and it will have to resolve in a day or two. It isn't easy to see on the chart, but on Thursday SPY had started to break down out of the rising wedge pattern, but the news broke, and that was the end of that. This was options expiration week, so the higher-than-average volume could be attributed to that rather than commitment to the rally, but there is no way to tell. The VIX is looking toppy and has not reached the top Bollinger Band, which could be a prelude to a price reversal.
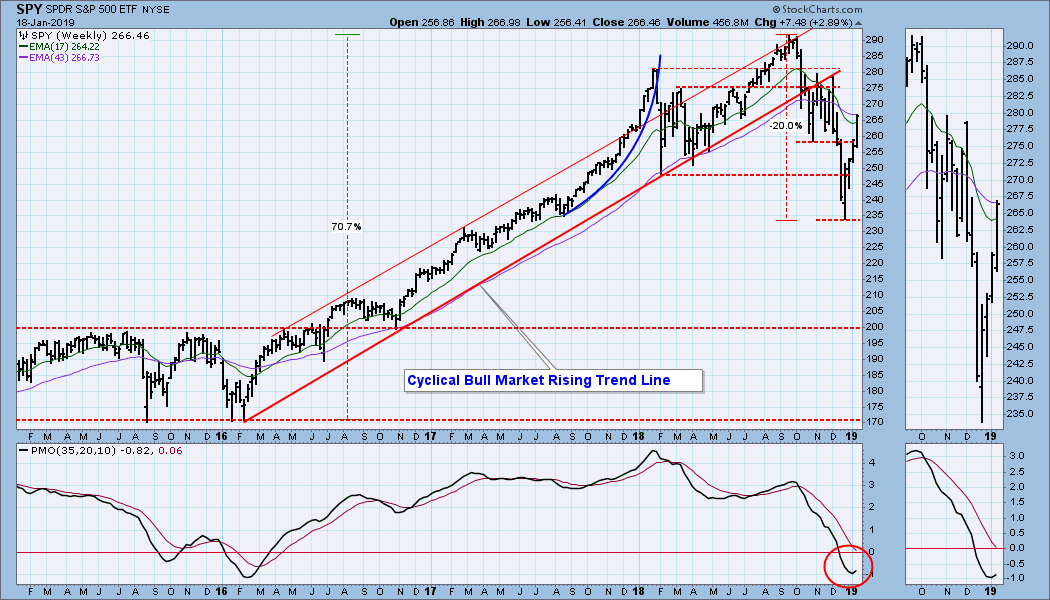
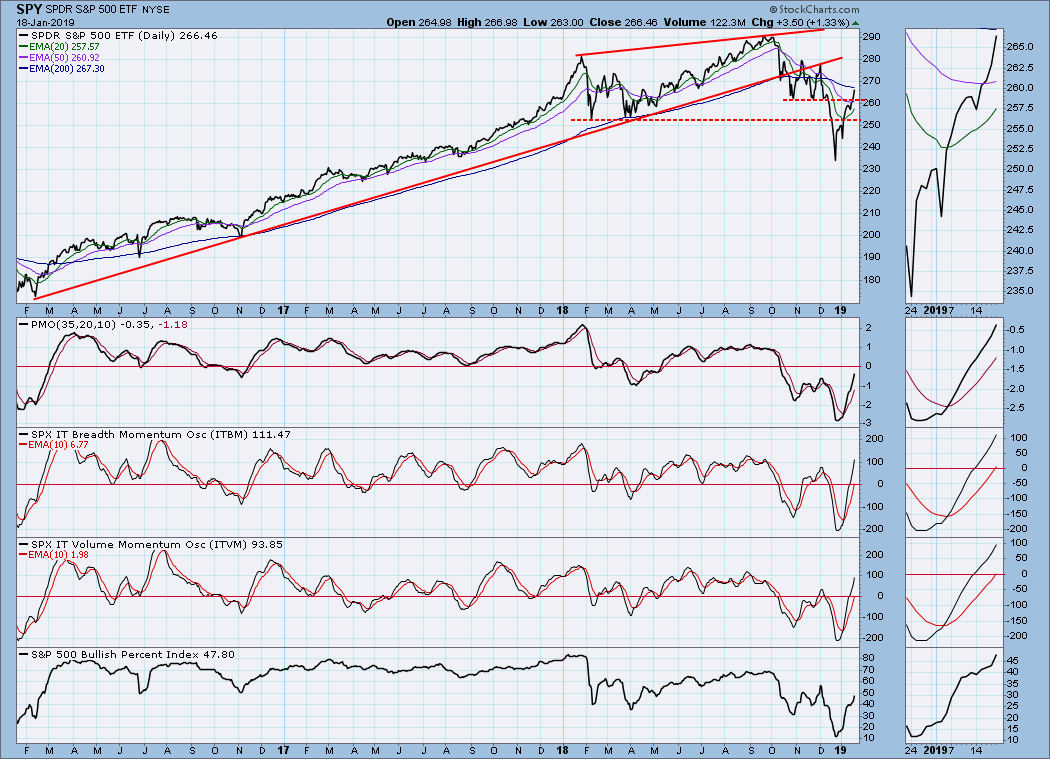
SPY Weekly Chart: Price penetrated the resistance level at about 258, and the weekly PMO has turned up. That's pretty bullish.
 Short-Term Market Indicators: A continued rally in spite of last week's oversold indicator tops is bullish behavior.
 Intermediate-Term Market Indicators: The ITBM and ITVM are overbought. Let's see it the market cares.
CONCLUSION: The news on trade is positive, but there is a long way to go before a final deal is made -- today's hope can easily be replaced by disappointment tomorrow. Technically, the weekly PMO bottom is very positive for the market longer-term. Of more immediate concern is the daily chart rising wedge formation. Odds are that it will resolve downward, but that won't necessarily mean that the rally is over. A pullback to set a less accelerated angle of ascent would be a healthy result. Do I think we're still in a bear market? I can see how it is possible that we are not.
DOLLAR (UUP)
IT Trend Model: BUY as of 4/24/2018
LT Trend Model: BUY as of 5/25/2018
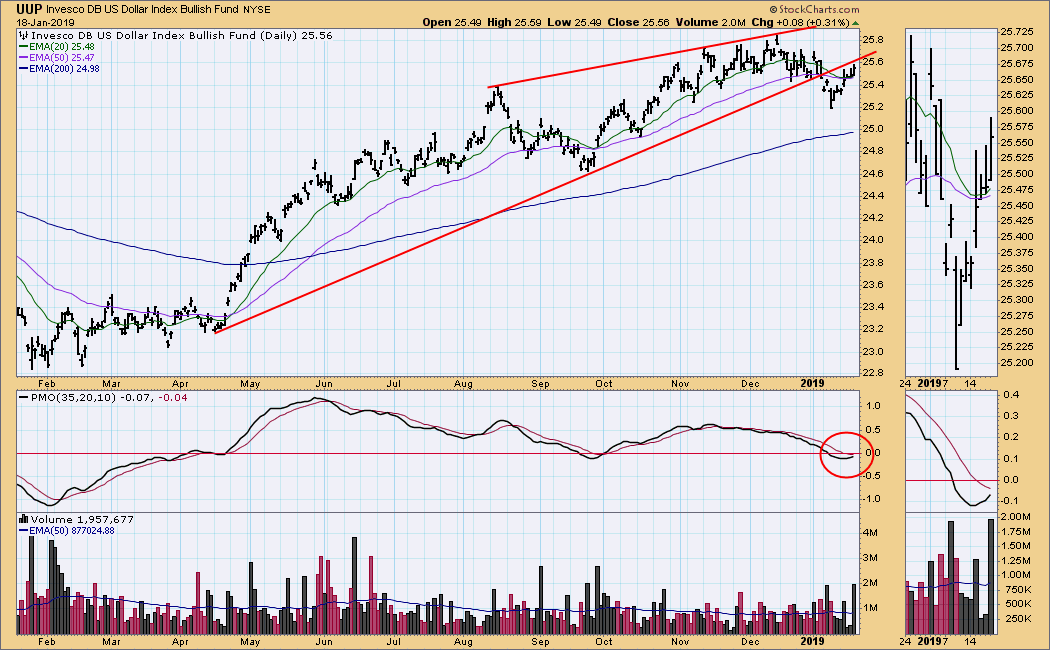
UUP Daily Chart: Positive. Price broke down from the rising wedge, as expected. After a small correction, a new rising trend has started, and the daily PMO has turned up nicely. Note that a 20EMA/50EMA downside crossover was narrowly missed.
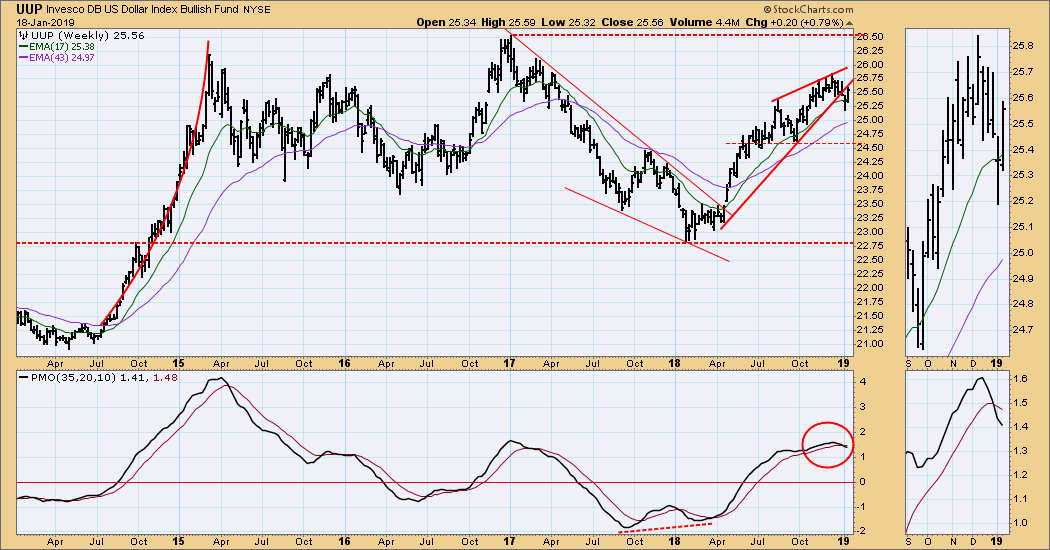
UUP Weekly Chart: The negative weekly PMO configuration (below the signal line and falling) argues against a continued rally; however, the positive daily chart could prevail.
GOLD
IT Trend Model: BUY as of 10/19/2018
LT Trend Model: BUY as of 1/8/2019
GOLD Daily Chart: After a somewhat accelerated advance in November and December, gold has moved sideways for two weeks. It dropped on Friday, but has remained above support at 1280. The daily PMO has topped and crossed down through the signal line, so we're probably going to see a pullback. Next support is at about 1260.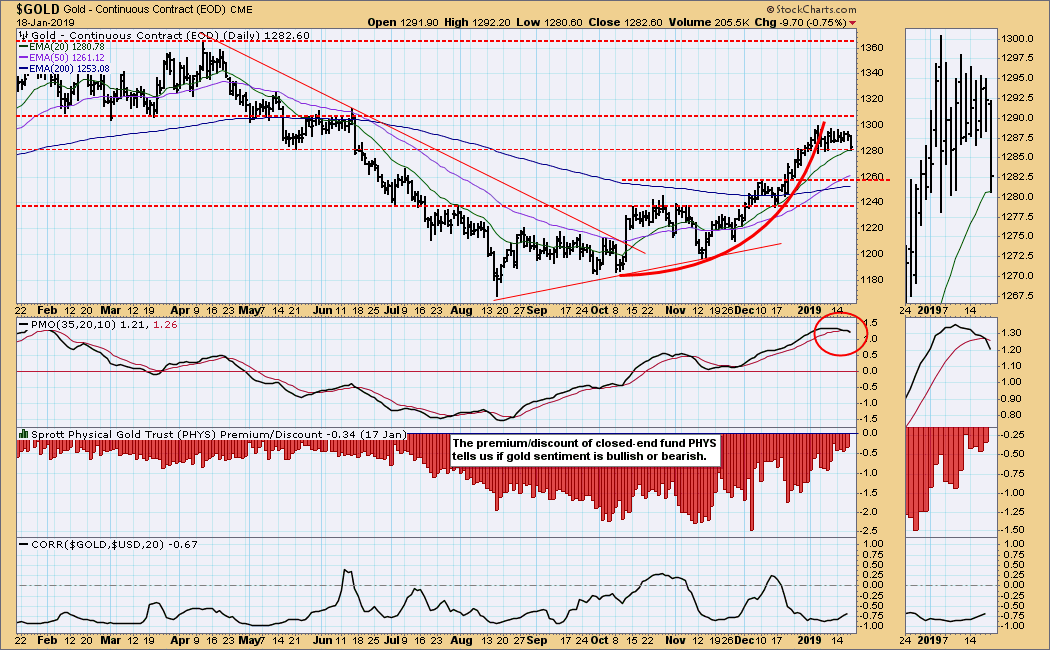
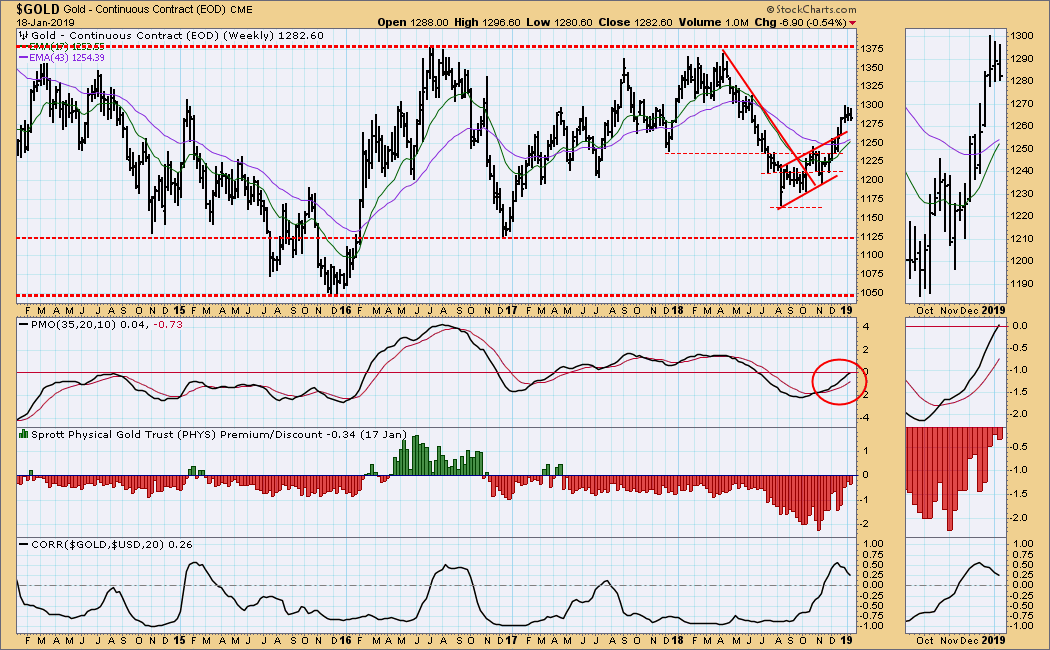
GOLD Weekly Chart: Positive. The weekly PMO has moved above the signal line and the zero line. A short pullback probably won't reverse either of those positive signs..
CRUDE OIL (USO)
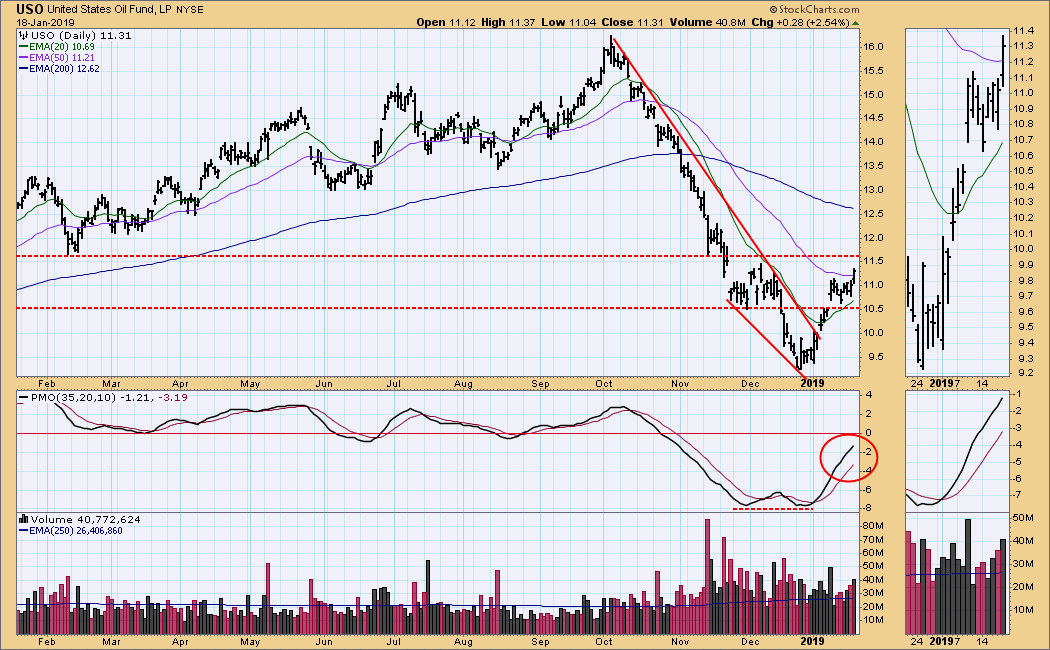
IT Trend Model: NEUTRAL as of 10/29/2018
LT Trend Model: SELL as of 11/23/2018
USO Daily Chart: The falling wedge drawn from the October top resolved to the upside, as expected, and price has rallied +23% from the December low. The daily PMO confirms obvious strength.
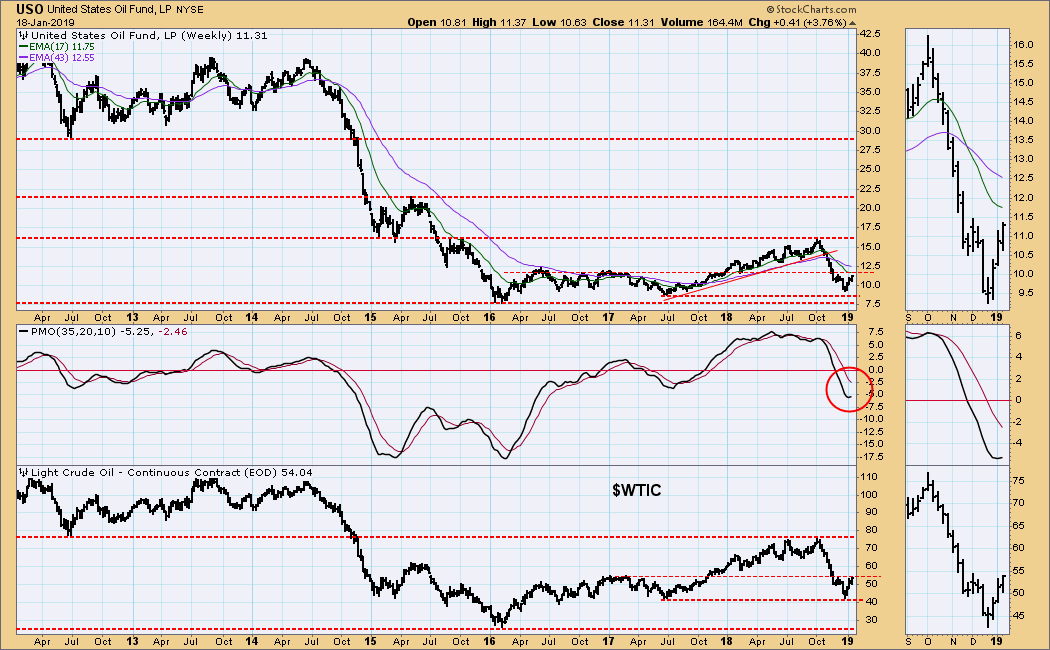
USO Weekly Chart: Both USO and WTIC are approaching overhead resistance, but the weekly PMO has bottomed, indicating that resistance is not likely to be a problem.
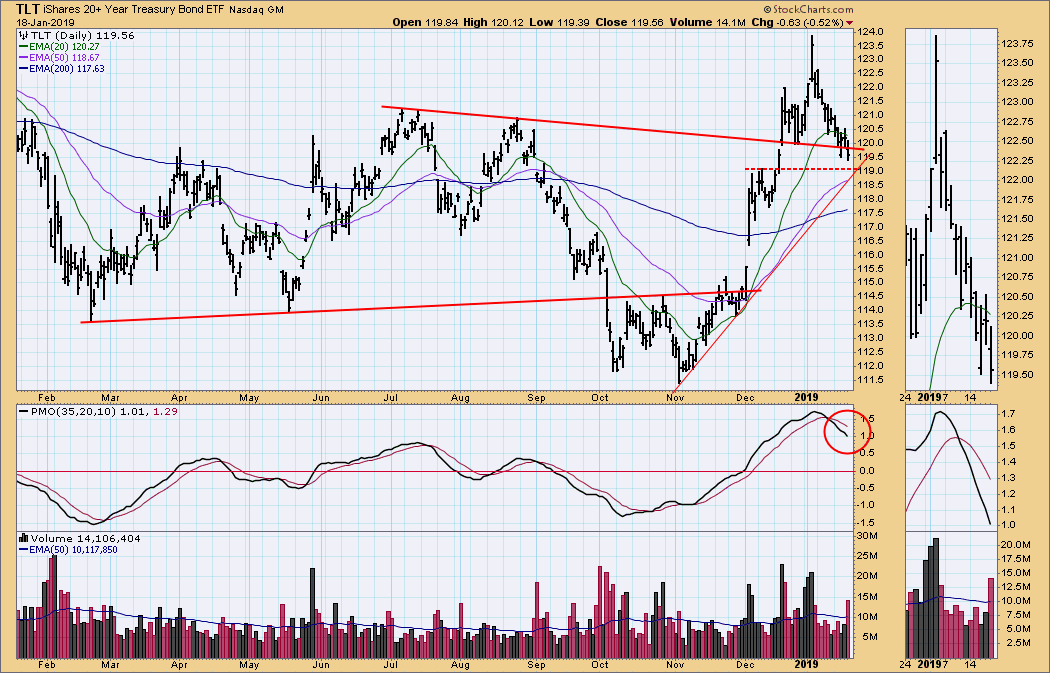
BONDS (TLT)
IT Trend Model: BUY as of 12/6/2018
LT Trend Model: BUY as of 1/2/2019
TLT Daily Chart: Negative. Price has broken below a support line, and the daily PMO is below the signal line and falling. The next horizontal support line at 119 happens to intersect with a rising trend line, possibly strengthening the support at that level.
TLT Weekly Chart: The dominant aspect of this chart is that price has been moving sideways for over two years. As a result, there have been six EMA crossovers -- a lot for a weekly chart. Because of this week's price breakdown, I assume that price will be moving lower for a while. Note that the weekly PMO is decelerating, presumably in preparation for a top.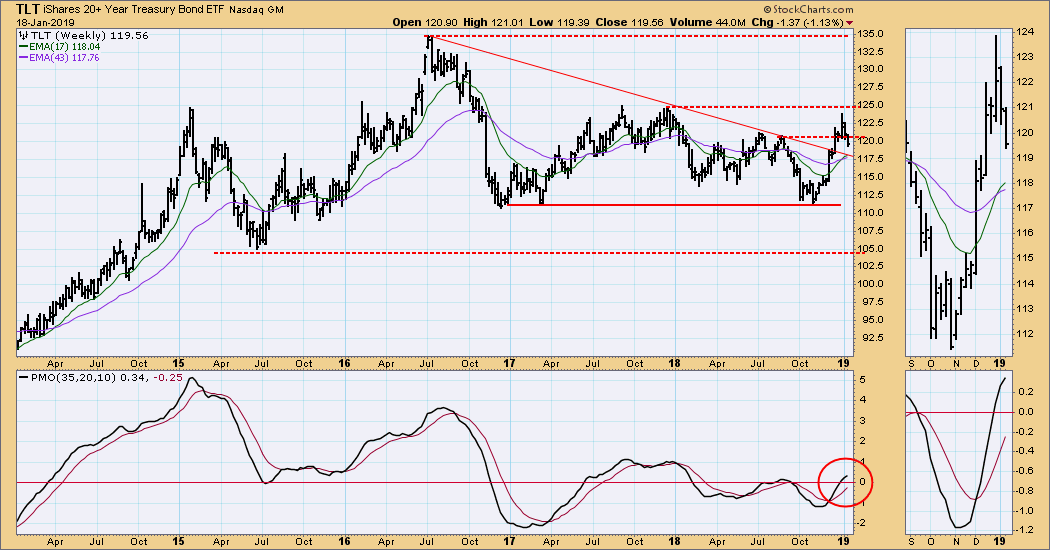
**Don't miss any of the DecisionPoint commentaries! Go to the "Notify Me" box toward the end of this blog page to be notified as soon as they are published.**
Technical Analysis is a windsock, not a crystal ball.
Happy Charting!
- Carl
NOTE: The signal status reported herein is based upon mechanical trading model signals, specifically, the DecisionPoint Trend Model. They define the implied bias of the price index based upon moving average relationships, but they do not necessarily call for a specific action. They are information flags that should prompt chart review. Further, they do not call for continuous buying or selling during the life of the signal. For example, a BUY signal will probably (but not necessarily) return the best results if action is taken soon after the signal is generated. Additional opportunities for buying may be found as price zigzags higher, but the trader must look for optimum entry points. Conversely, exit points to preserve gains (or minimize losses) may be evident before the model mechanically closes the signal.
Helpful DecisionPoint Links:
DecisionPoint Shared ChartList and DecisionPoint Chart Gallery
Price Momentum Oscillator (PMO)
Swenlin Trading Oscillators (STO-B and STO-V)


