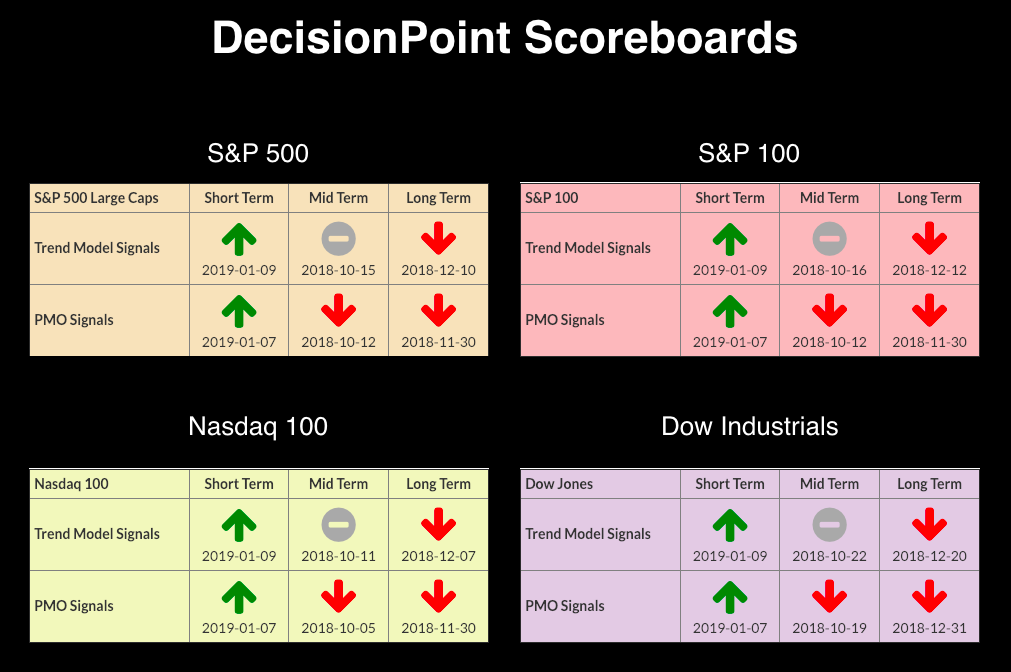
 Right now, our short-term indicators (and even our climactic ones) are suggesting decline. The rising wedge formation on the SPX is quite bearish, but I also see it as being "mature." This means that price is getting very close to the apex of the wedge. I'll explain more in the section on stocks below. The DP Scoreboards are short-term positive as far as price trend and momentum, but our DP short-term indicators are far from bullish.
The DecisionPoint Alert presents a mid-week assessment of the trend and condition of the stock market (S&P 500), the U.S. Dollar, Gold, Crude Oil and Bonds.
Watch the latest episode of DecisionPoint with Carl & Erin Swenlin on StockCharts TV's YouTube channel here!
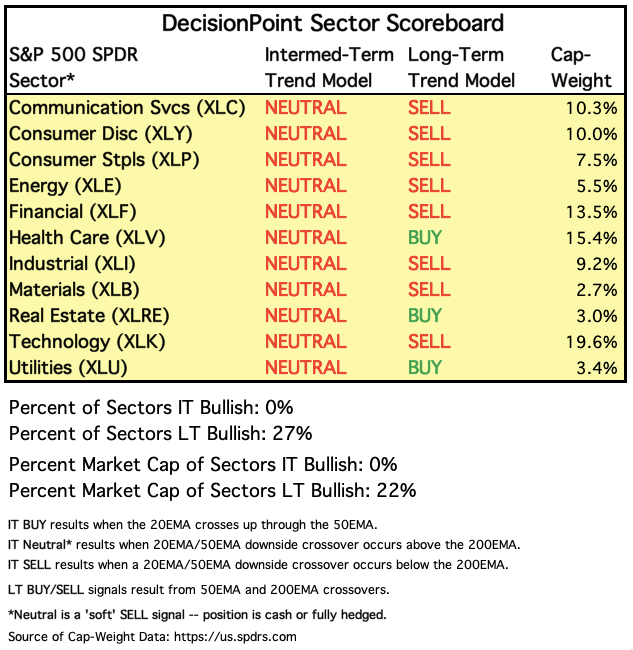
SECTORS
Each S&P 500 Index component stock is assigned to one (and only one) of 11 major sectors. This is a snapshot of the Intermediate-Term and Long-Term Trend Model signal status for those sectors.
STOCKS
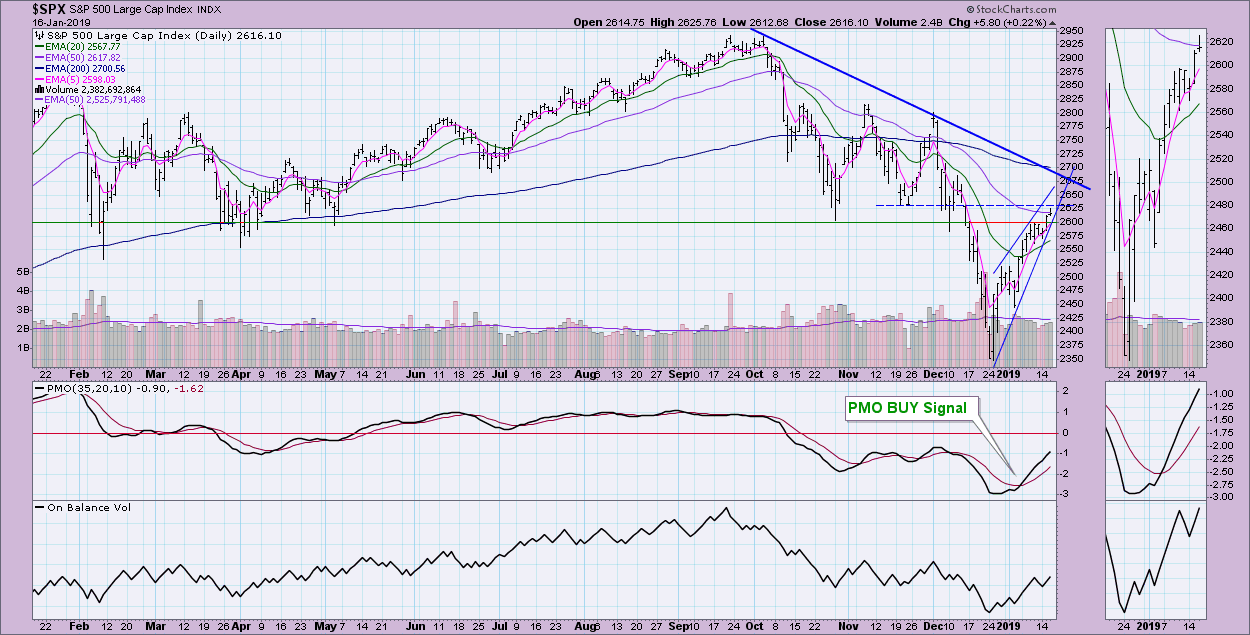
SPY - IT Trend Model: Neutral as of 10/15/2018
SPY - LT Trend Model: SELL as of 12/14/2018
SPX Daily Chart: To expand on the "mature" pattern definition, Thomas Bulkowski nullifies patterns that get more than 2/3 in to the apex. We should see the breakdown soon. If not, the pattern will lose validity. If price snuggles up in the apex, any type of consolidation or sideways move would technically be a break below the rising bottoms trend line. I don't have confidence in a "breakdown" that occurs on a drift sideways. I could see a rally continuing to the intermediate-term declining tops line, if it can first break above the November low. Price closed near the lows today, which, in general, is a sign of a reversal.
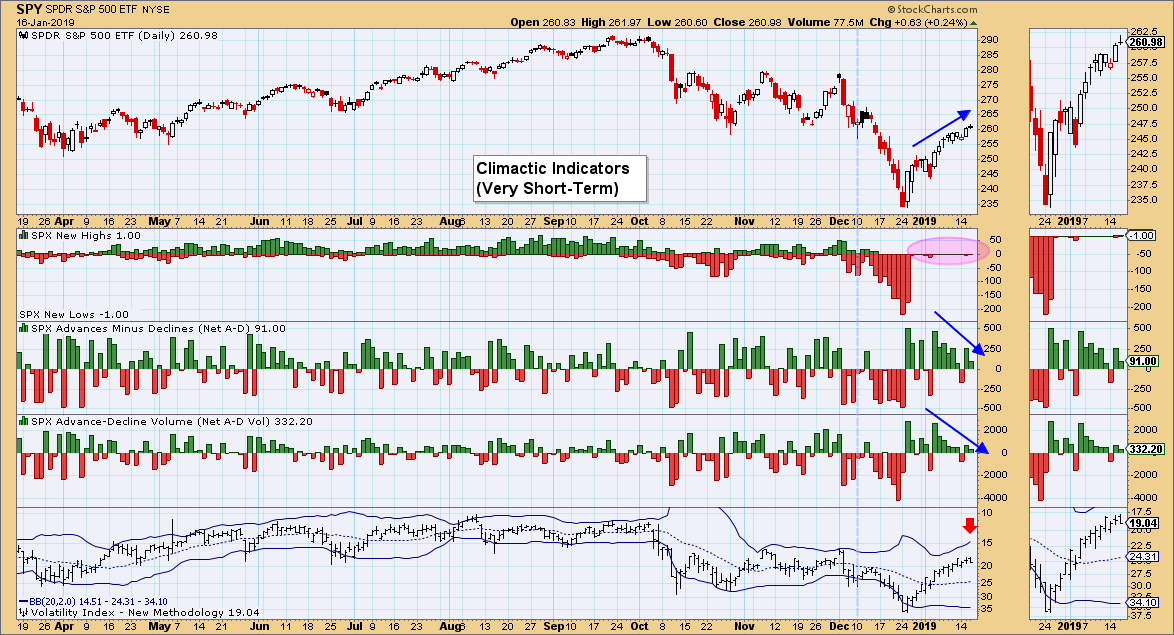
Climactic Market Indicators: Looking at the direction of breadth and price, we have a pretty strong negative divergence. The VIX has yet to reach the upper Bollinger Band, but we've seen price drops occur before that happens. Note that, despite a very strong rally off of the December low, no New Highs have been set. Part of the reason is for that is that they hit deep lows and are having to take some time to move high enough.
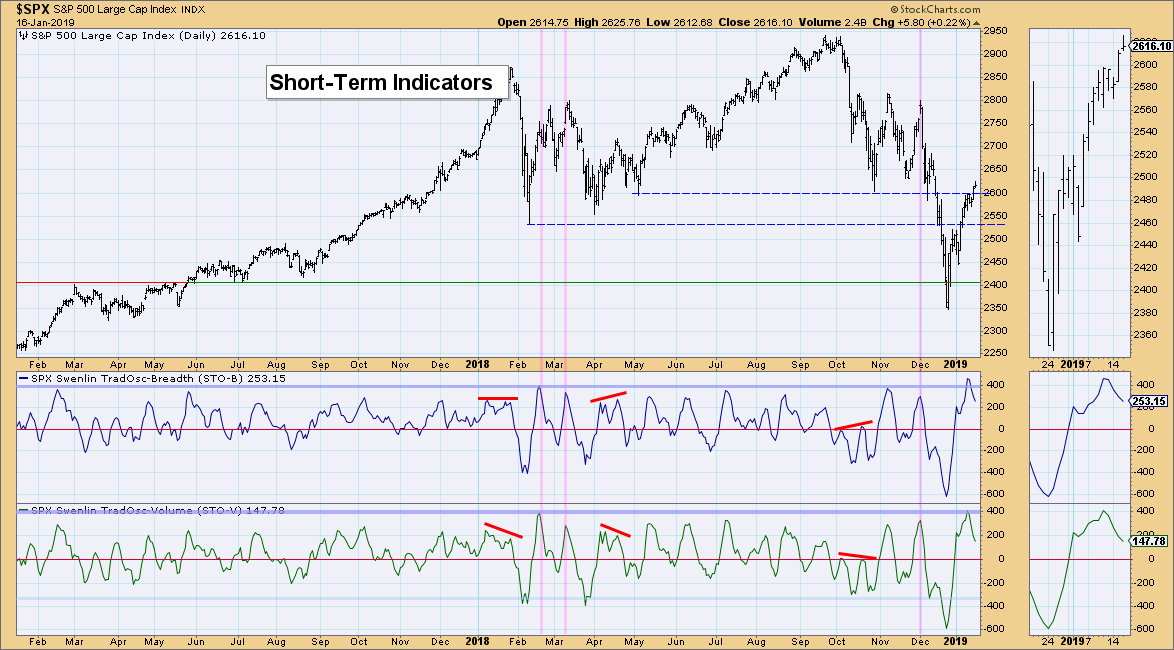
Short-Term Market Indicators: These are still overbought and declining. I would expect to see that new down leg very soon (perhaps by Friday?).
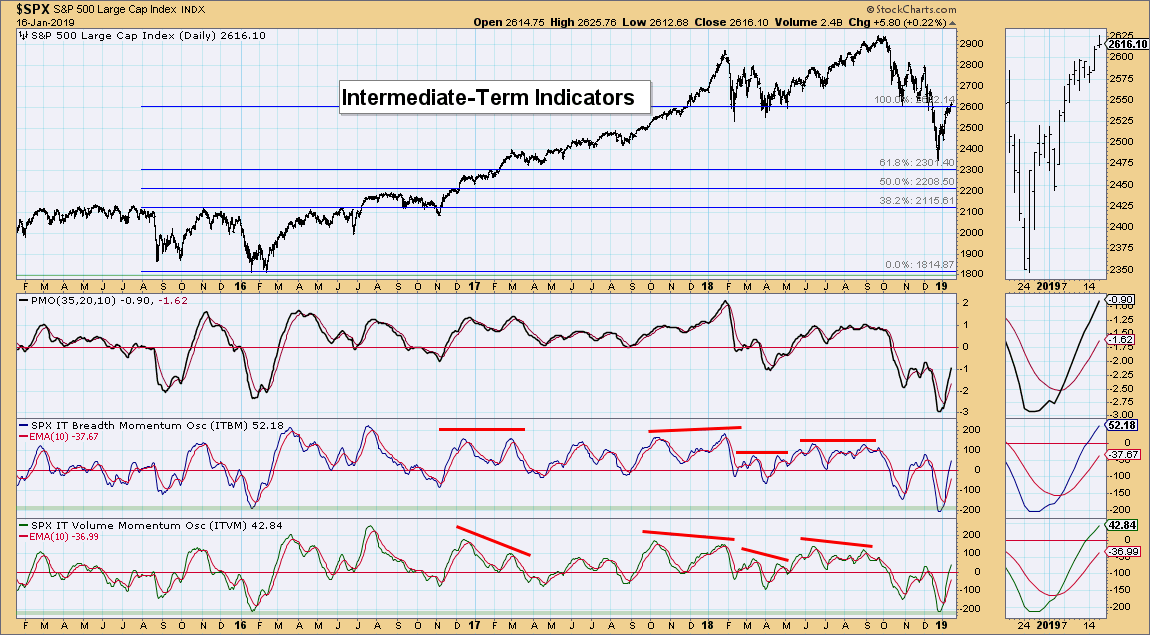
Intermediate-Term Market Indicators: These are rising bullishly and have now exited oversold territory. The bullish move of these readings is likely finishing; now is the time to watch for deceleration. Reaching positive territory is bullish, though, so we can't ignore that.
Conclusion: Price closed on the lows today and short-term indicators are suggesting a decline. I favor a failure and an execution of the bearish rising wedge.
DOLLAR (UUP)
IT Trend Model: BUY as of 4/24/2018
LT Trend Model: BUY as of 5/25/2018
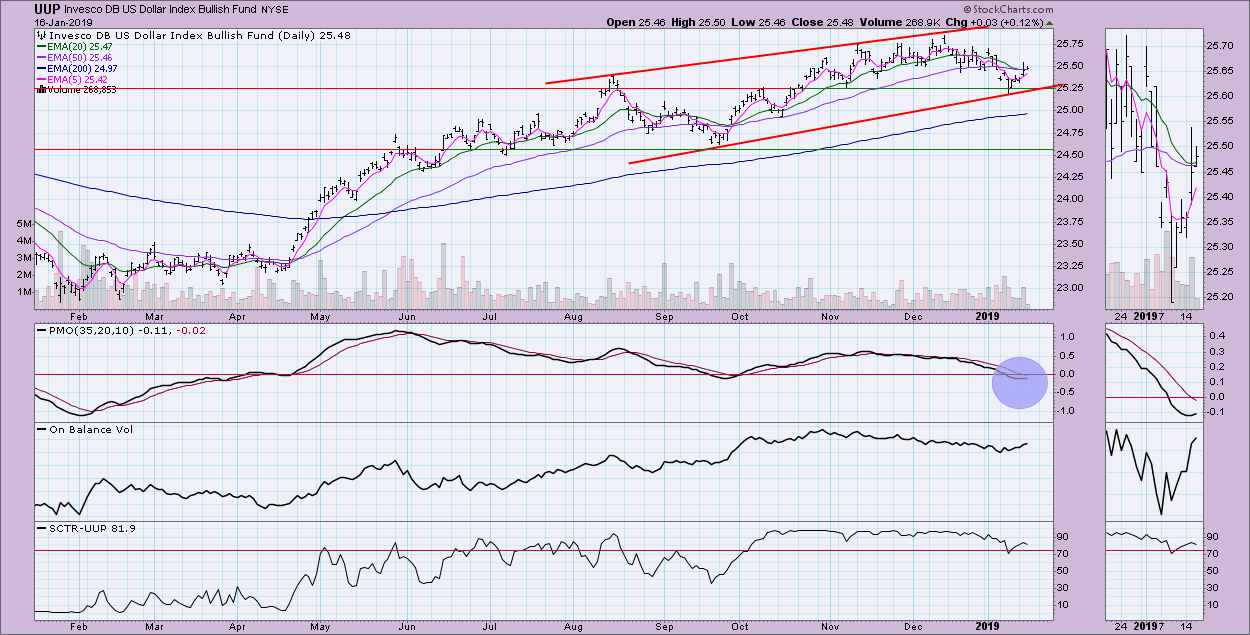
UUP Daily Chart: There is a gently rising wedge on UUP, which is a bearish pattern. However, we have a PMO that has turned up and wants to initiate a BUY signal. $25.50 is the important level right now - if that resistance level holds, a breakdown could be imminent. I'm also looking for the negative 20/50-EMA crossover.
GOLD
IT Trend Model: BUY as of 10/19/2018
LT Trend Model: SELL as of 6/22/2018
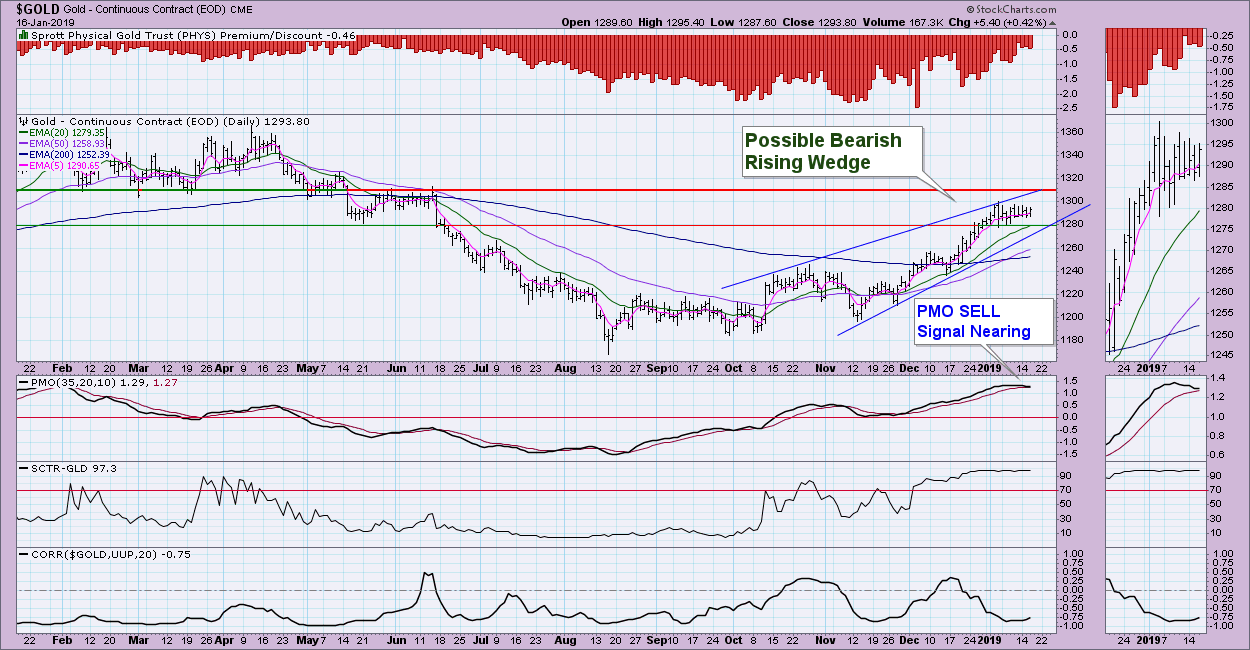
GOLD Daily Chart: The PMO has topped and is nearing a SELL signal. The good news is that Gold currently has a very high negative correlation with the Dollar. If the Dollar breaks down and executes the bearish rising wedge, that would help Gold. However, it is hard to ignore a nearing PMO SELL signal on Gold and a PMO BUY signal on tap for UUP. Honestly, I think we have some more consolidation ahead. It is certainly possible for the PMO to leave overbought territory without a big decline in price.
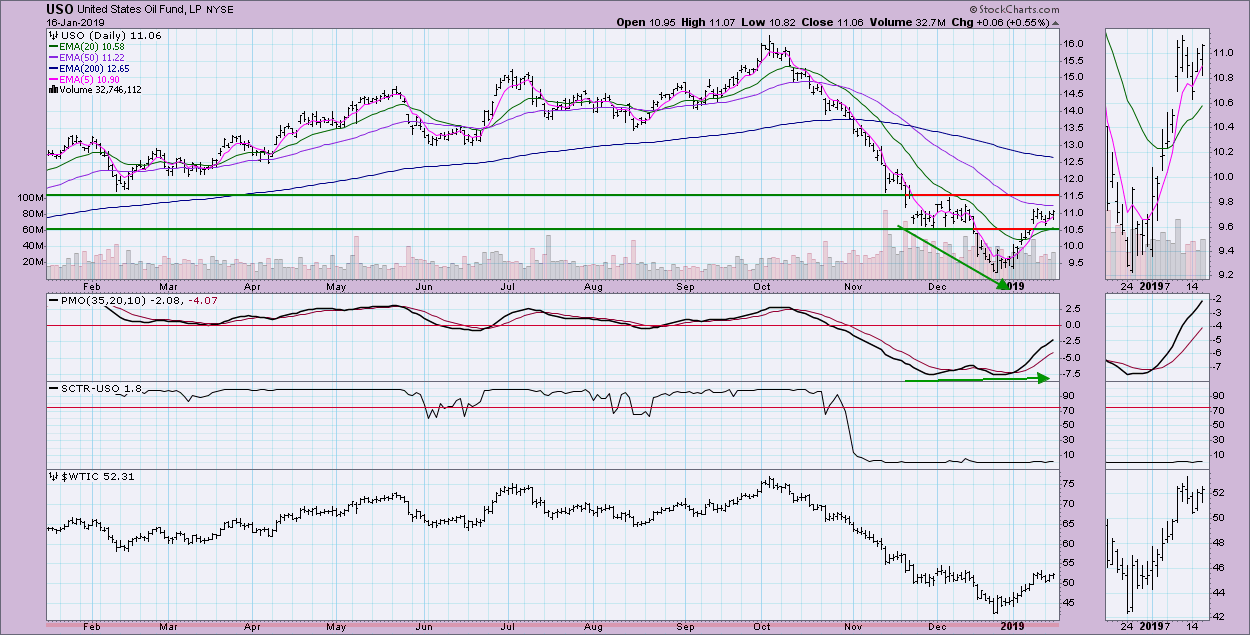
CRUDE OIL (USO)
IT Trend Model: Neutral as of 10/29/2018
LT Trend Model: SELL as of 11/23/2018
USO Daily Chart: I see a bull flag on both USO and $WTIC. Right now, I'm looking for a test of the $11.50 level and, honestly, a breakout there as well. We have a positive divergence with the PMO that started this nice rally; now it's time for some consolidation to form the flag. I find it very positive that the $10.50 level is holding up so far.
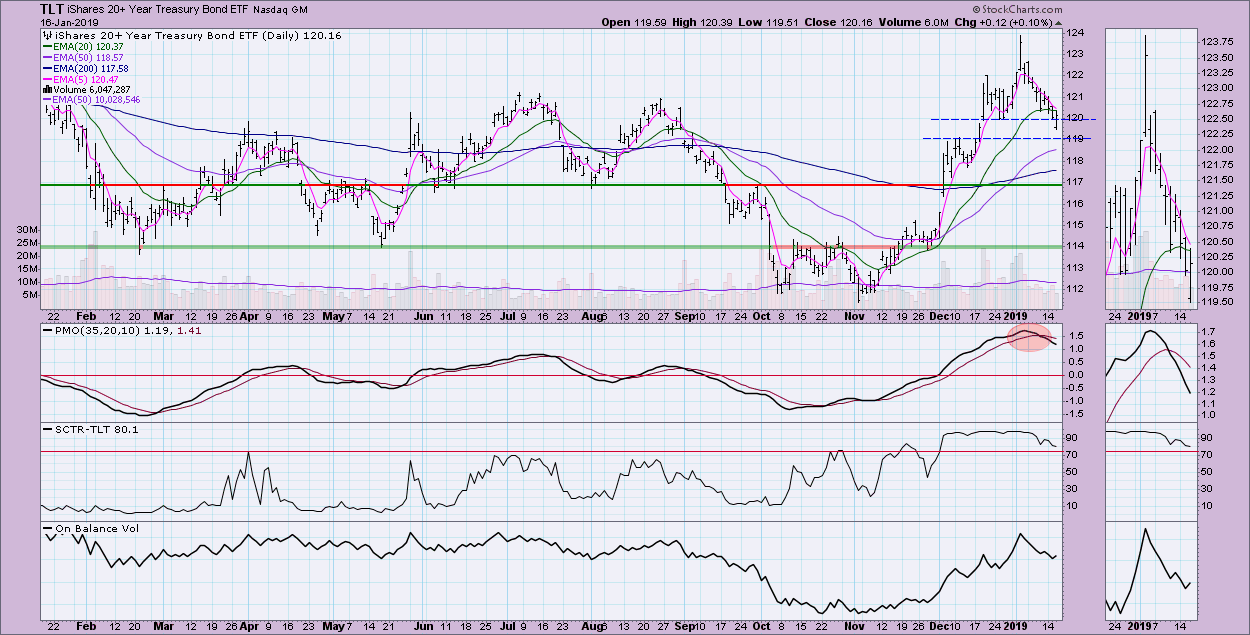
BONDS (TLT)
IT Trend Model: BUY as of 12/6/2018
LT Trend Model: BUY as of 1/2/2019
TLT Daily Chart: Today we saw a breakdown from short-term support at $120. There is support available at $119, but considering the overbought PMO SELL signal, I would look for a test of the $117 level.
Technical Analysis is a windsock, not a crystal ball.
Happy Charting!
- Erin
**Don't miss any of the DecisionPoint commentaries! Go to the "Notify Me" box toward the end of this blog page to be notified as soon as they are published.**
NOTE: The signal status reported herein is based upon mechanical trading model signals, specifically, the DecisionPoint Trend Model. These define the implied bias of the price index based upon moving average relationships, but they do not necessarily call for a specific action. They are information flags that should prompt chart review. Further, they do not call for continuous buying or selling during the life of the signal. For example, a BUY signal will probably (but not necessarily) return the best results if action is taken soon after the signal is generated. Additional opportunities for buying may be found as price zigzags higher, but the trader must look for optimum entry points. Conversely, exit points to preserve gains (or minimize losses) may be evident before the model mechanically closes the signal.
Helpful DecisionPoint Links:
DecisionPoint Shared ChartList and DecisionPoint Chart Gallery
Price Momentum Oscillator (PMO)
Swenlin Trading Oscillators (STO-B and STO-V)


