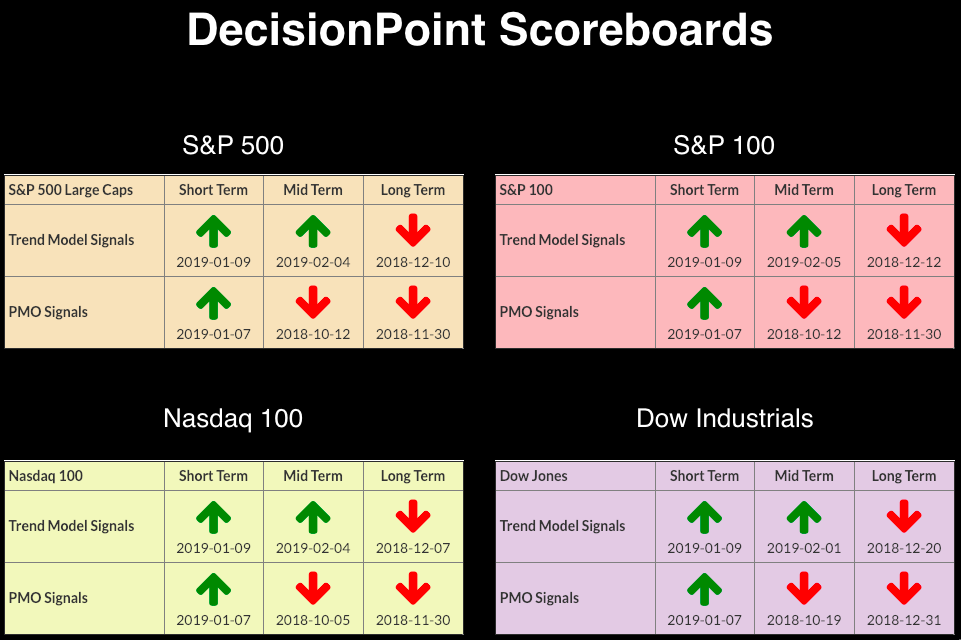
 Yesterday, I wrote about the new IT Trend Model BUY signals that are now resident on all four Scoreboards. I also noted that what used to be bearish rising wedges have become rising trend channels. Today, the Dollar posted an ST PMO BUY signal, an ST Trend Model BUY signal and an IT Trend Model BUY signal. These appear to be whipsaw signals and the bearish rising wedge on the Dollar chart is still there. You'll note that, on the DecisionPoint Sector Scoreboards, we have IT Trend Model BUY signals on everything but Consumer Staples (XLP) and Energy (XLE).
The DecisionPoint Alert presents a mid-week assessment of the trend and condition of the stock market (S&P 500), the U.S. Dollar, Gold, Crude Oil and Bonds.
Watch the latest episode of DecisionPoint on StockCharts TV's YouTube channel here!
SECTORS
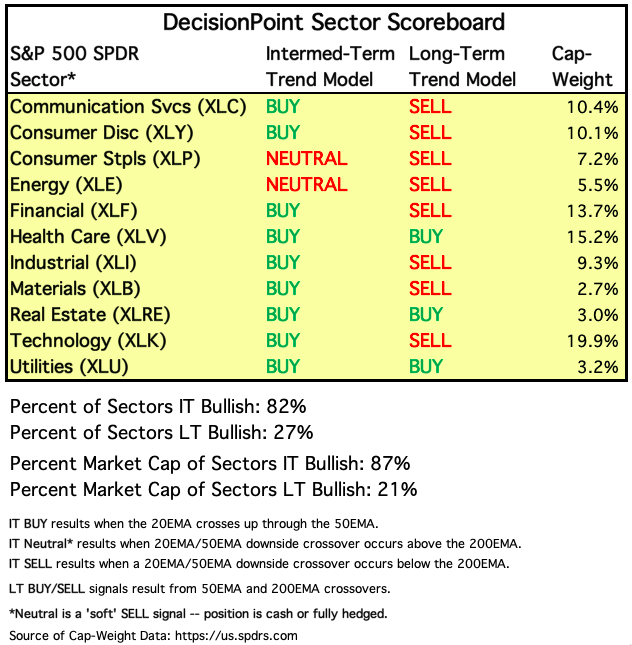
Each S&P 500 Index component stock is assigned to one (and only one) of eleven major sectors. This is a snapshot of the Intermediate-Term and Long-Term Trend Model signal status for those sectors.
STOCKS
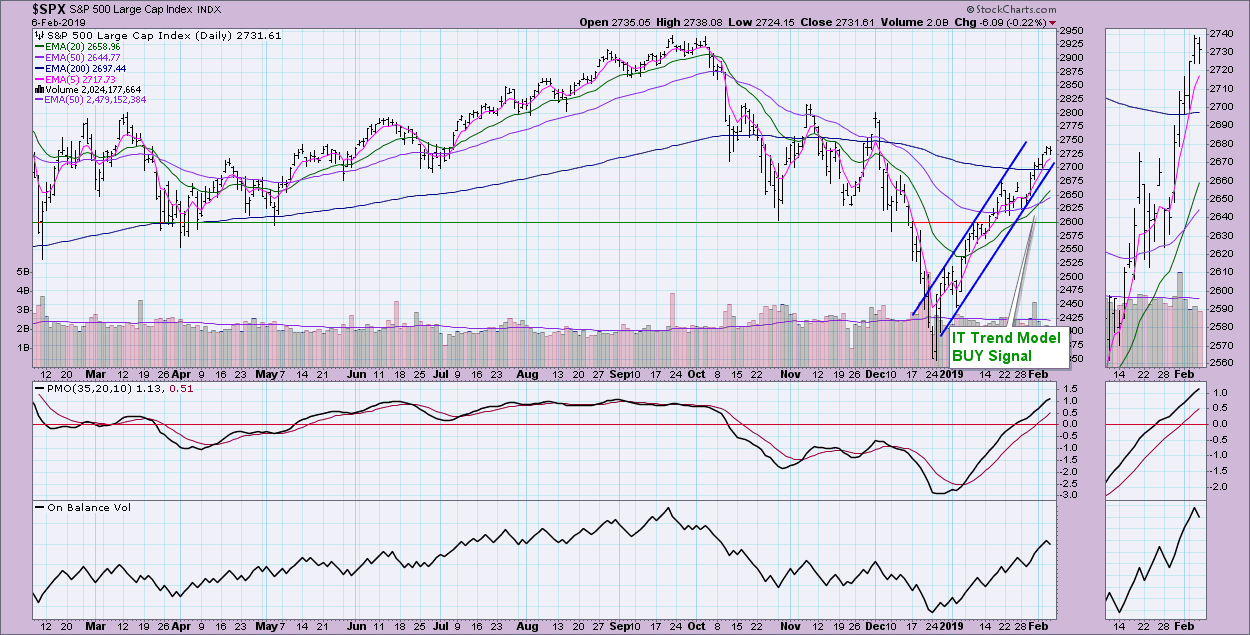
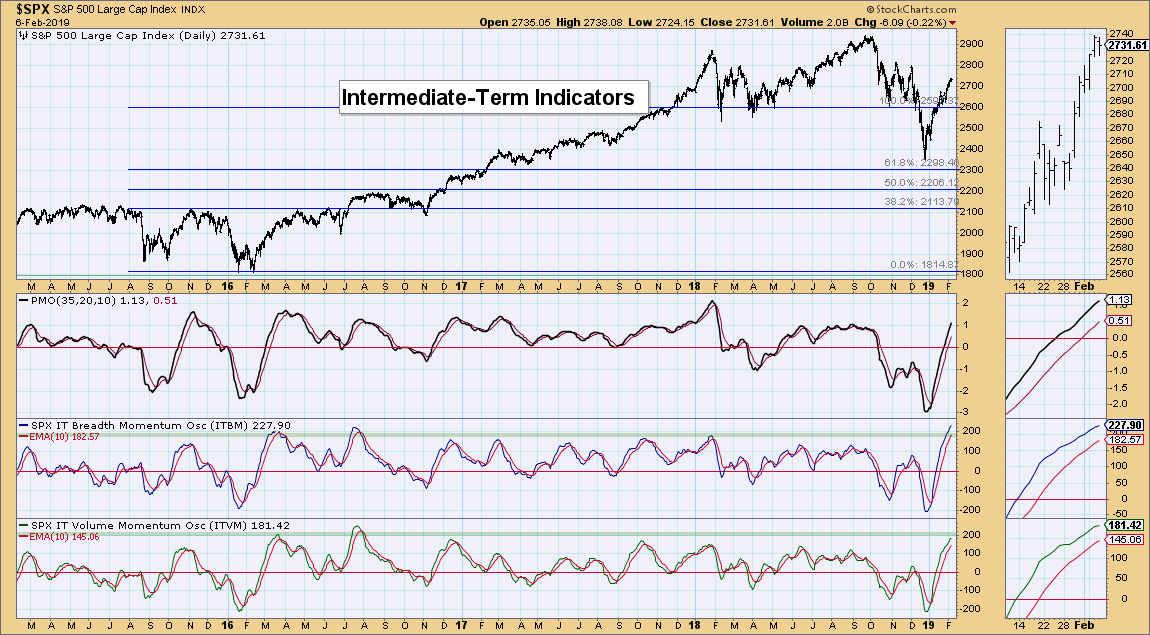
IT Trend Model: BUY as of 2/1/2019
LT Trend Model: SELL as of 12/14/2018
SPY Daily Chart: With the appearance of the rising trend channel and the breakout of the declining trend that began in October, it is hard to stay bearish. The price break above the 200-EMA was good, but we have seen price fail fairly quickly during the last two times that happened. This rising trend channel is very steep and will therefore be very difficult to maintain. Today saw a pause in the rally and I expect to see short
Climactic Market Indicators: Although breadth numbers are not that climactic, the VIX is puncturing the upper Bollinger Band, which suggests more downside over the next few days.
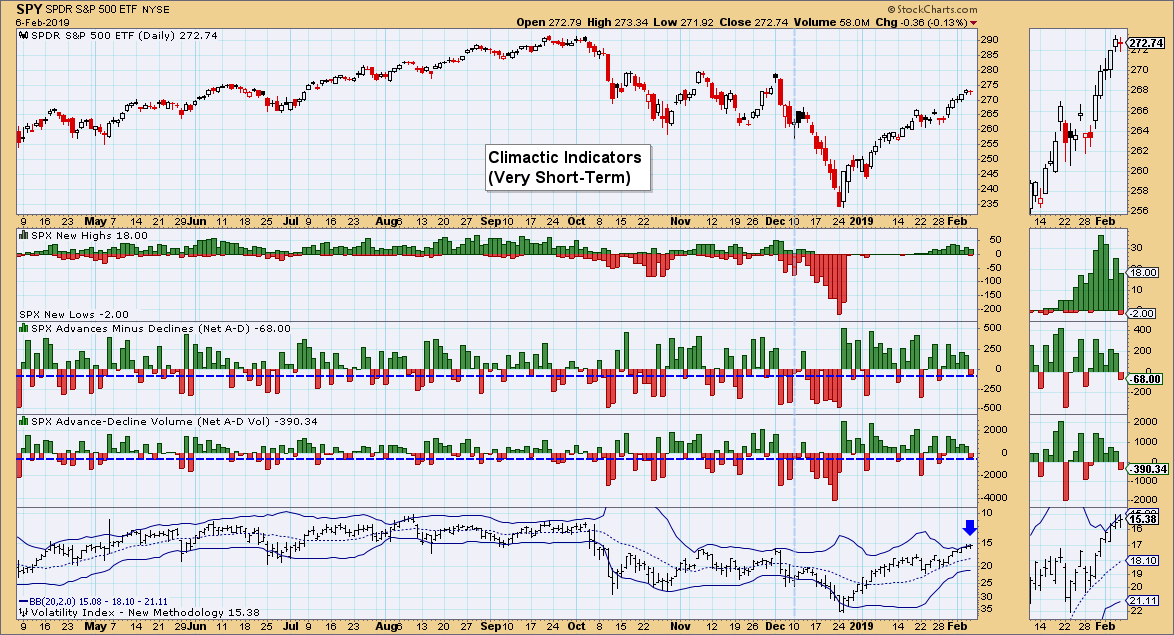
Short-Term Market Indicators: The negative divergences on our short-term indicators are bothersome and also suggest more downside, but that will be over the next week or two.
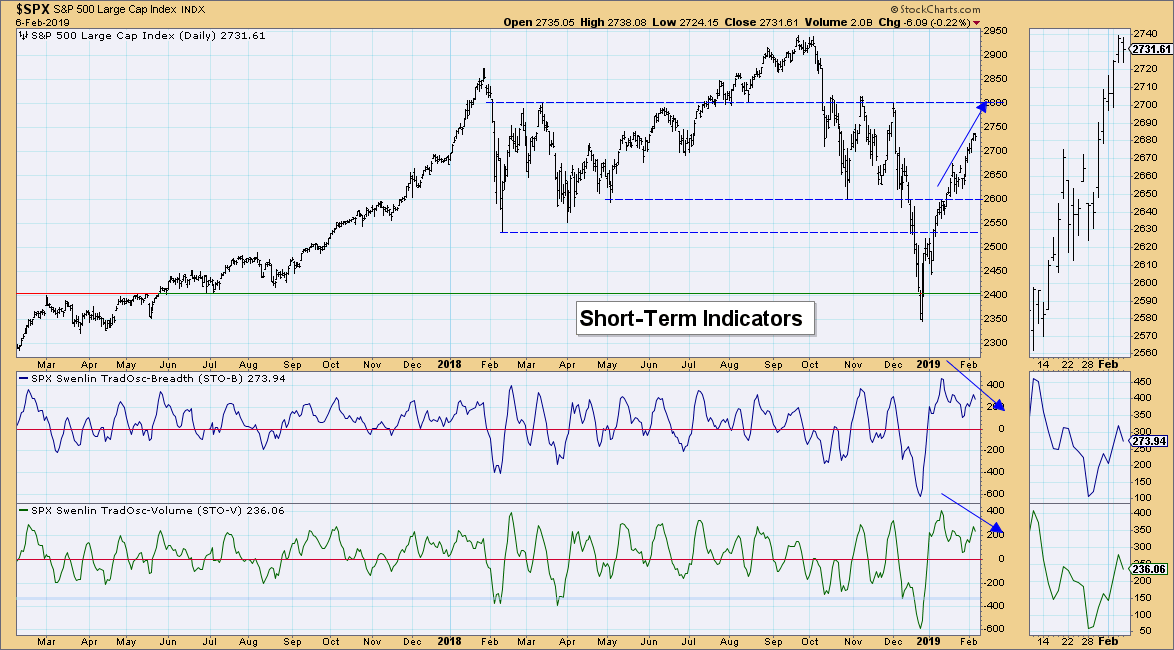
Intermediate-Term Market Indicators: These indicators are highly overbought at the top of their ranges. Given a bear market environment, these are extraordinarily overbought. This would suggest intermediate-term weakness ahead unless they can manage to unwind on sideways action or a few minor pullbacks. I would be proceeding with caution.
Conclusion: Indicators are overbought and showing negative divergences on short-term indicators. I'm expecting to see a pullback over the next week.
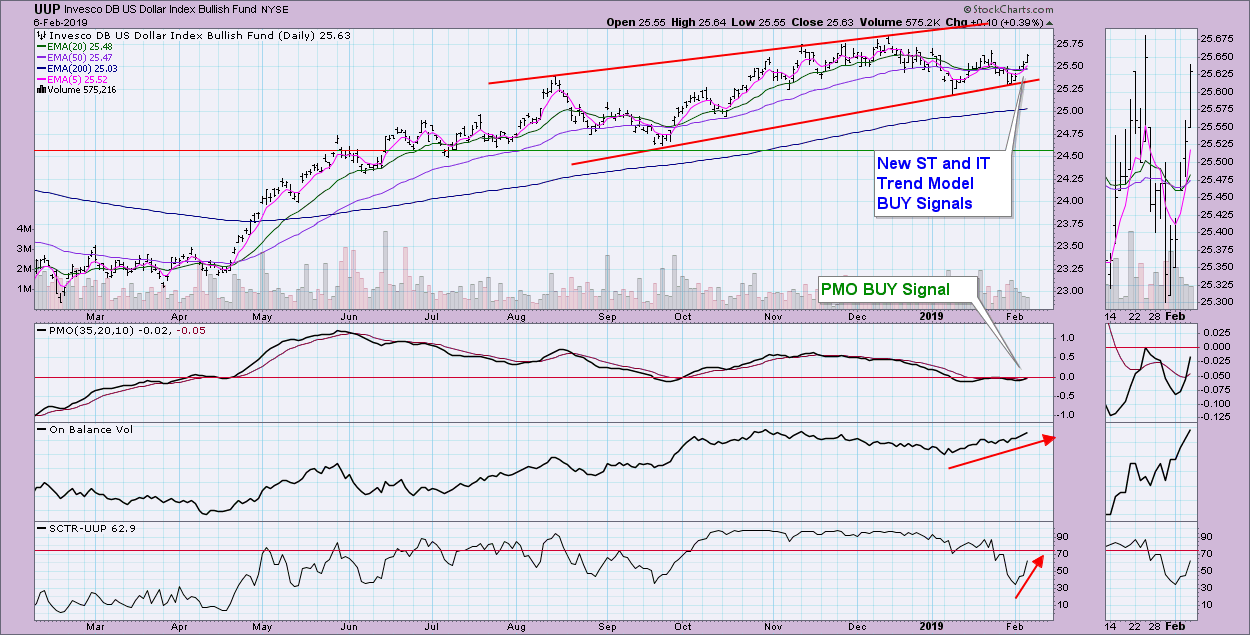
DOLLAR (UUP)
IT Trend Model: BUY as of 2/7/2019
LT Trend Model: BUY as of 5/25/2018
UUP Daily Chart: The 5-EMA crossed above the 20-EMA, triggering a Short-Term Trend Model BUY signal. The 20-EMA itself crossed above the 50-EMA, which generated an Intermediate-Term Trend Model BUY signal. The PMO crossed above its signal line, which also triggered a BUY signal. I do see a possible short-term double-bottom, but I'm more concerned overall about the bearish rising wedge. The double-bottom could still execute and bring price near the top of the wedge. The pattern still has plenty of room for price to travel in before it gets "too old," though I wouldn't expect price to move much past $25.75. OBV supports this current rally, but what is concerning is that, despite the big push upward on the OBV, price moved very little to the upside.
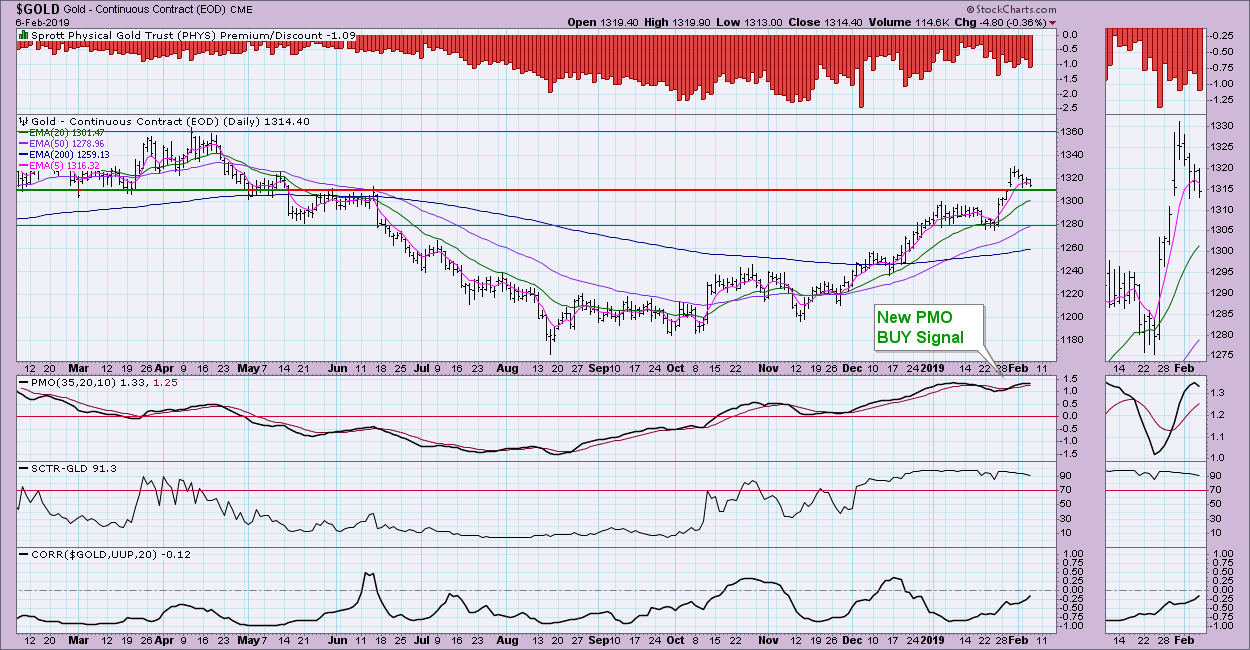
GOLD
IT Trend Model: BUY as of 10/19/2018
LT Trend Model: BUY as of 1/8/2019
GOLD Daily Chart: Given that the correlation between the Dollar and Gold is currently non-existent, it is entirely possible that Gold could rise alongside the Dollar. Gold still looks healthy, but if we lose support at 1310 then that could be the first sign that Gold is out of favor. I suspect that the market is going to take a downturn, which will likely help Gold hold support.
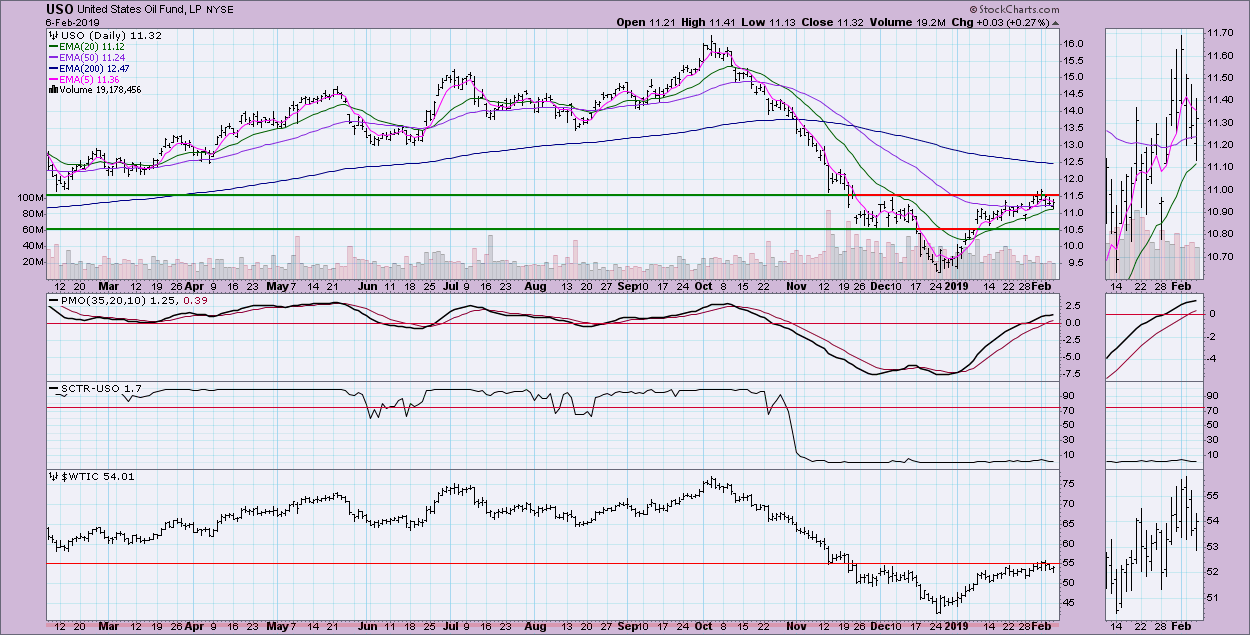
CRUDE OIL (USO)
IT Trend Model: Neutral as of 10/29/2018
LT Trend Model: SELL as of 11/23/2018
USO Daily Chart: Not much to say here. Both USO and $WTIC are in a trading range. Price is currently holding above the 20-EMA, which is encouraging, but $11.50 continues to be strong resistance. The PMO is decelerating and preparing to top, which, I think, is our forewarning that USO is ready to test the bottom of the trading range.
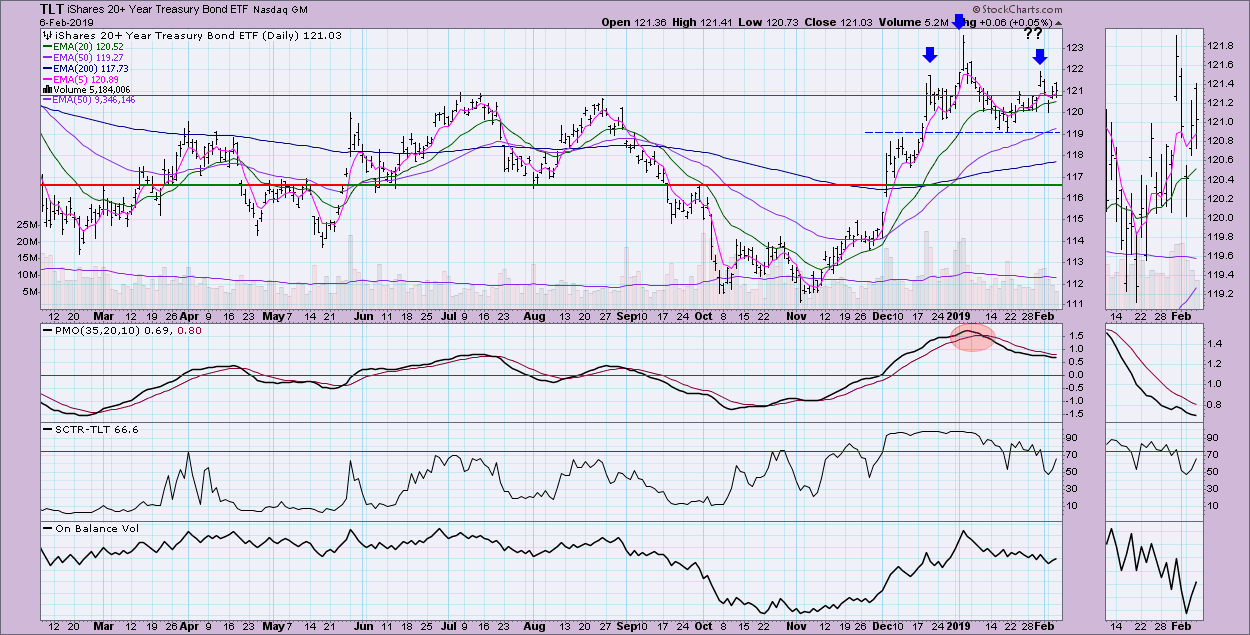
BONDS (TLT)
IT Trend Model: BUY as of 12/6/2018
LT Trend Model: BUY as of 1/2/2019
TLT Daily Chart: It would be a little messy and unconventional, but I think you can still make a case for a short-term bearish head and shoulders pattern. The PMO and OBV certainly suggest a decline is ahead. The 50-EMA is still well above the 200-EMA, so bearish conclusions to chart patterns don't always materialize as expected. I would still look for a drop to test the neckline at $119.
Technical Analysis is a windsock, not a crystal ball.
Happy Charting!
- Erin
**Don't miss any of the DecisionPoint commentaries! Go to the "Notify Me" box toward the end of this blog page to be notified as soon as they are published.**
NOTE: The signal status reported herein is based upon mechanical trading model signals, specifically, the DecisionPoint Trend Model. These define the implied bias of the price index based upon moving average relationships, but they do not necessarily call for a specific action. They are information flags that should prompt chart review. Further, they do not call for continuous buying or selling during the life of the signal. For example, a BUY signal will probably (but not necessarily) return the best results if action is taken soon after the signal is generated. Additional opportunities for buying may be found as price zigzags higher, but the trader must look for optimum entry points. Conversely, exit points to preserve gains (or minimize losses) may be evident before the model mechanically closes the signal.
Helpful DecisionPoint Links:
DecisionPoint Shared ChartList and DecisionPoint Chart Gallery
Price Momentum Oscillator (PMO)
Swenlin Trading Oscillators (STO-B and STO-V)


