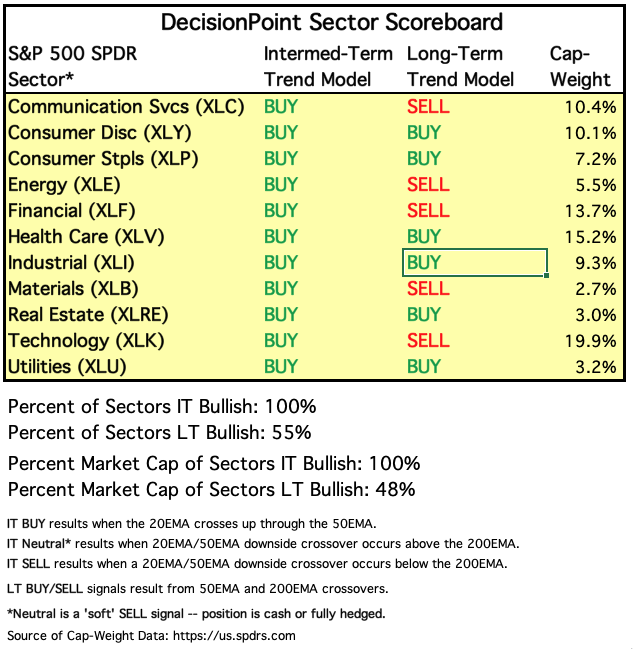
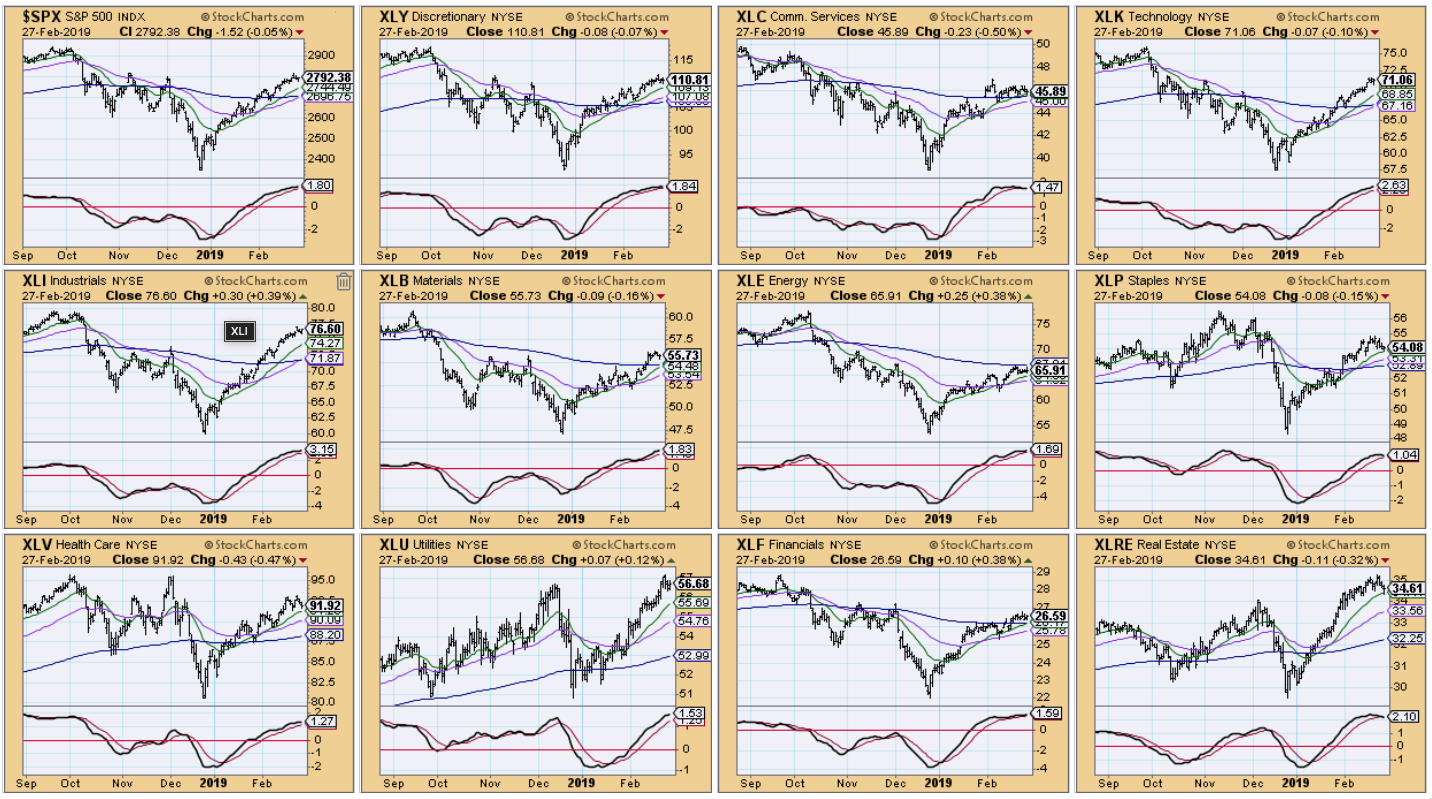
 In mid-week DP Alerts, I generally only review the SPX, as it is a Scoreboard index. However, DecisionPoint signals are reported to Timer Digest based on the SPY. Yesterday, the SPY generated a Long-Term Trend Model (LTTM) BUY signal. The SPX still has some ground to cover before it can log the same signal. The Industrials SPDR (XLI) triggered a LTTM BUY signal today. With the Sector Scoreboards looking so healthy, it is hard to be a hardcore bear. I'm not going to fight the charts, as Carl would say; instead, I will listen more closely. I still believe we are in for a correction very soon. Take a peek at the Sector CandleGlance (below the sector signal table) and you'll see the momentum (PMO) failing on most of them. All of the PMOs are currently overbought.
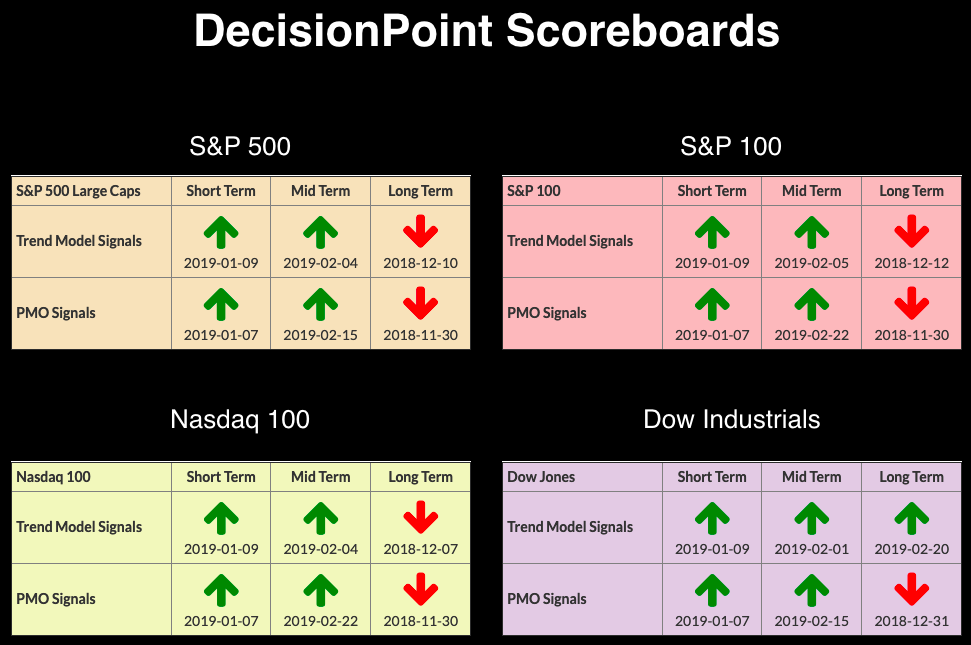
The DecisionPoint Alert presents a mid-week assessment of the trend and condition of the stock market (S&P 500), the U.S. Dollar, Gold, Crude Oil and Bonds.
Watch the latest episode of DecisionPoint on StockCharts TV's YouTube channel here!
SECTORS
Each S&P 500 Index component stock is assigned to one (and only one) of eleven major sectors. This is a snapshot of the Intermediate-Term and Long-Term Trend Model signal status for those sectors.
STOCKS
IT Trend Model: BUY as of 2/1/2019
LT Trend Model: BUY (SPY) as of 2/26/2019
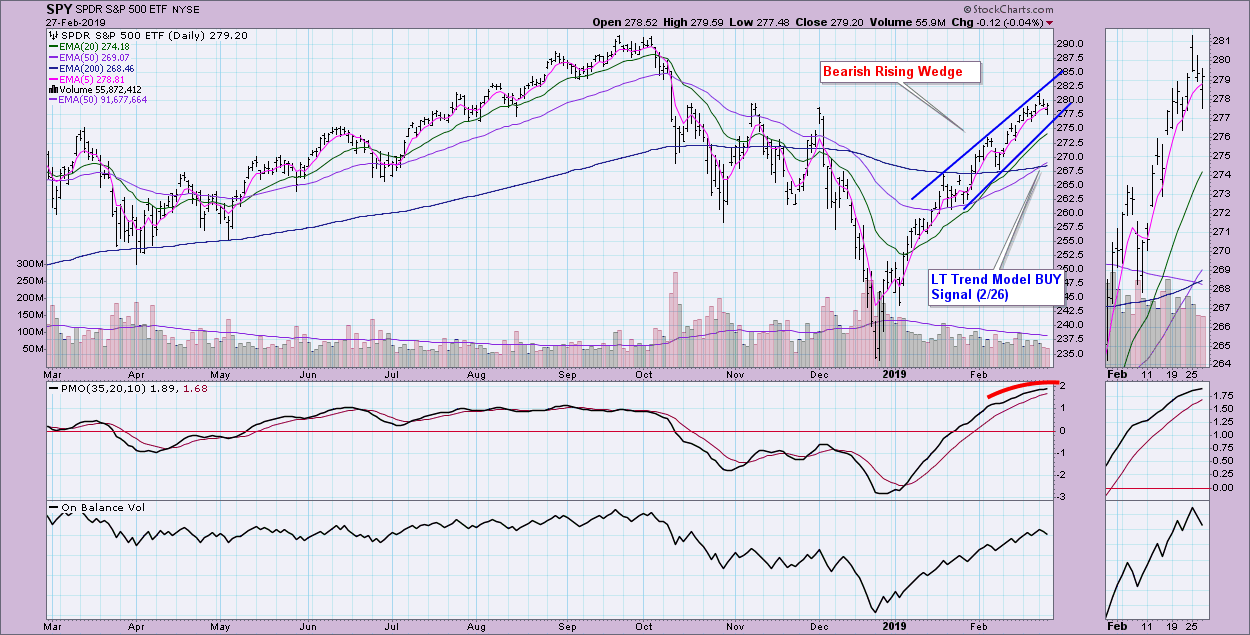
SPY Daily Chart: Below is a look at the new LTTM BUY signal that triggered yesterday. This is good news, however, given that the market, as I noted in the sector CandleGlance above, is very overbought. Additionally, I see a bearish rising wedge and a PMO that is turning over as well. I'm looking for a corrective move down to at least the 200-EMA.
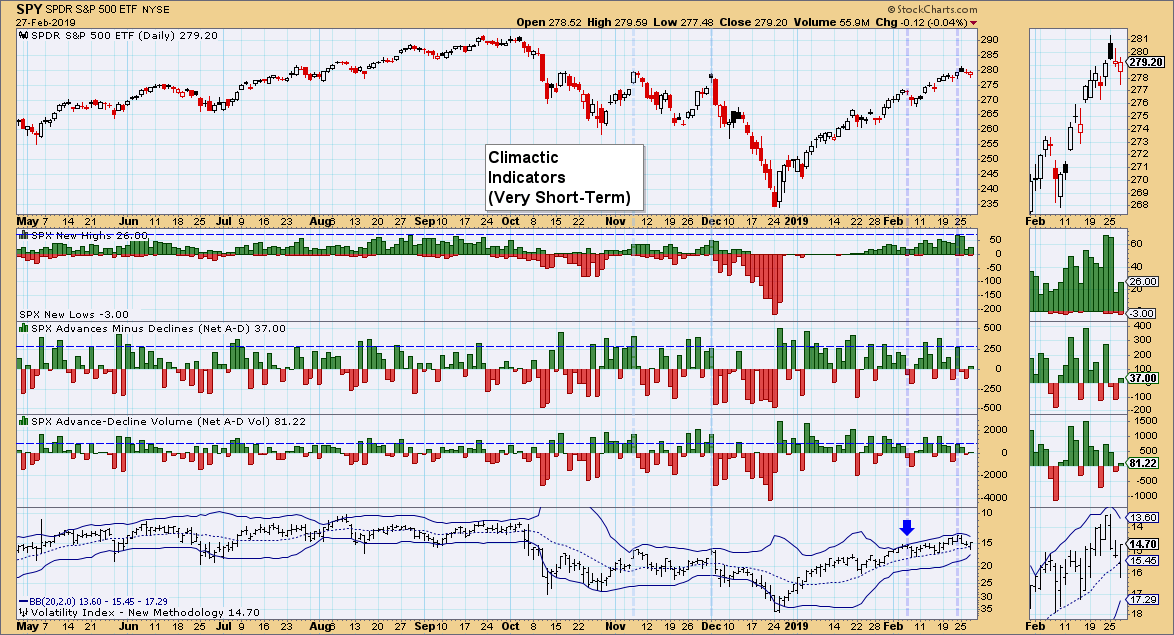
Climactic Market Indicators: Nothing really climactic here. The VIX began to turn, which coincided with yesterday and today's declines.
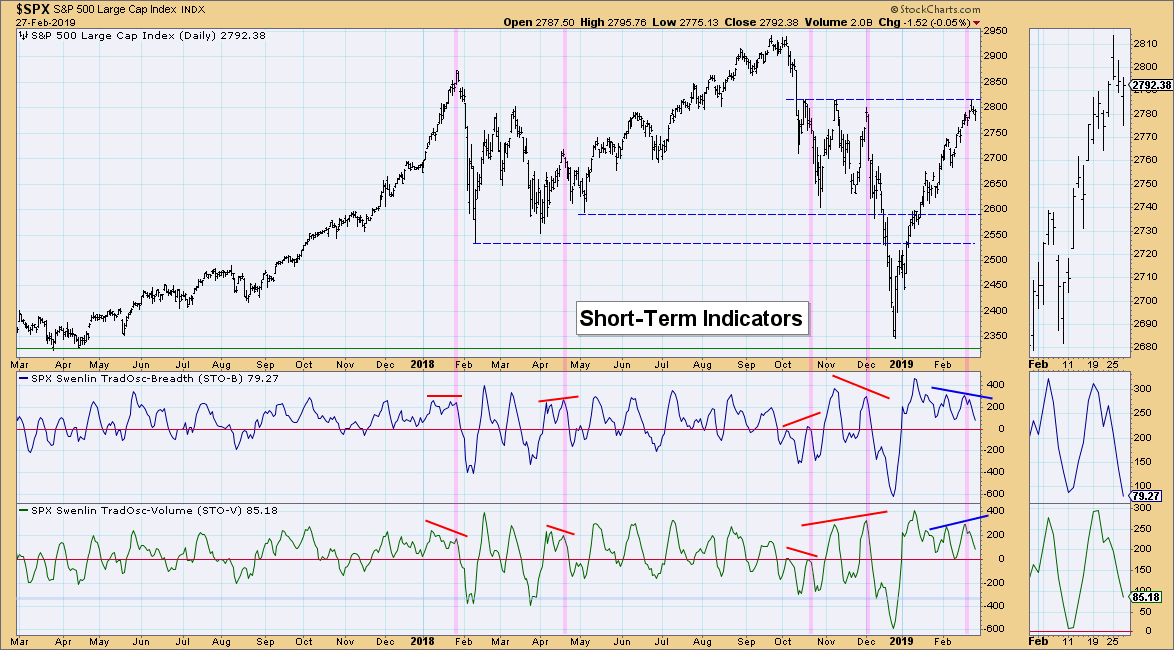
Short-Term Market Indicators: Carl pointed out in the DP Weekly Wrap that, when we see divergences between the indicators, it is time to investigate further. These divergences rarely occur; in fact, we didn't even notice them until after the big correction in January. I started to look out for them after that, though. After divergences like these, something big tends to happen and it happens towards the downside.
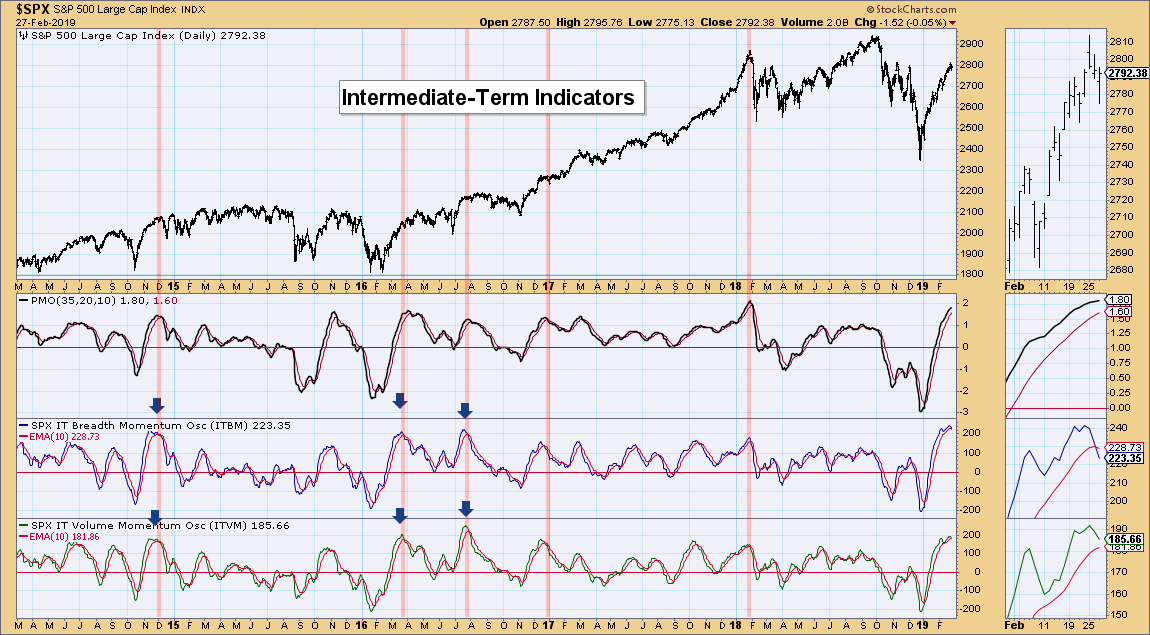
Intermediate-Term Market Indicators: We got our first negative crossover on the ITBM, while the ITVM appears bound for one of its own. This is very bearish, especially when it happens in extremely overbought territory.
Conclusion: While I've softened my very bearish stance (I doubt we will test December lows; even if we do, that will be a bottom), the indicators are suggesting a decline or, more likely, a correction. Caution is warranted.
DOLLAR (UUP)
IT Trend Model: BUY as of 2/7/2019
LT Trend Model: BUY as of 5/25/2018
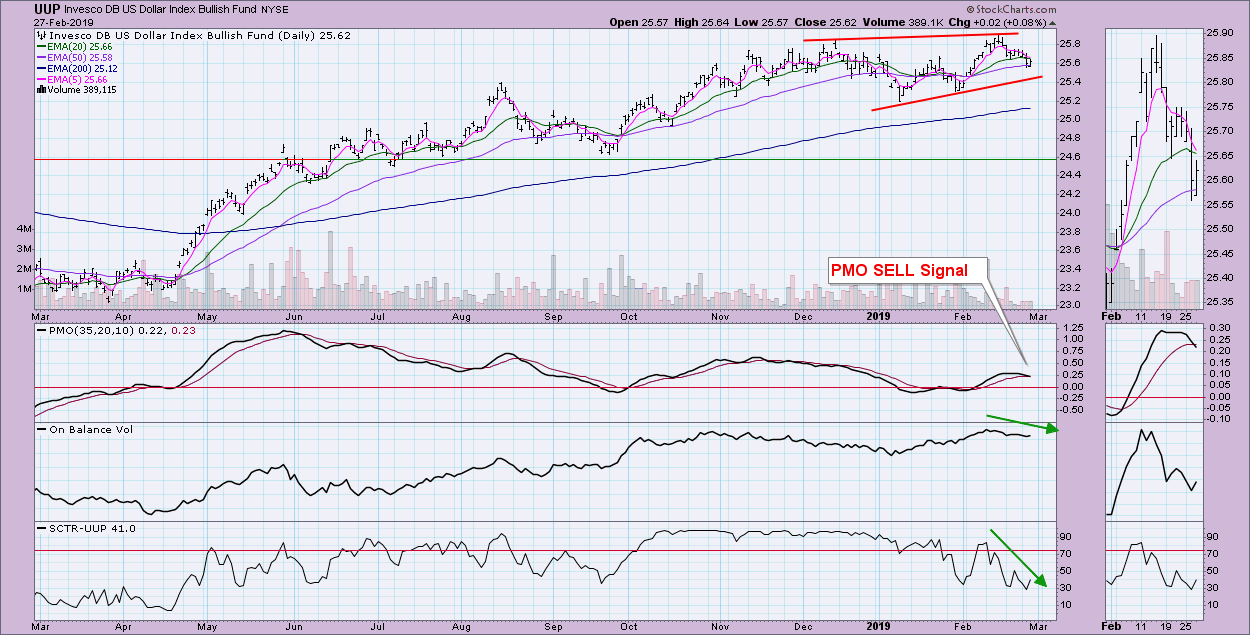
UUP Daily Chart: The Dollar is technically in a rising trend, but holders of UUP have probably not been feeling that since mid-February. The PMO had a negative crossover; its signal line triggered today's SELL signal. I see a gently rising bearish wedge. To sum up, all this implies a breakdown out of the rising trend, at least in the short term.
GOLD
IT Trend Model: BUY as of 10/19/2018
LT Trend Model: BUY as of 1/8/2019
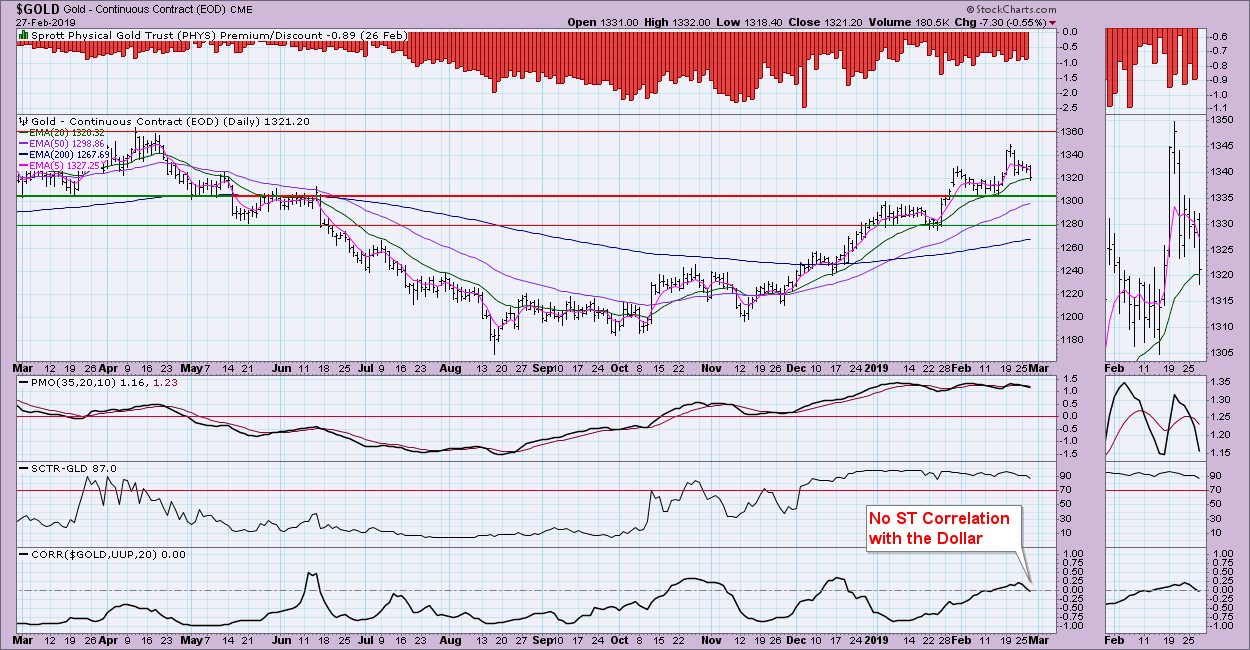
GOLD Daily Chart: Generally, a falling Dollar is good for Gold, but you'll note the short-term correlation is equal to zero. Right now, they are technically independent of each other. In fact, you can even see that Gold is in a short-term decline, just like the Dollar above. Discounts remain high, which shows bearish sentiment. Typically, this leads to a rally, but these rates have remained at the level for quite some time. The PMO is really bothering me on Gold. Price action isn't that horrible as we are still in a nice rising trend. I'm looking for Gold to test the 1300 level and then make another attempt at 1360.
CRUDE OIL (USO)
IT Trend Model: Neutral as of 10/29/2018
LT Trend Model: SELL as of 11/23/2018
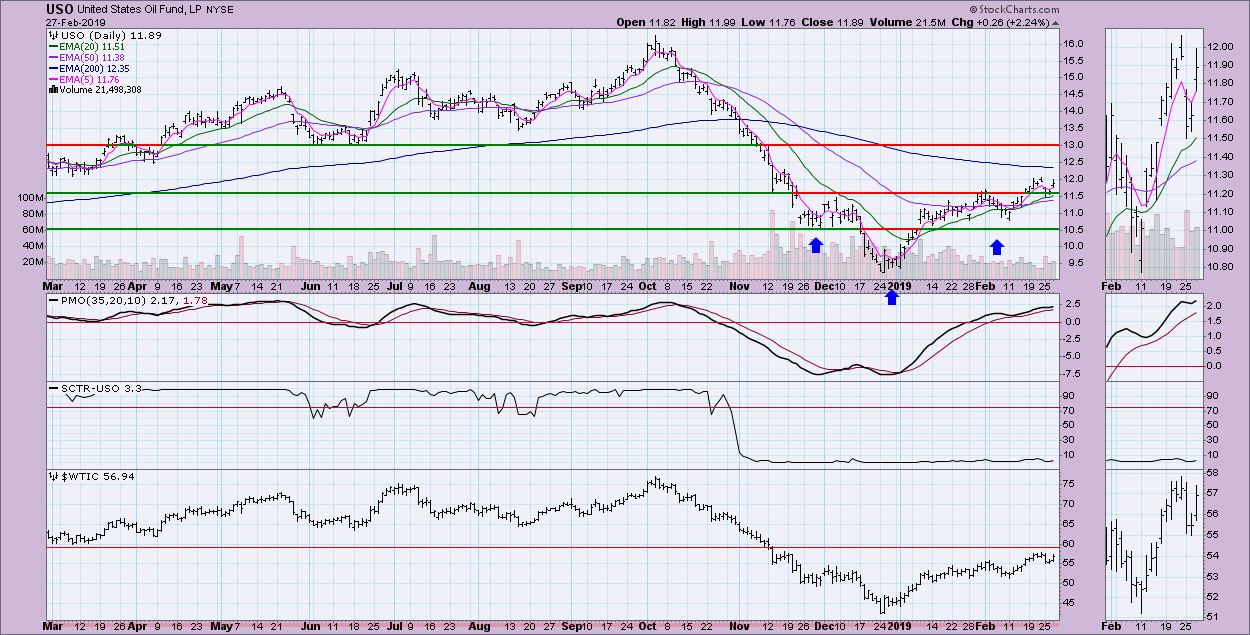
USO Daily Chart: I believe we're seeing the execution of an inverse head and shoulders. It's not textbook, but I think it is valid nonetheless. The PMO has turned up above its signal line. It's somewhat overbought, but you can see that the range can stretch, just as it stretched lower at the end of last year. I think $13 seems like a reasonable target.
BONDS (TLT)
IT Trend Model: BUY as of 12/6/2018
LT Trend Model: BUY as of 1/2/2019
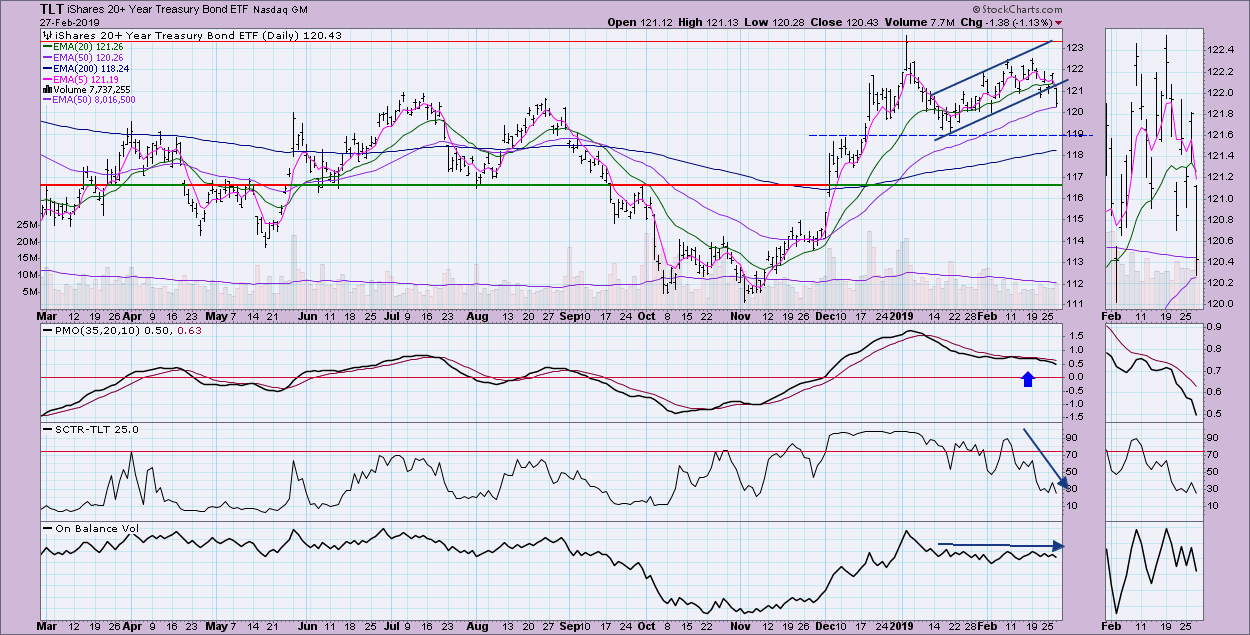
TLT Daily Chart: Despite traveling in a rising trend channel, the PMO, OBV and SCTR all were moving lower, suggesting a problem. The problem happened today with the big breakdown. Price did stop along the 50-EMA, but with such negative indicators, I doubt it will hold. $119 is more likely.
Technical Analysis is a windsock, not a crystal ball.
Happy Charting!
- Erin
**Don't miss any of the DecisionPoint commentaries! Go to the "Notify Me" box toward the end of this blog page to be notified as soon as they are published.**
NOTE: The signal status reported herein is based upon mechanical trading model signals, specifically, the DecisionPoint Trend Model. They define the implied bias of the price index based upon moving average relationships, but they do not necessarily call for a specific action. They are information flags that should prompt chart review. Further, they do not call for continuous buying or selling during the life of the signal. For example, a BUY signal will probably (but not necessarily) return the best results if action is taken soon after the signal is generated. Additional opportunities for buying may be found as price zigzags higher, but the trader must look for optimum entry points. Conversely, exit points to preserve gains (or minimize losses) may be evident before the model mechanically closes the signal.
Helpful DecisionPoint Links:
DecisionPoint Shared ChartList and DecisionPoint Chart Gallery
Price Momentum Oscillator (PMO)
Swenlin Trading Oscillators (STO-B and STO-V)

