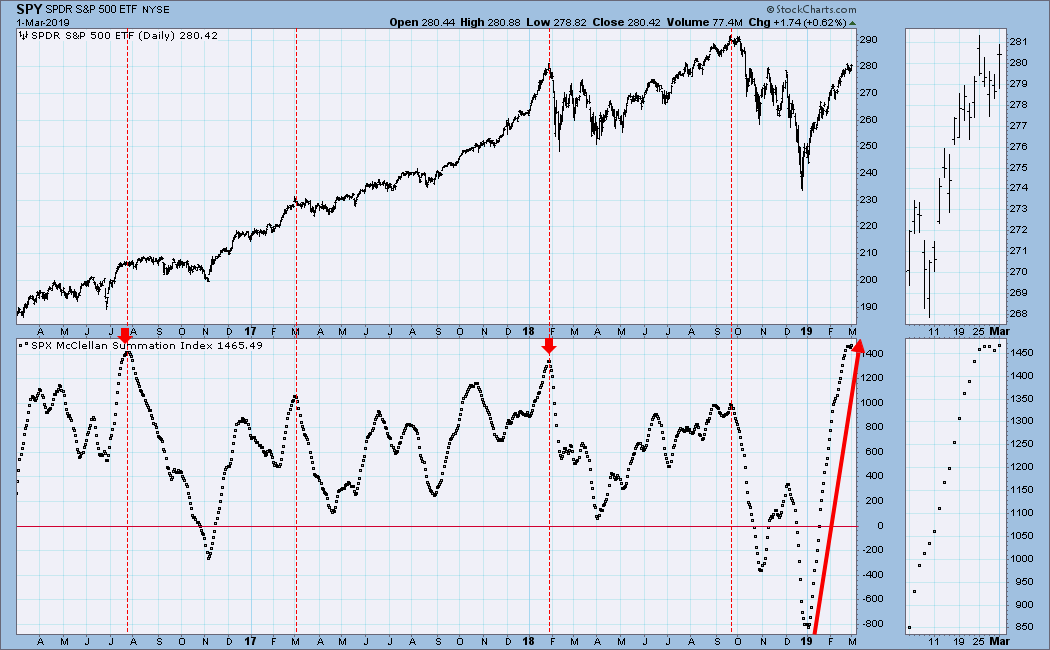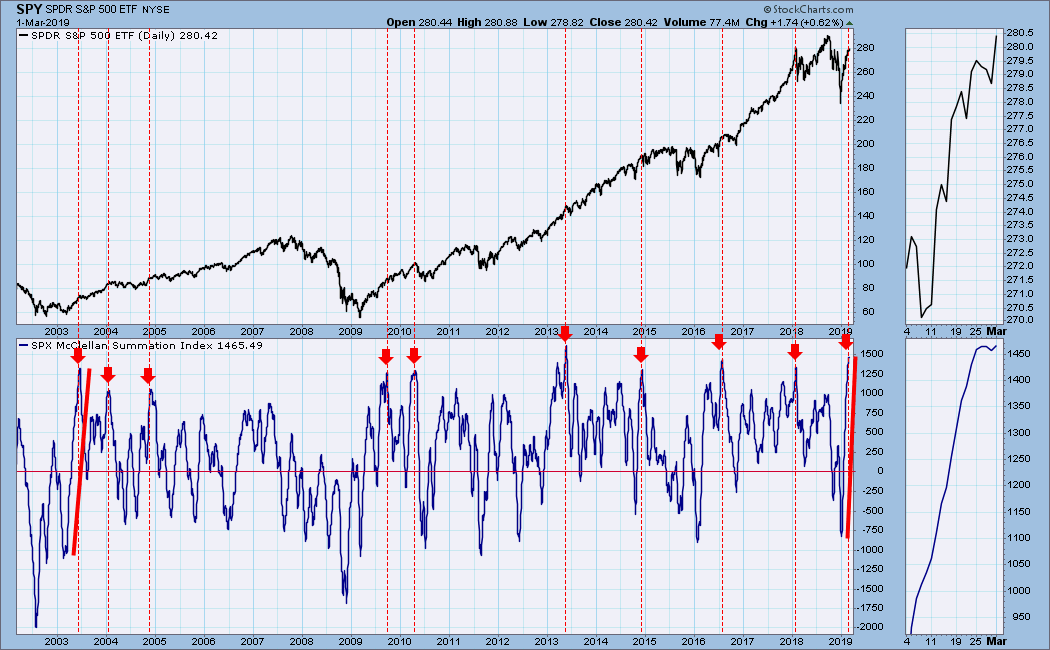
The McClellan Summation Index (ratio-adjusted version) has had the longest uninterrupted upside run since 2003, when the market was coming up off of the 2000-2002 bear market lows. The indicator is very overbought and it is trying to top, so we should expect some kind of corrective action over the next several weeks.
When I say "some kind" of corrective action, I'm thinking along the lines of a move down to test the December lows, but if we look on the chart below at what happened in 2003, it may not be any worse than several weeks of consolidation. Looking at market action after other Summation Index extreme tops, we might conclude that in a bull market "overbought" is not such a big deal, but it is still a warning of vulnerability.
The DecisionPoint Weekly Wrap presents an end-of-week assessment of the trend and condition of the stock market (S&P 500), the U.S. Dollar, Gold, Crude Oil, and Bonds.
Watch the latest episode of DecisionPoint on StockCharts TV's YouTube channel here!
SECTORS
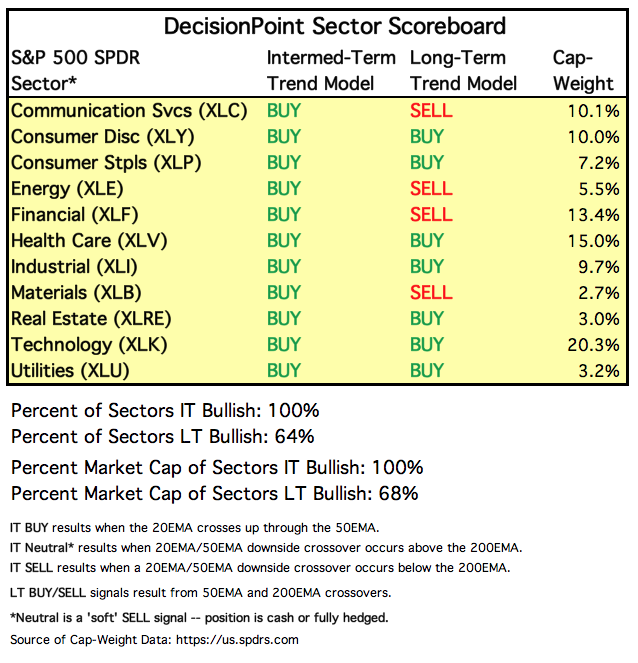
Each S&P 500 Index component stock is assigned to one, and only one, of 11 major sectors. This is a snapshot of the Intermediate-Term and Long-Term Trend Model signal status for those sectors.
STOCKS
IT Trend Model: BUY as of 2/1/2019
LT Trend Model: BUY as of 2/26/2019
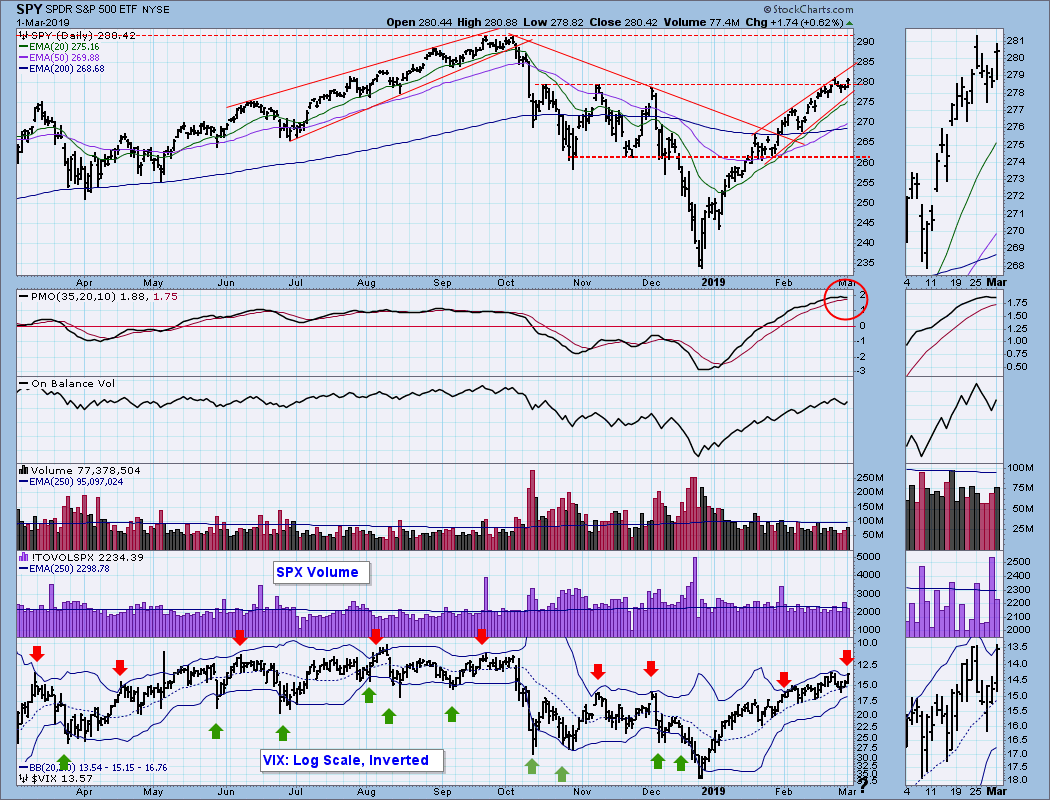
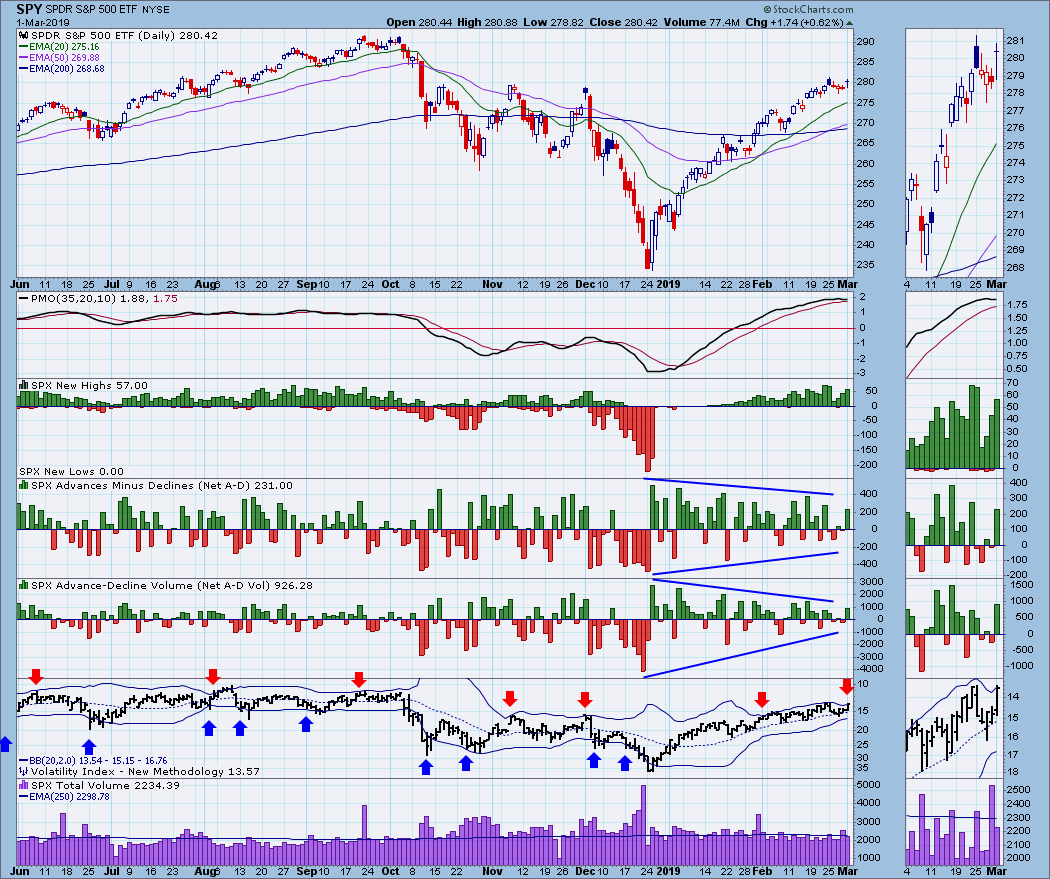
SPY Daily Chart: The daily PMO topped on Thursday, but turned back up Friday. Nevertheless it is very overbought and in a topping mode. The VIX penetrated the top Bollinger Band, and a price top will likely follow. Note that Friday's pop was on contracting volume.
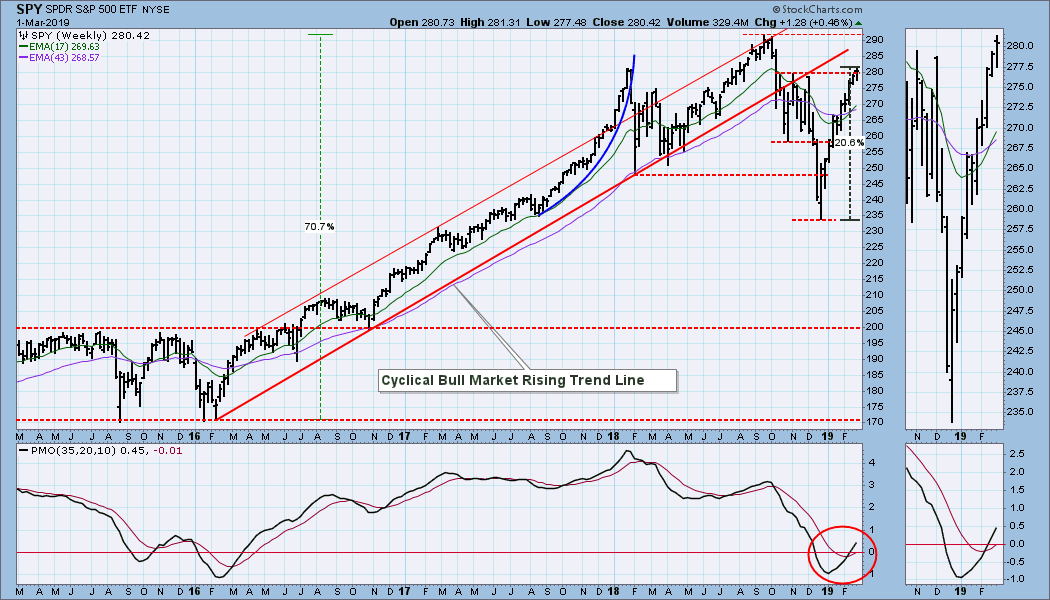
SPY Weekly Chart: This chart looks bullish, except that the market has been advancing for 10 weeks without a pullback.
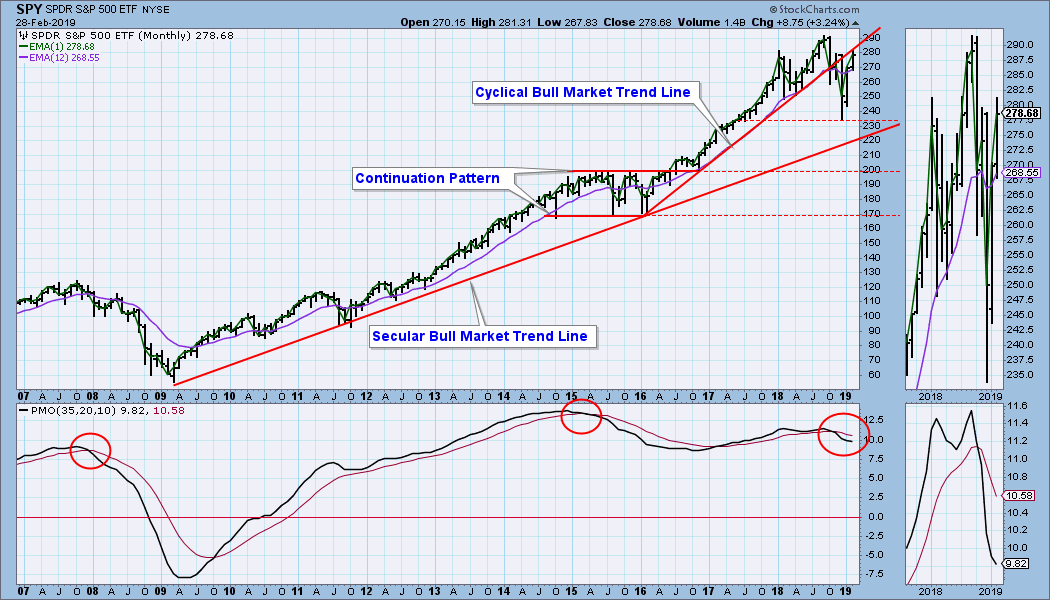
SPY Monthly Chart: At the end of February SPY had rallied back to the cyclical bull market rising trend line. The monthly PMO had decelerated, but it is still below the signal line and falling.
Climactic Market Indicators: Breadth, volume and new highs are fading.
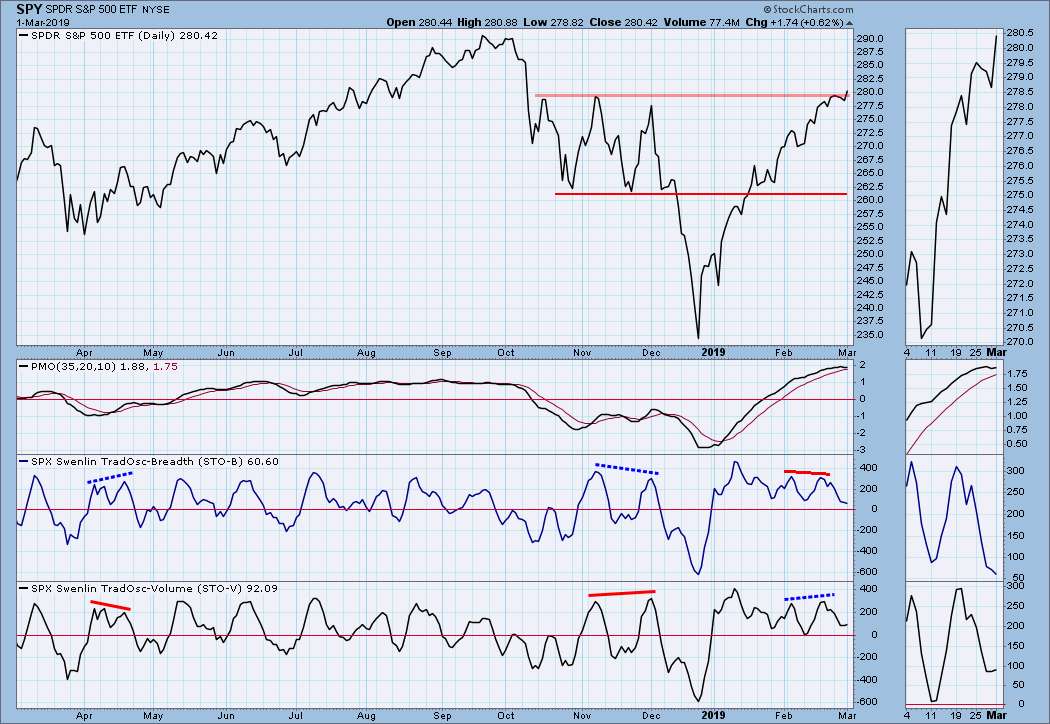
Short-Term Market Indicators: The STO-B and STO-V are at the bottom of a two-month range.
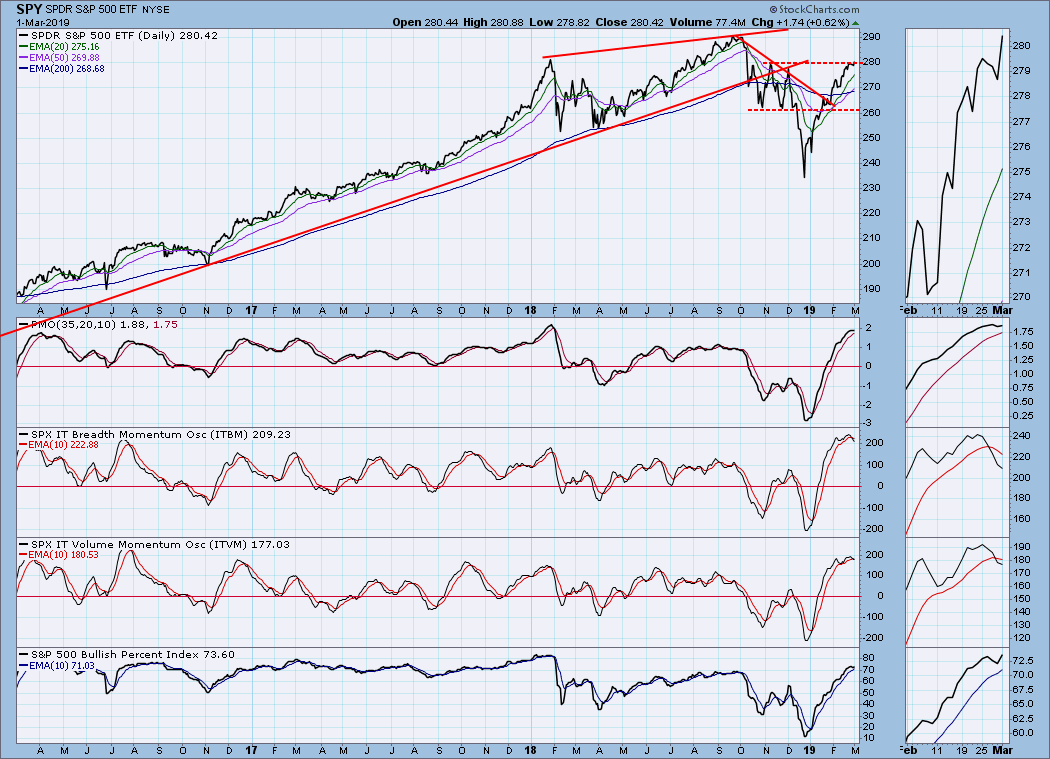
Intermediate-Term Market Indicators: The ITBM and ITVM have topped and are below their signal lines.
CONCLUSION: The market is very overbought and vulnerable to corrective action, although that action may be no more that an extended consolidation. Except for the monthly PMO, which may take some time to catch up, indicators are saying "bull market," but the overbought condition makes this a poor time to open new longs.
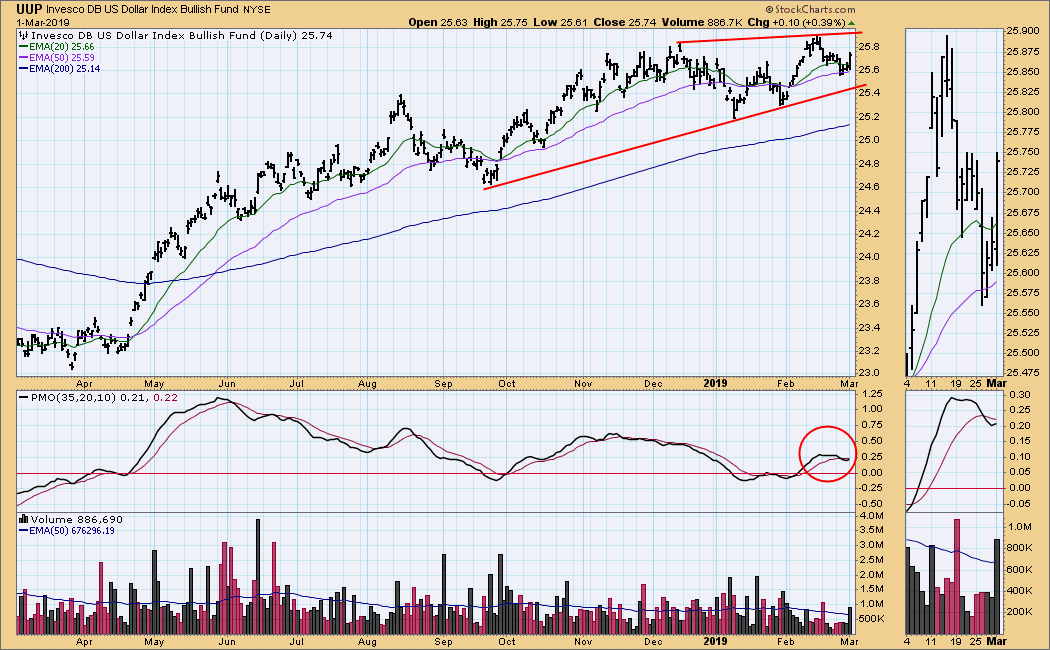
DOLLAR (UUP)
IT Trend Model: BUY as of 2/7/2019
LT Trend Model: BUY as of 5/25/2018
UUP Daily Chart: The dollar showed unexpected strength on Friday, enough to turn the daily PMO back up.
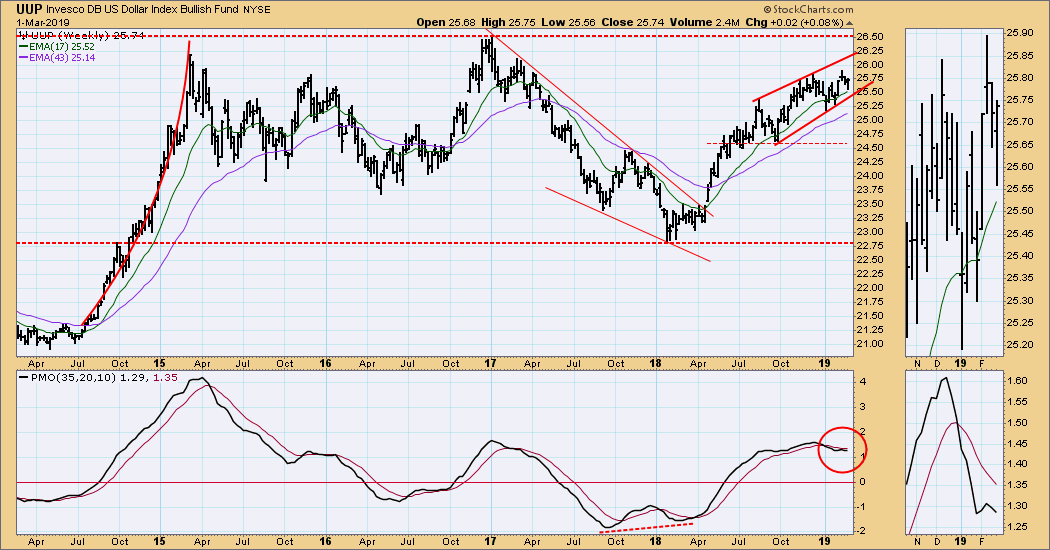
UUP Weekly Chart: In this time frame, Friday's rally wasn't enough, and the weekly PMO turned down.
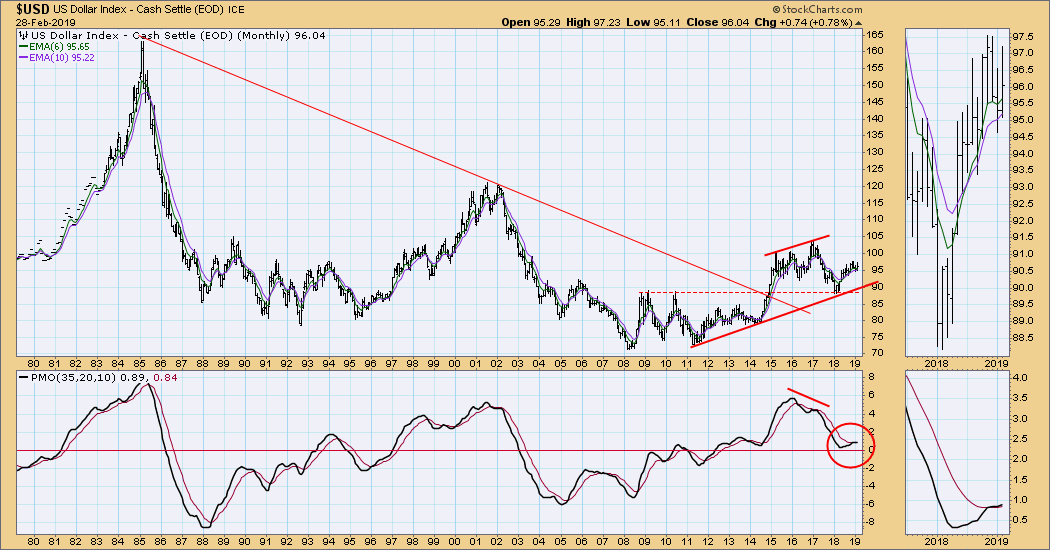
USD Monthly Chart: The monthly PMO is rising slightly, reflecting modest strength in this time frame.
GOLD
IT Trend Model: BUY as of 10/19/2018
LT Trend Model: BUY as of 1/8/2019
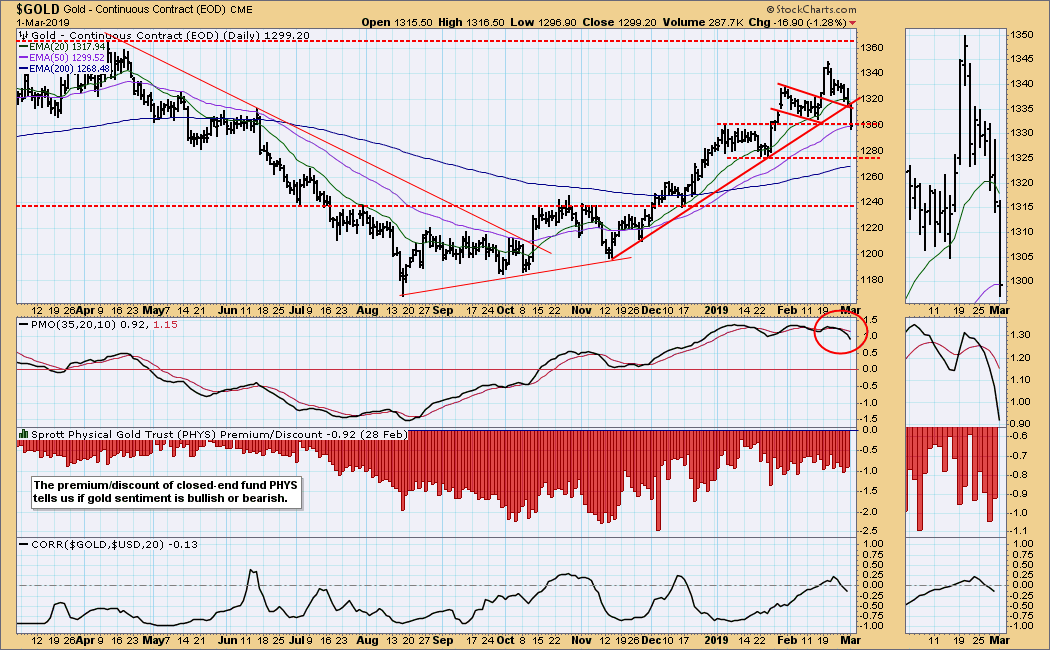
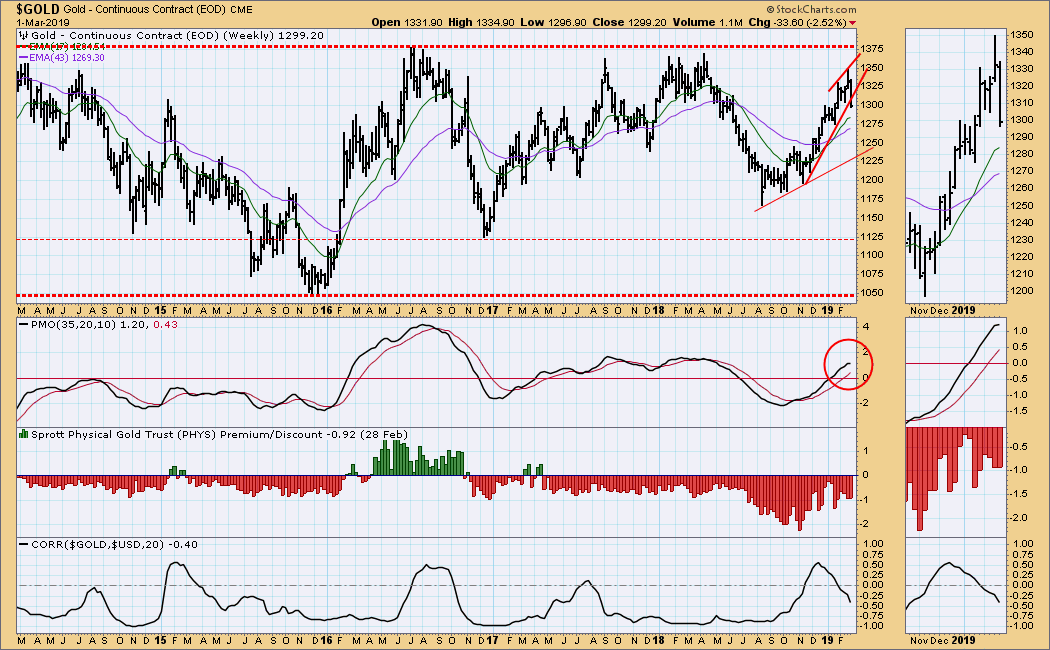
GOLD Daily Chart: Gold has been doing fairly well since the August 2018 low, but Friday's decline kind of puts my teeth on edge. The congestion from the consolidation pattern in January is currently a source of support.
GOLD Weekly Chart: The rising wedge pattern proved reliable once again, as price broke down this week. The weekly PMO is trying to top
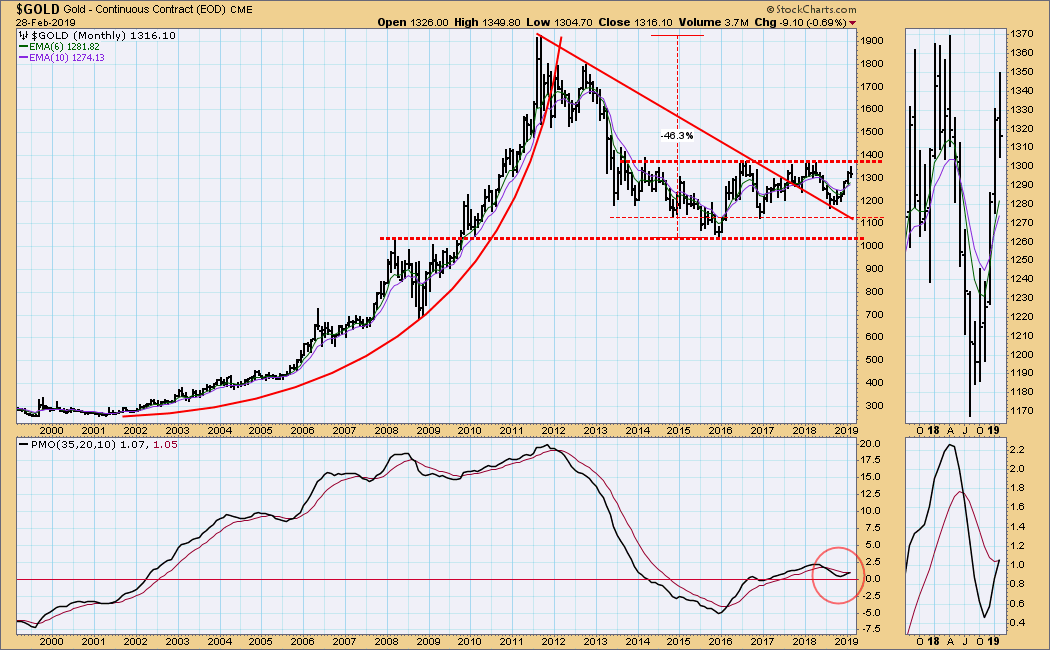
GOLD Monthly Chart: Gold is in the top of a five-year trading range. The monthly PMO is rising and has closed above the signal line.
CRUDE OIL (USO)
IT Trend Model: BUY as of 2/19/2019
LT Trend Model: SELL as of 11/23/2018
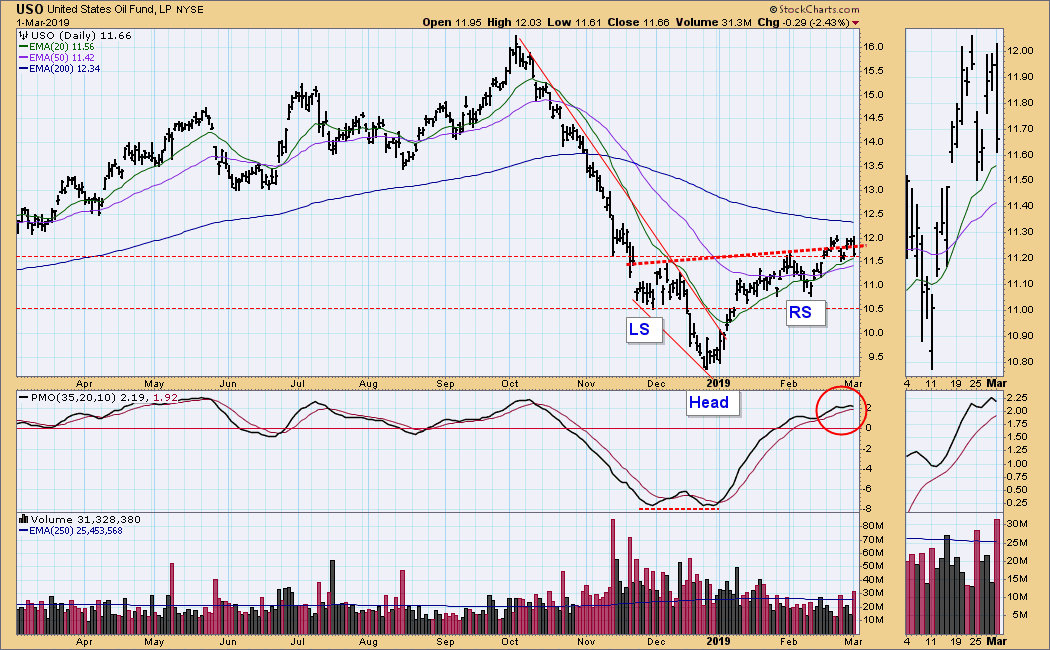
USO Daily Chart: Last week we saw USO break above the neckline of a reverse head and shoulders pattern. This week USO chopped around that line, putting the head and shoulders in question. Perhaps more relevant, price has remained above the line of horizontal support that is just below the neckline.
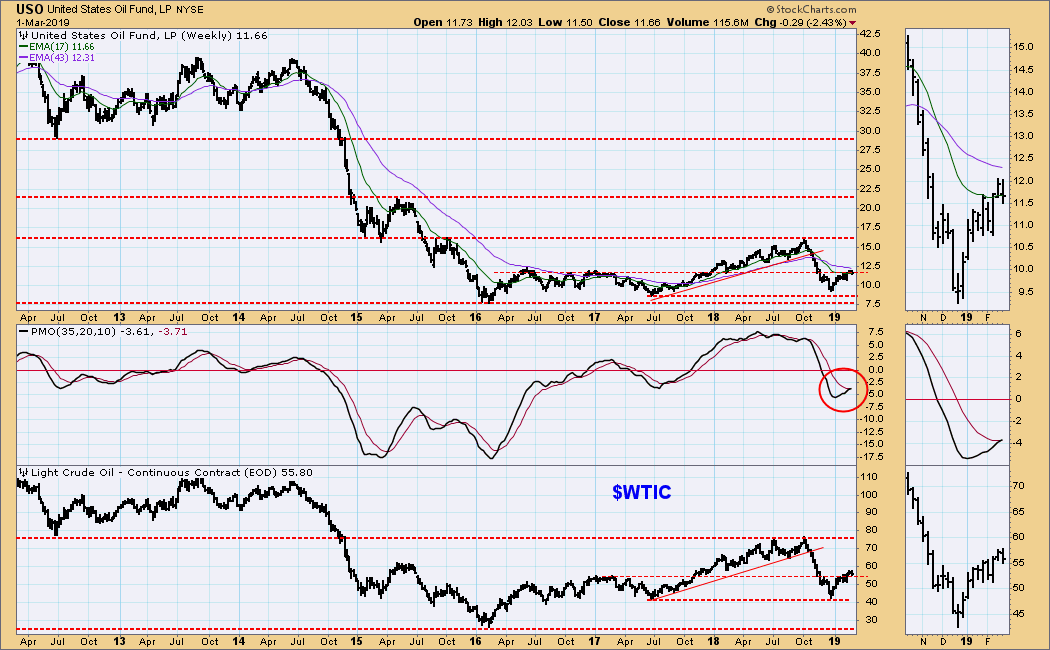
USO Weekly Chart: Crude ($WTIC) is moving up in a trading range of 42 to 76. The weekly PMO crossed above the signal line this week.
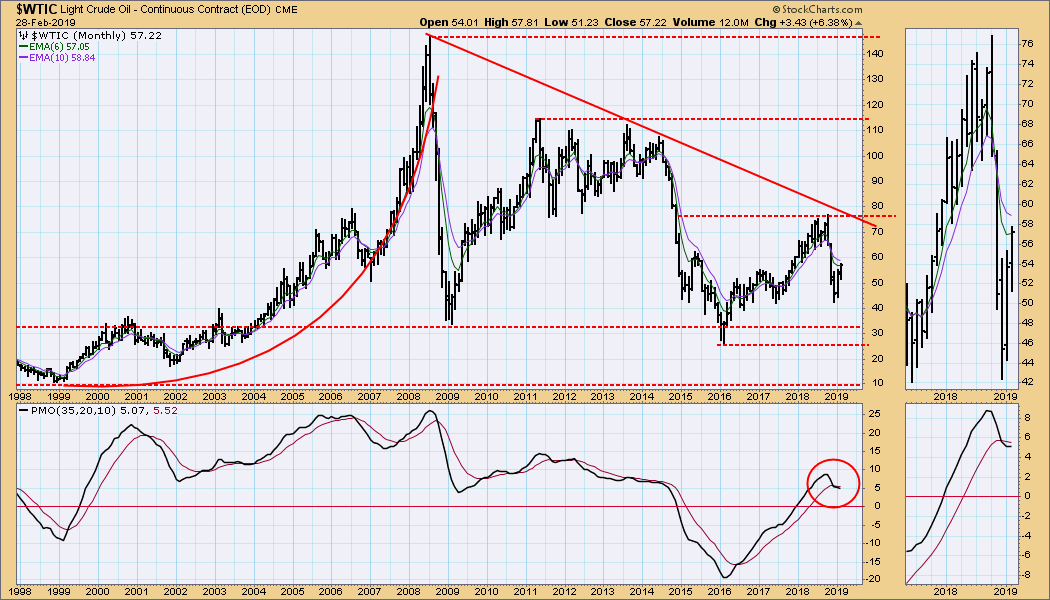
WTIC Monthly Chart: Generally, a negative picture with lower tops from the 2008 top, and the monthly PMO is below the signal line.
BONDS (TLT)
IT Trend Model: BUY as of 12/6/2018
LT Trend Model: BUY as of 1/2/2019
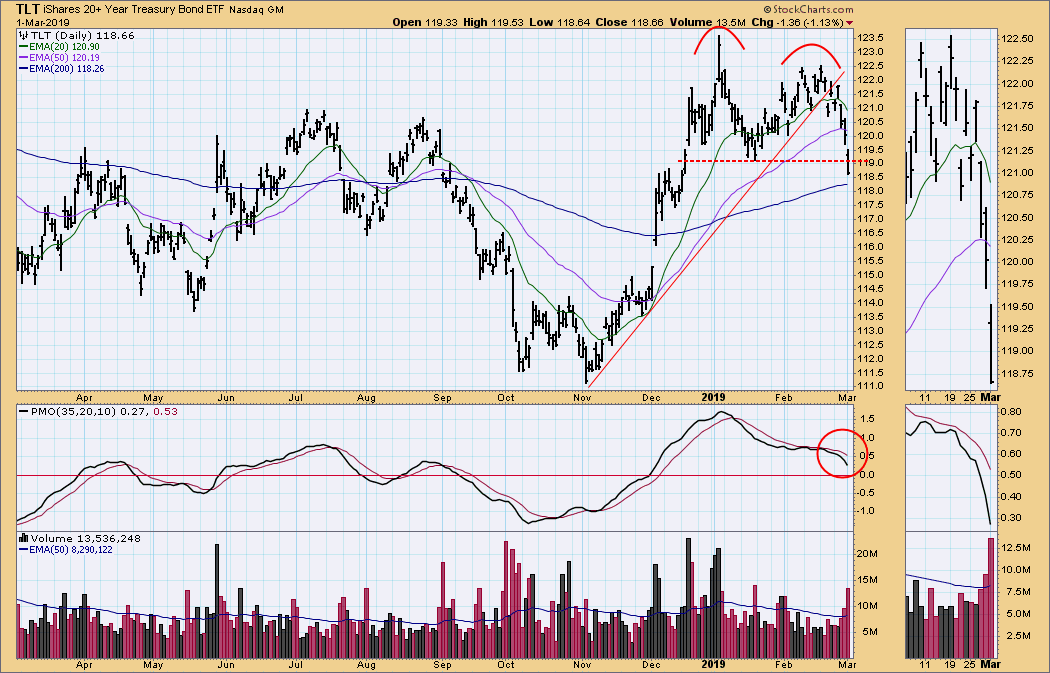
TLT Daily Chart: It would appear that the rally that followed the shift in Fed policy is over. We can see an Adam and Eve double top has executed as price broke down through the confirmation line.
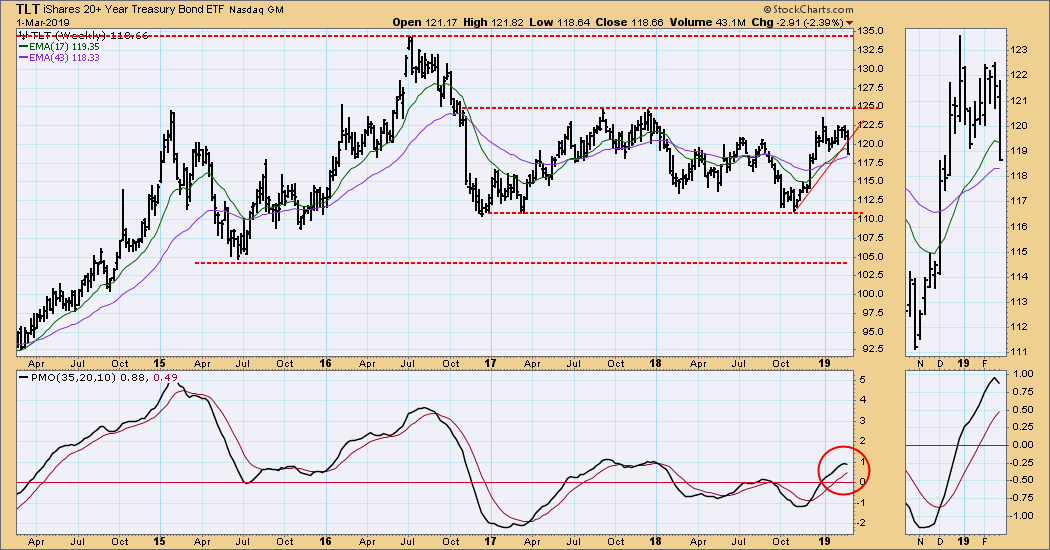
TLT Weekly Chart: A rising trend line has been broken and the weekly PMO has topped. Note that the rally failed prior to price reaching the top of the two-year trading range, a show of weakness. Expecting the bottom of the range to be tested next.
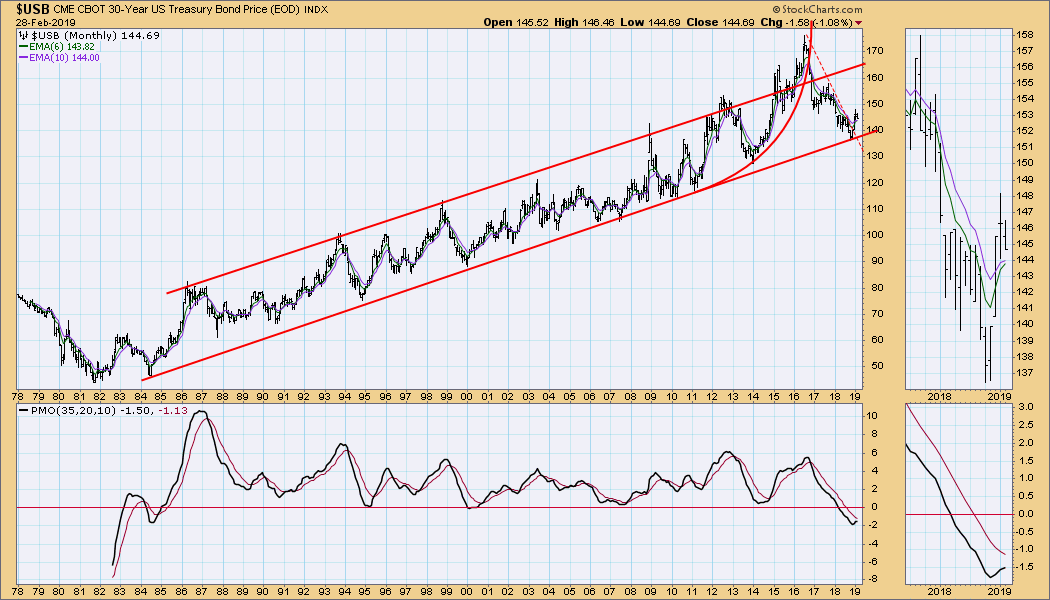
USB Monthly Chart: Bonds had a bounce off the bottom of the decades-long rising trend channel, causing the monthly PMO to bottom, but now it seems to be topping below the signal line. It may take a few months, but I think the trend line will be challenged again.
**Don't miss any of the DecisionPoint commentaries! Go to the "Notify Me" box toward the end of this blog page to be notified as soon as they are published.**
Technical Analysis is a windsock, not a crystal ball.
Happy Charting!
- Carl
NOTE: The signal status reported herein is based upon mechanical trading model signals, specifically, the DecisionPoint Trend Model. They define the implied bias of the price index based upon moving average relationships, but they do not necessarily call for a specific action. They are information flags that should prompt chart review. Further, they do not call for continuous buying or selling during the life of the signal. For example, a BUY signal will probably (but not necessarily) return the best results if action is taken soon after the signal is generated. Additional opportunities for buying may be found as price zigzags higher, but the trader must look for optimum entry points. Conversely, exit points to preserve gains (or minimize losses) may be evident before the model mechanically closes the signal.
Helpful DecisionPoint Links:
DecisionPoint Shared ChartList and DecisionPoint Chart Gallery
Price Momentum Oscillator (PMO)
Swenlin Trading Oscillators (STO-B and STO-V)

