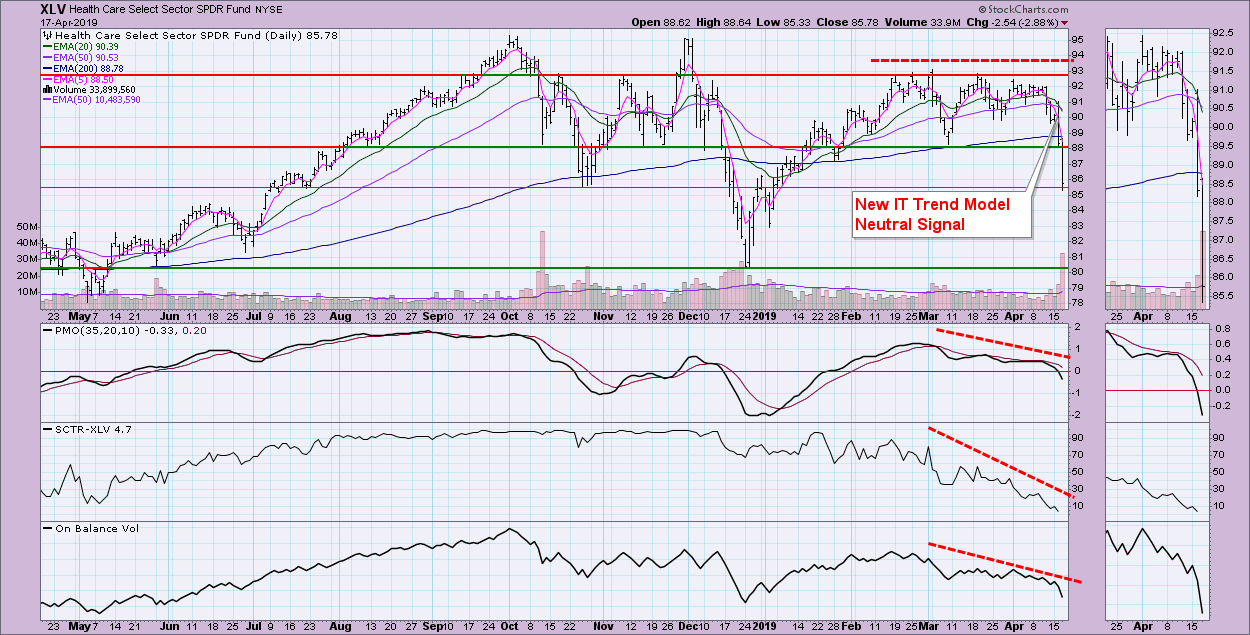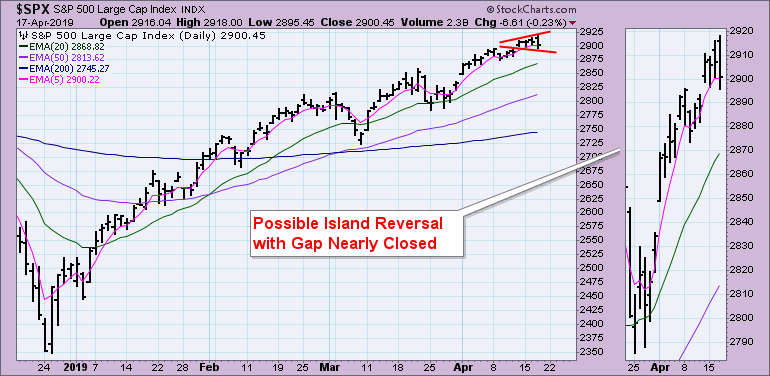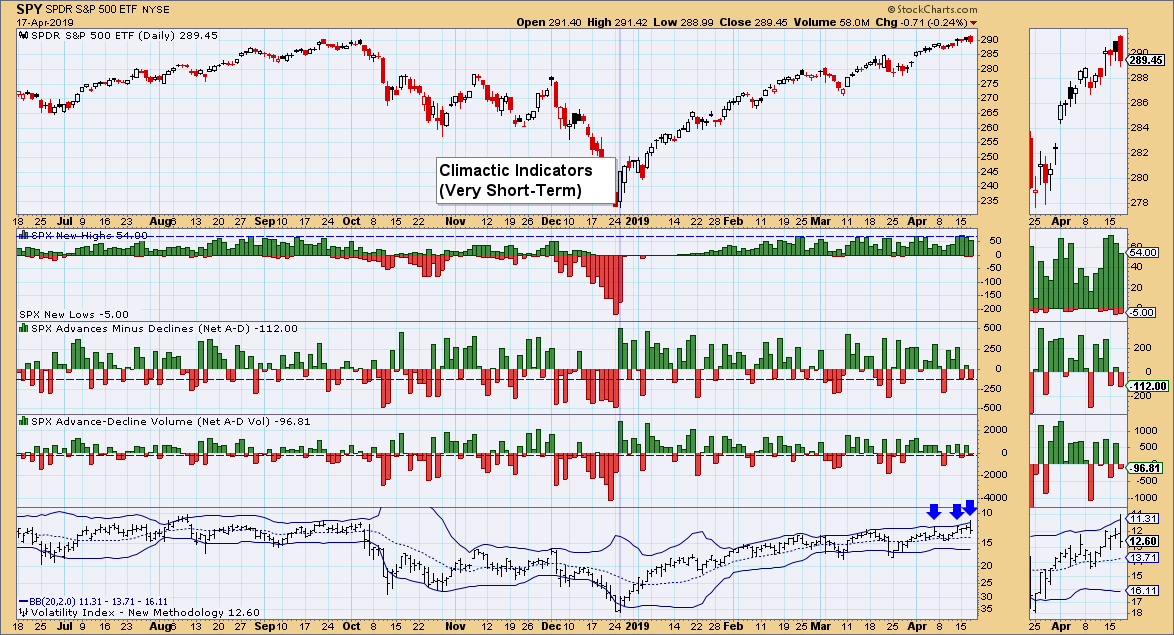
 At this point in the week, the SPX is down about 0.23%. I suspect there will be more downside to endure going into the last half of the week. We don't talk about broadening patterns too much, but, in the very short-term, those are what I'm seeing on the SPX and they typically resolve downward. The VIX is now suggesting a buying exhaustion lining up as well. The good news is that the defensive Health Care Sector ETF (XLV) did trigger an IT Trend Model Neutral signal. I'd prefer everyone pitch in on a rally to new all-time highs, but if I'm going to lose a BUY signal, I'd rather it be in a defensive area of the market.
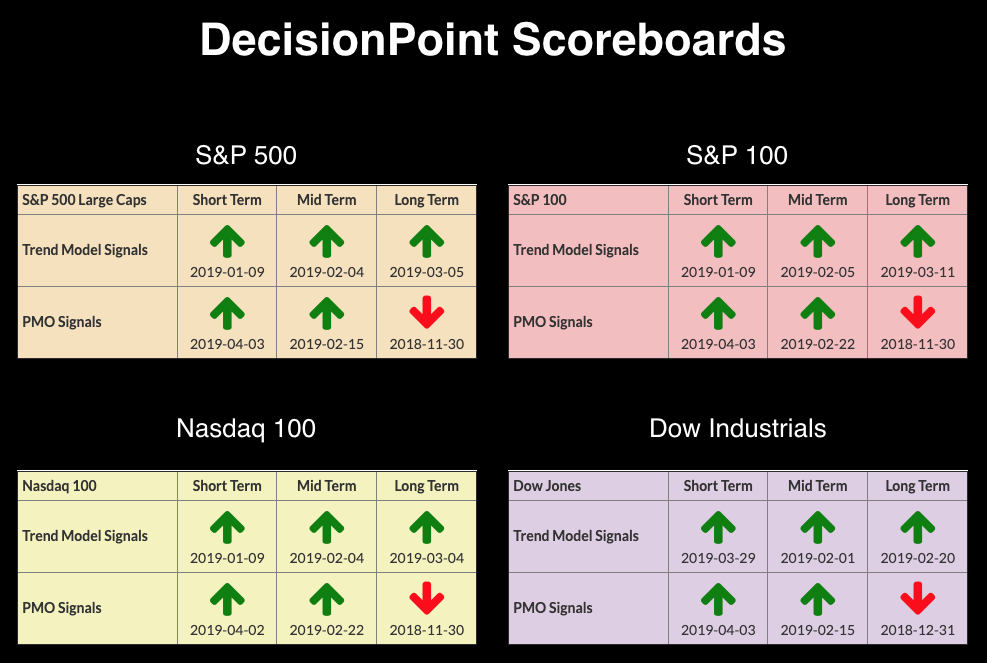
The DecisionPoint Alert presents a mid-week assessment of the trend and condition of the stock market (S&P 500), the U.S. Dollar, Gold, Crude Oil and Bonds.
Watch the latest episode of DecisionPoint on StockCharts TV's YouTube channel here!
SECTORS
Each S&P 500 Index component stock is assigned to one, and only one, of eleven major sectors. This is a snapshot of the Intermediate-Term and Long-Term Trend Model signal status for those sectors.
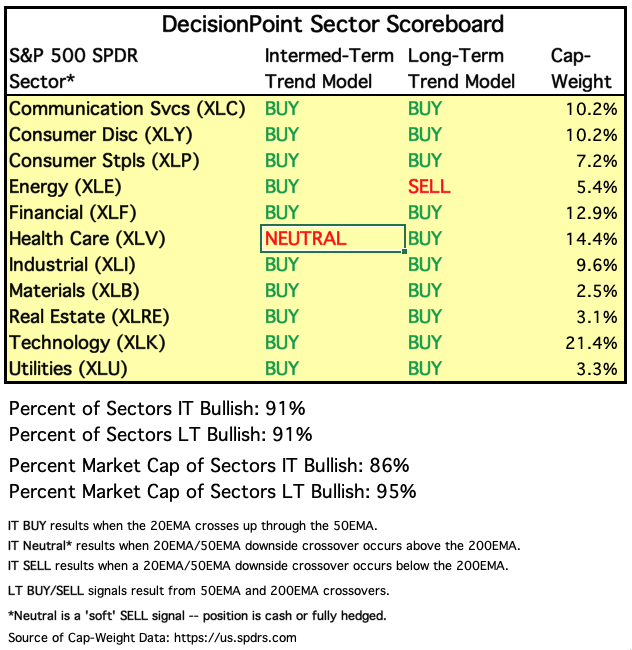
The daily chart of XLV shows the 20-EMA crossing below the 50-EMA. This is what triggered the IT Trend Model Neutral signal. It is a neutral signal because the crossover occurred above the 200-EMA. We don't go to a full SELL or short position when the 50-EMA is above the 200-EMA; we use "neutral" to mean fully hedged or in cash. Of course, looking at the chart, I imagine all of us wish we had shorted this sector. Price had tested support yesterday at the March low (which coincides with plenty of lows in October and November). Not only did it not hold today, though, it broke down all the way down to the October low! Next stop: the December low. This sector was already beginning to show signs of fatigue, given all of the negative divergences with price.
STOCKS
IT Trend Model: BUY as of 2/1/2019
LT Trend Model: BUY (SPY) as of 2/26/2019
SPY Daily Chart: I've been watching a bearish rising wedge on the SPX. Price has been bumping against the top of the wedge multiple times. The OBV is rising with price, but, as Carl pointed out last week, the last OBV top has not exceeded the top at the all-time high. This is a reverse divergence in that, if you see volume pushing higher but price isn't doing the same, there might be less voracity in the price move and it could be hard to maintain a rising trend. The good news is that we don't actually have a new price top.
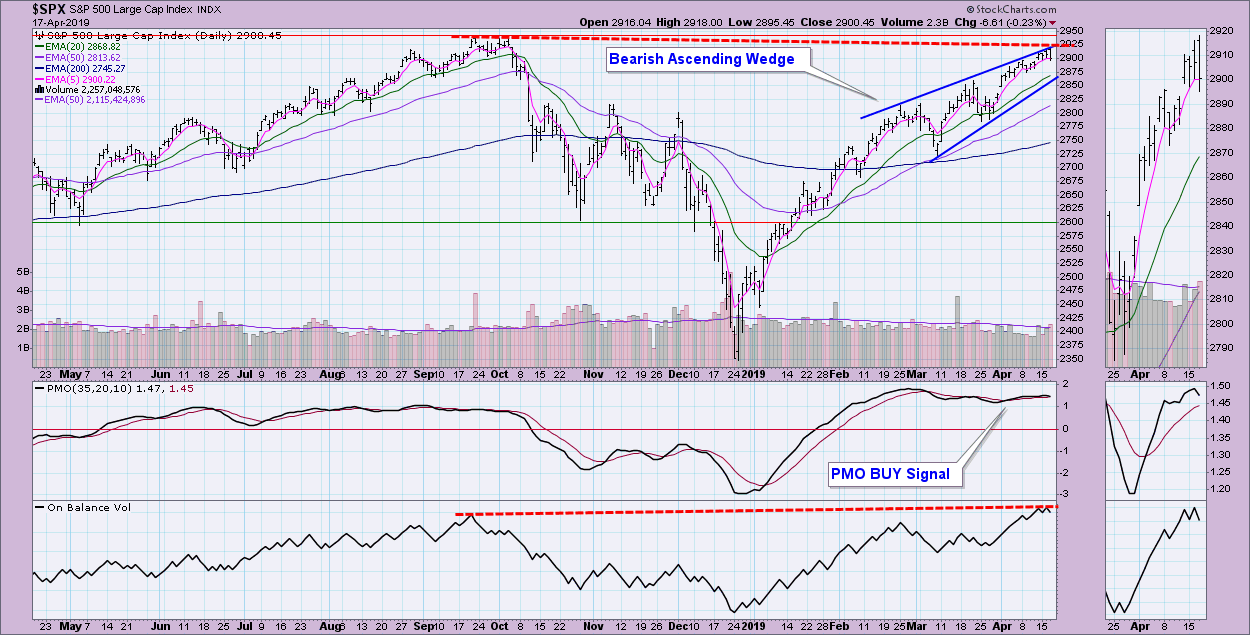 The broadening formation looks like a short-term "horn" shape. Typically, these resolve downward. I also spot a possible island reversal in the thumbnail. Today, price attempted to close the gap, but it did not complete the move. I would look for that gap to close in the next day or two.
Climactic Market Indicators: One of the reasons I believe the SPX will turn lower this week is the deeply complacent readings on the VIX. We didn't see a puncture of the upper Bollinger Band on the prior tests, but today we got it. New Highs are beginning to move lower, but I'm not seeing anything overly climactic.
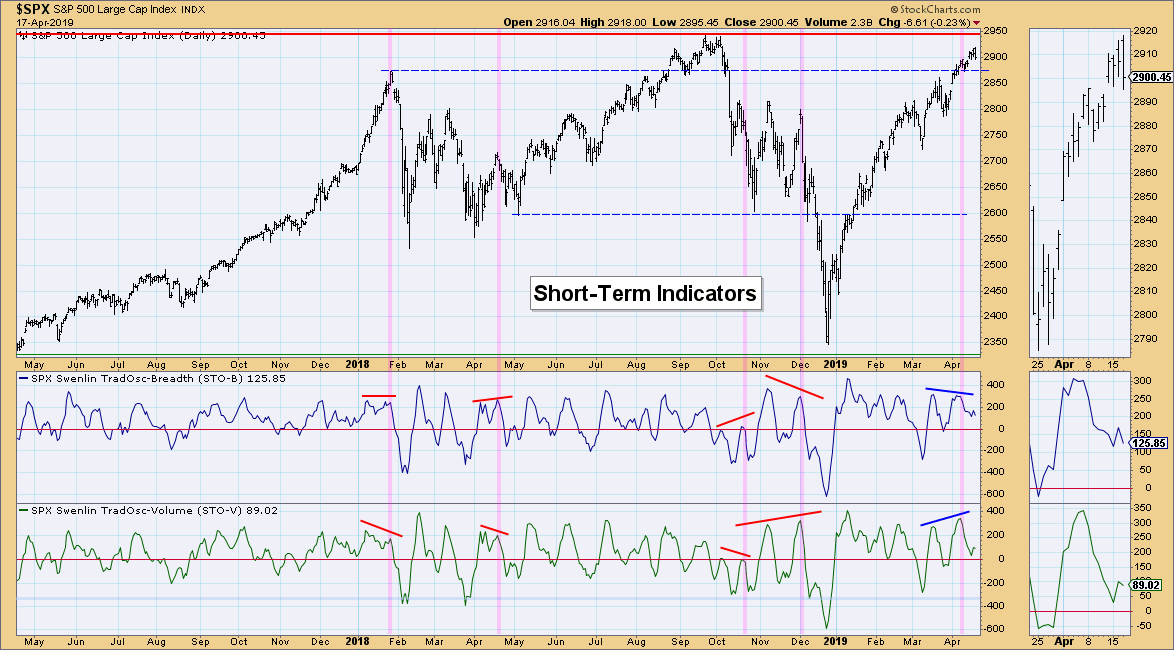
Short-Term Market Indicators: These also suggest a decline ahead. Although they have been hesitating, they are in a declining trend and are reaching bull market oversold just above the zero line. That said, I wouldn't count on that to hold, as these indicators can certainly accommodate more downside.
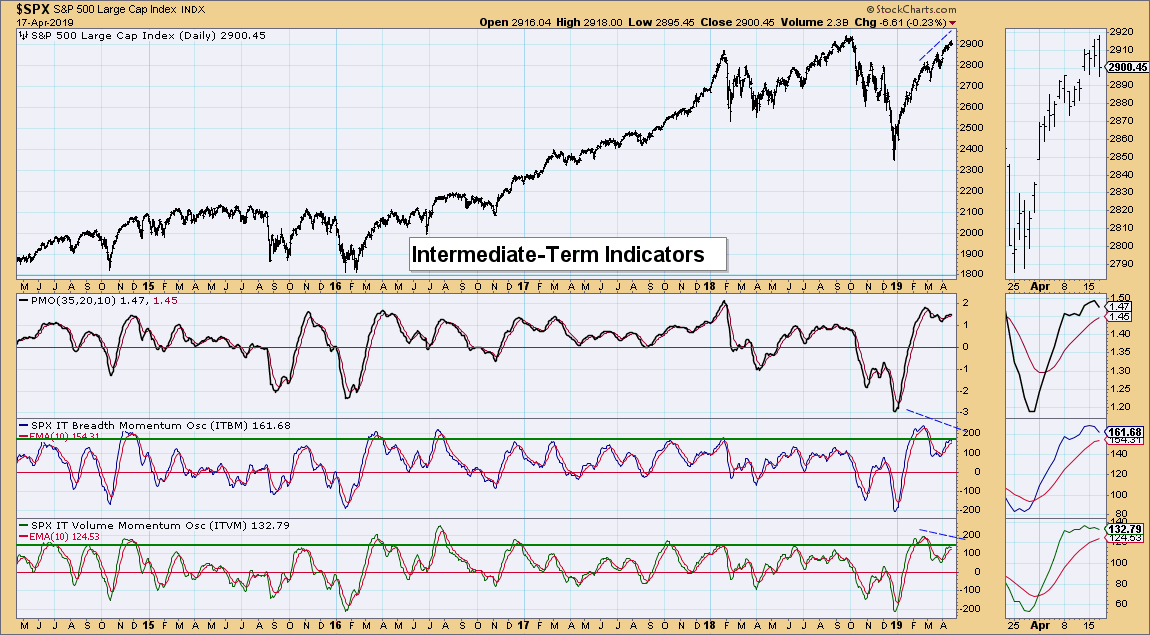
Intermediate-Term Market Indicators: These indicators have been struggling to stay positive. Currently, they are holding above the signal lines. Since they do tend to twitch, I prefer to wait for crossovers before making solid conclusions. However, they are both pointed lower and look to be headed for negative crossovers.
Conclusion: There are quite a few signs pointing to a bearish end to the week. The biggest concern are the negative indicators and the very low VIX numbers. Both suggest a downturn soon and there is also that gap to close.
DOLLAR (UUP)
IT Trend Model: BUY as of 2/7/2019
LT Trend Model: BUY as of 5/25/2018
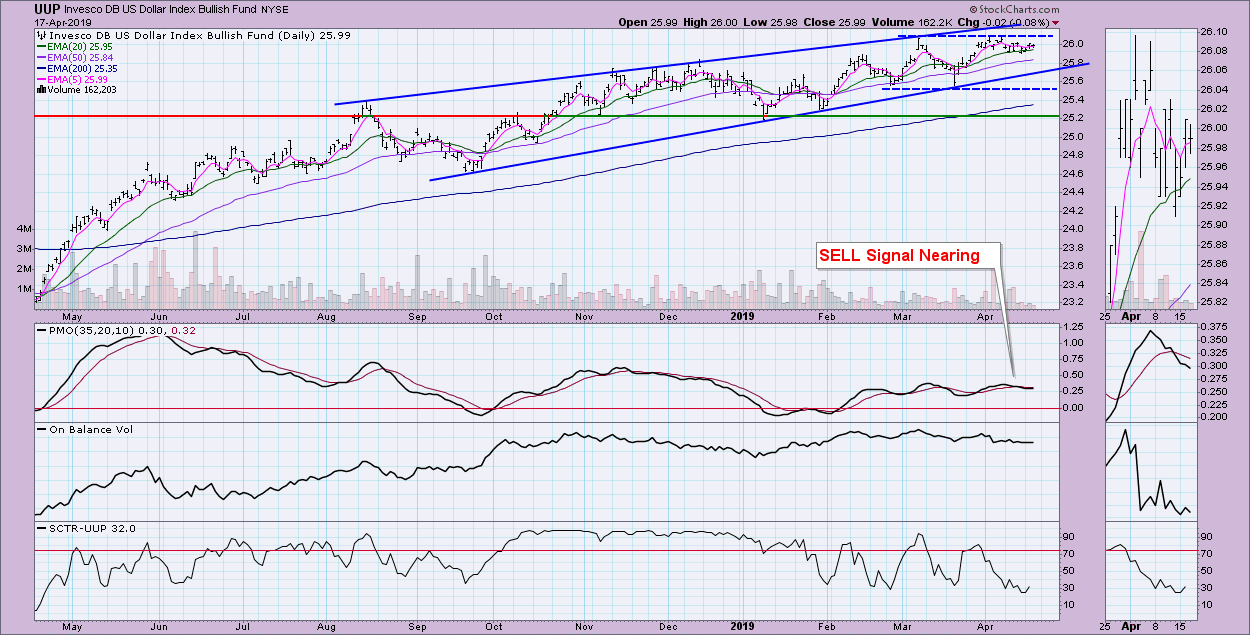
UUP Daily Chart: There is a longer-term rising wedge formation, but I'm primarily watching the trading channel I've annotated. UUP is at the top of the range and has been unable to test it or break above it. The PMO SELL signal tells us to look for UUP to decline and likely test the bottom of the trading range.
GOLD
IT Trend Model: Neutral as of 4/16/2019
LT Trend Model: BUY as of 1/8/2019
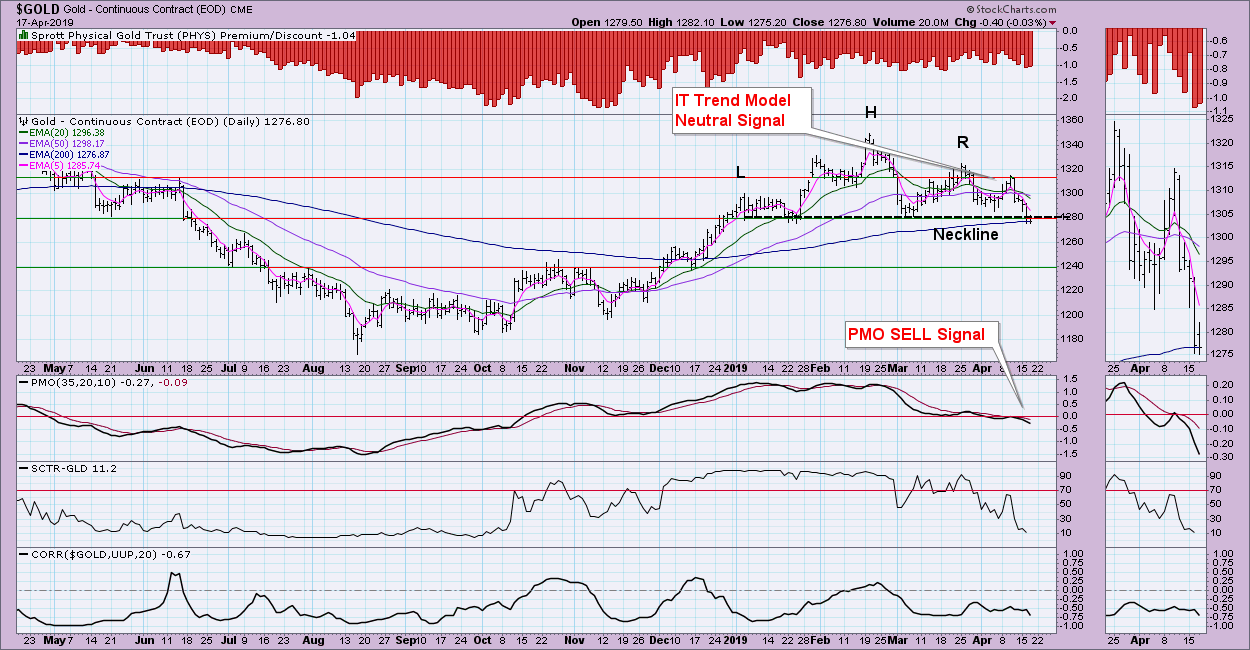
GOLD Daily Chart: I see a messy head-and-shoulders pattern here, which Tom McClellan pointed out on today's MarketWatchers LIVE show. To see the show, click here. Yesterday and today, price traded and closed below the neckline. It isn't a decisive 3% drop, but, given the PMO SELL signal and drop of the SCTR, I suspect we will see that 3% drop soon.
CRUDE OIL (USO)
IT Trend Model: BUY as of 2/19/2019
LT Trend Model: SELL as of 11/23/2018
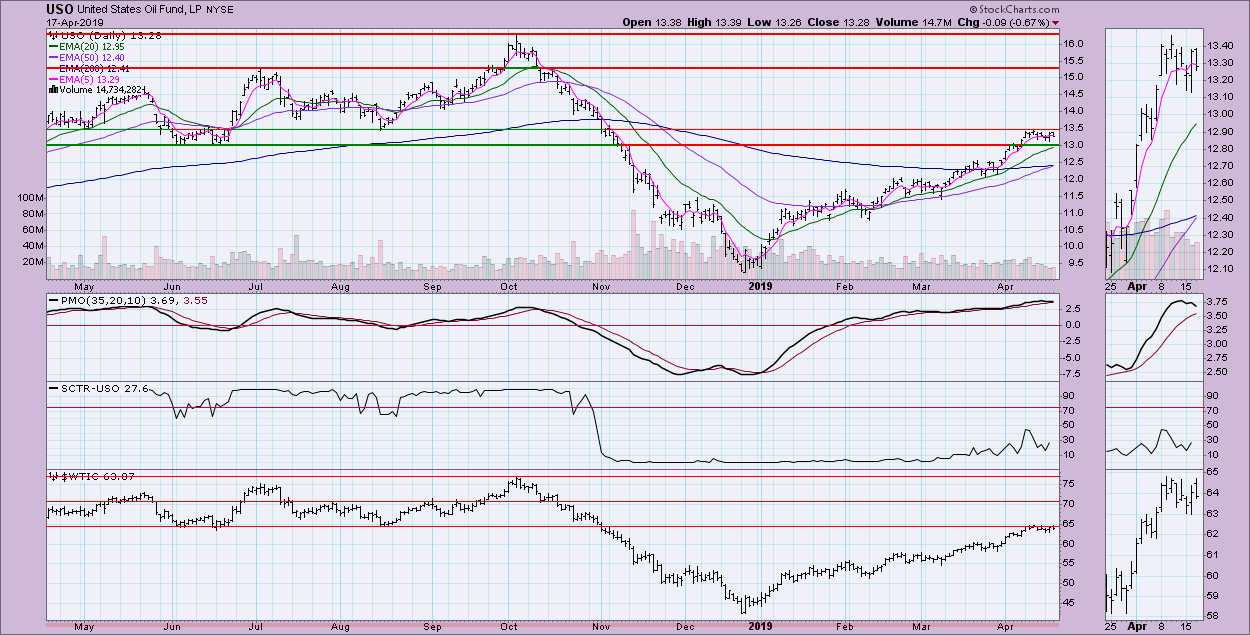
USO Daily Chart: Price has been stuck in a trading range. The PMO is topping in somewhat overbought territory and looks ready to pick up a PMO SELL signal. Support has been holding. I'm noticing that the 50-EMA is about to cross above the 200-EMA. That would give us a DecisionPoint LT Trend Model BUY signal, essentially moving Oil into a "bull market" configuration. Overhead resistance appears strong, but so is support, which is marked by both the 20-EMA and the June lows.
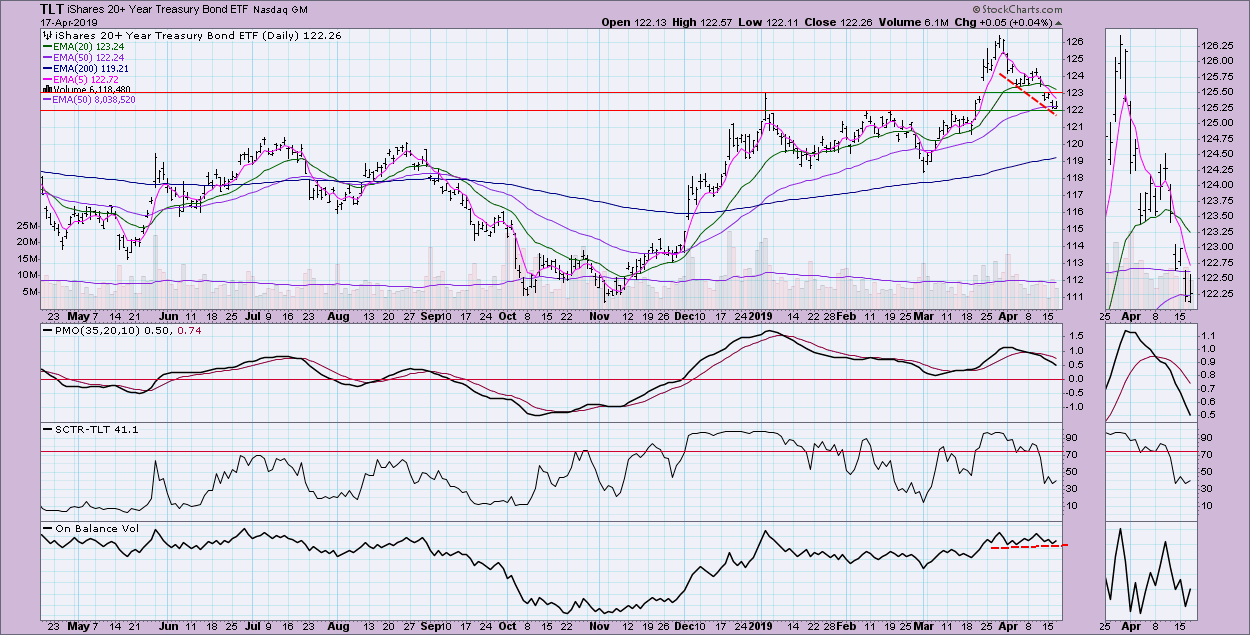
BONDS (TLT)
IT Trend Model: BUY as of 12/6/2018
LT Trend Model: BUY as of 1/2/2019
TLT Daily Chart: Bonds are coming back to earth. Currently, TLT is challenging support along the February and March tops. The PMO doesn't seem interested in turning back around. While the OBV hasn't shown significant downside action, the bottoms are actually about even. You could call that a positive divergence, but it's a lukewarm one in my opinion. Let's see if support holds here. OBV could be suggesting that it will.
Technical Analysis is a windsock, not a crystal ball.
Happy Charting!
- Erin
**Don't miss any of the DecisionPoint commentaries! Go to the "Notify Me" box toward the end of this blog page to be notified as soon as they are published.**
NOTE: The signal status reported herein is based upon mechanical trading model signals, specifically, the DecisionPoint Trend Model. These define the implied bias of the price index based upon moving average relationships, but they do not necessarily call for a specific action. They are information flags that should prompt chart review. Further, they do not call for continuous buying or selling during the life of the signal. For example, a BUY signal will probably (but not necessarily) return the best results if action is taken soon after the signal is generated. Additional opportunities for buying may be found as price zigzags higher, but the trader must look for optimum entry points. Conversely, exit points to preserve gains (or minimize losses) may be evident before the model mechanically closes the signal.
Helpful DecisionPoint Links:
DecisionPoint Shared ChartList and DecisionPoint Chart Gallery
Price Momentum Oscillator (PMO)
Swenlin Trading Oscillators (STO-B and STO-V)

