As we can see on the chart below, none of the major market indexes have exceeded their previous all-time highs. So why are we having this discussion? The point is that price history for traditional market indexes is not adjusted for dividends, so they do not reflect a true total return. It is the same as using stock data that hasn't been adjusted for dividends -- you don't get an accurate picture of how today's price relates to previous prices.
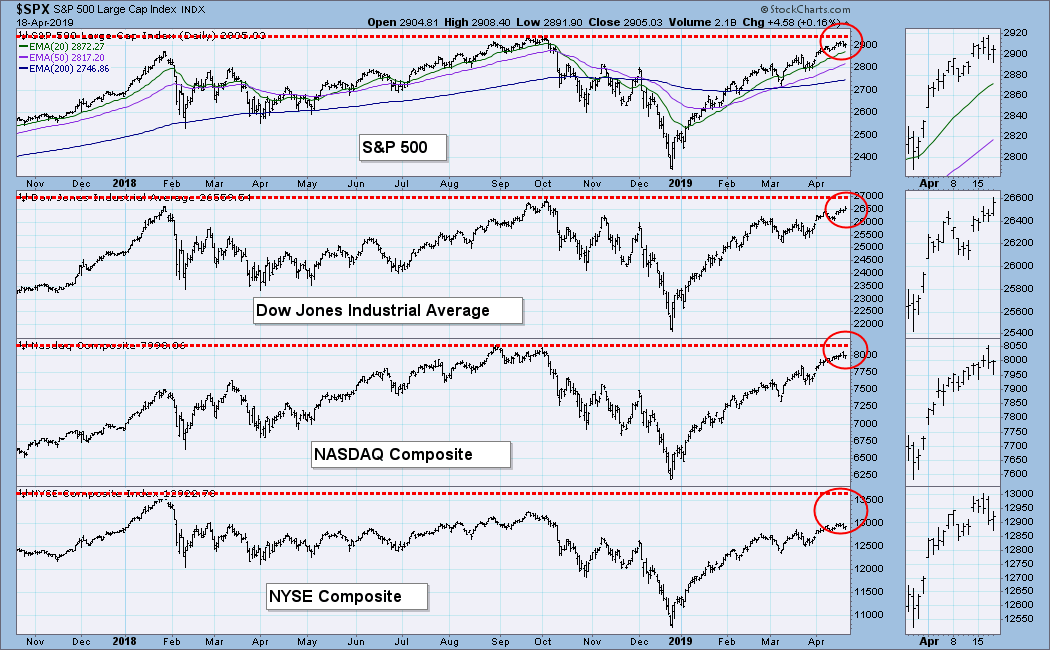
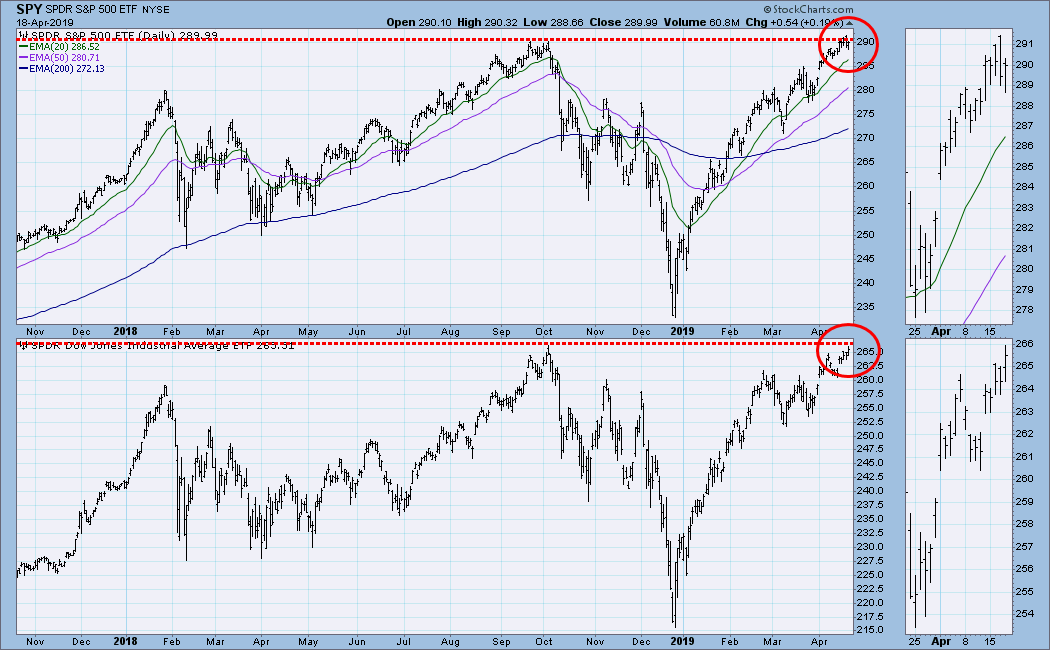
The ETF versions of these indexes do present an accurate relationship, and the ETF version of the S&P 500, SPY, recently made new, all-time highs. The Dow ETF (DIA) is very close to new highs, but this isn't horseshoes. (I could be wrong, but as far as I know, there are no ETF versions of the Nasdaq Composite or NYSE Composite.) So, in my opinion, the market, as represented by SPY has recently exceeded the 2018 record highs.
Note: A reader recently pointed out that another charting website did not show SPY still below the September 2o18 highs. But, as near as I can determine, that other website did not adjust SPY historical prices for the March distribution. Go StockCharts.com!
The DecisionPoint Weekly Wrap presents an end-of-week assessment of the trend and condition of the stock market (S&P 500), the U.S. Dollar, Gold, Crude Oil, and Bonds.
Watch the latest episode of DecisionPoint on StockCharts TV's YouTube channel here!
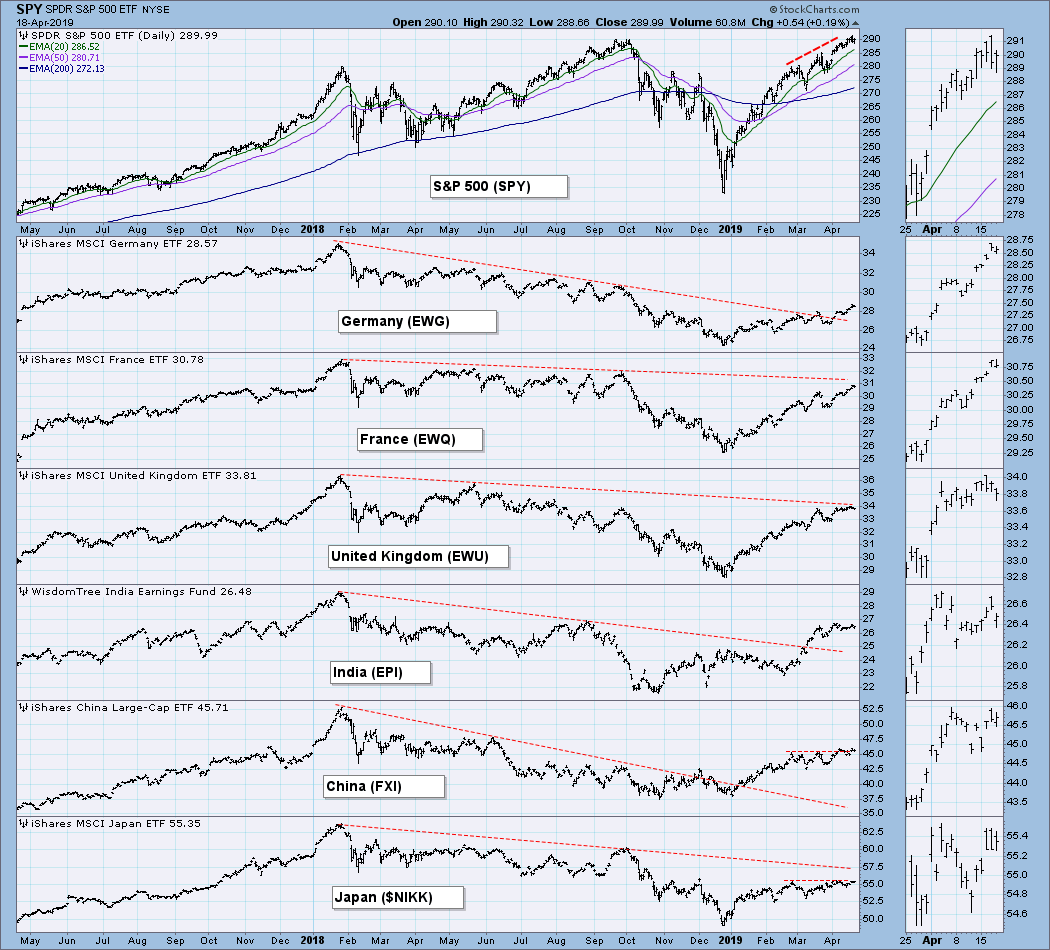
GLOBAL MARKETS
Global markets are well behind the U.S. market.
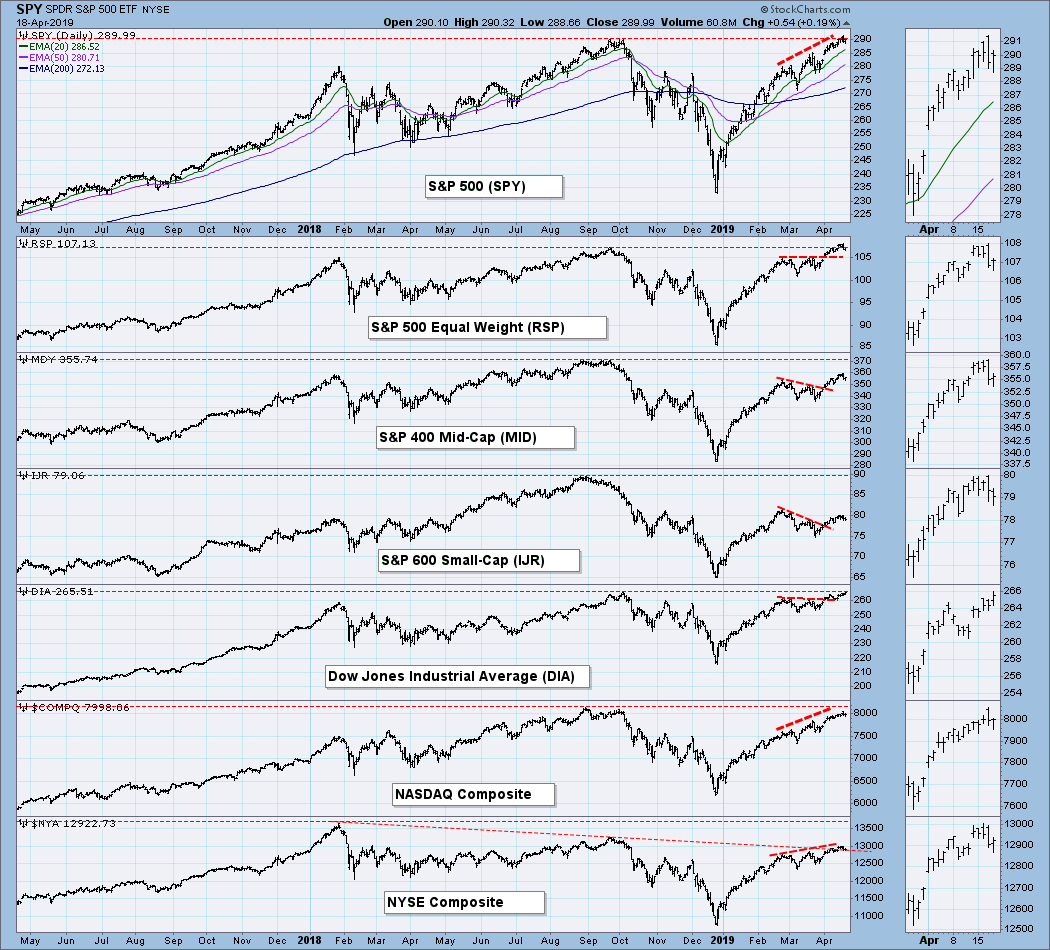
BROAD MARKET INDEXES
Large-cap stocks still lead.
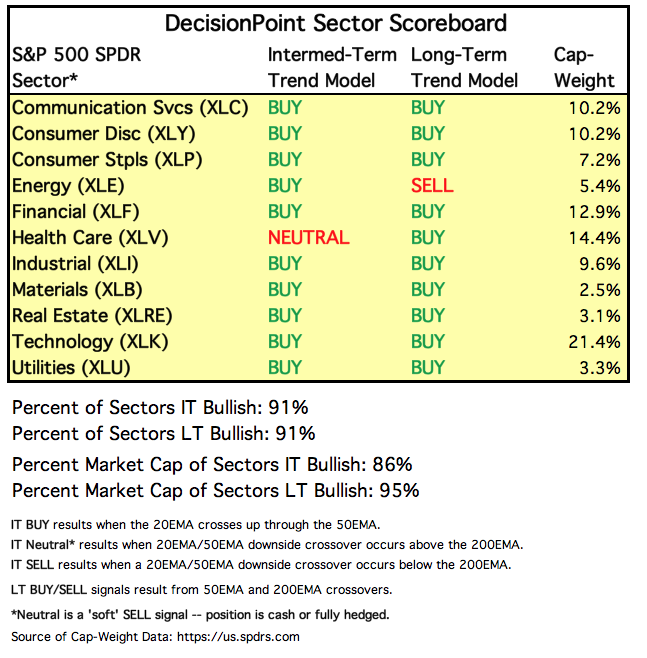
SECTORS
Each S&P 500 Index component stock is assigned to one, and only one, of 11 major sectors. This is a snapshot of the Intermediate-Term and Long-Term Trend Model signal status for those sectors.
STOCKS
IT Trend Model: BUY as of 2/1/2019
LT Trend Model: BUY as of 2/26/2019
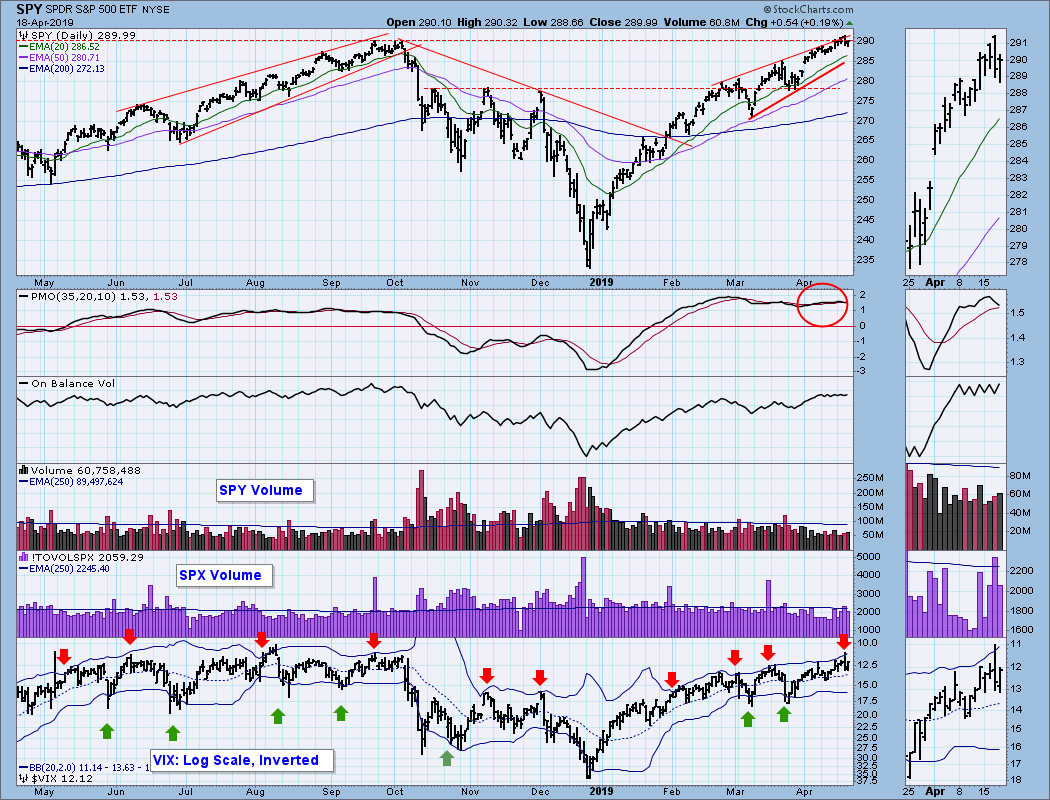
SPY Daily Chart: Last week I reminded one and all about the monthly options expiration this week, and said to expect quiet trading toward the end of the week. Well, I was half right. Because of the Good Friday market holiday, trading was quiet all week. Nevertheless, SPY hit new, all-time highs, although we need a magnifier to see them. The VIX has been teasing us, almost reaching the upper Bollinger Band twice in the last three weeks, but Friday it finally penetrated the upper band, alerting us to the possibility of a short-term price decline.
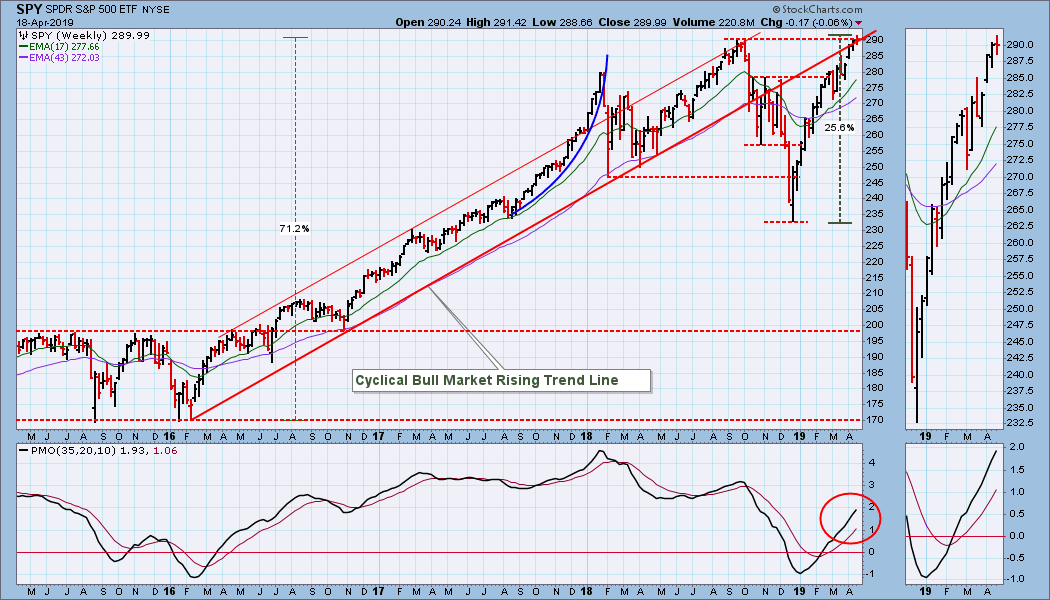
SPY Weekly Chart: The weekly PMO is rising strongly, but the advance from the December low has been unusually steep. I think that some corrective action is in order.
Climactic Market Indicators: Volume continues to be weak.
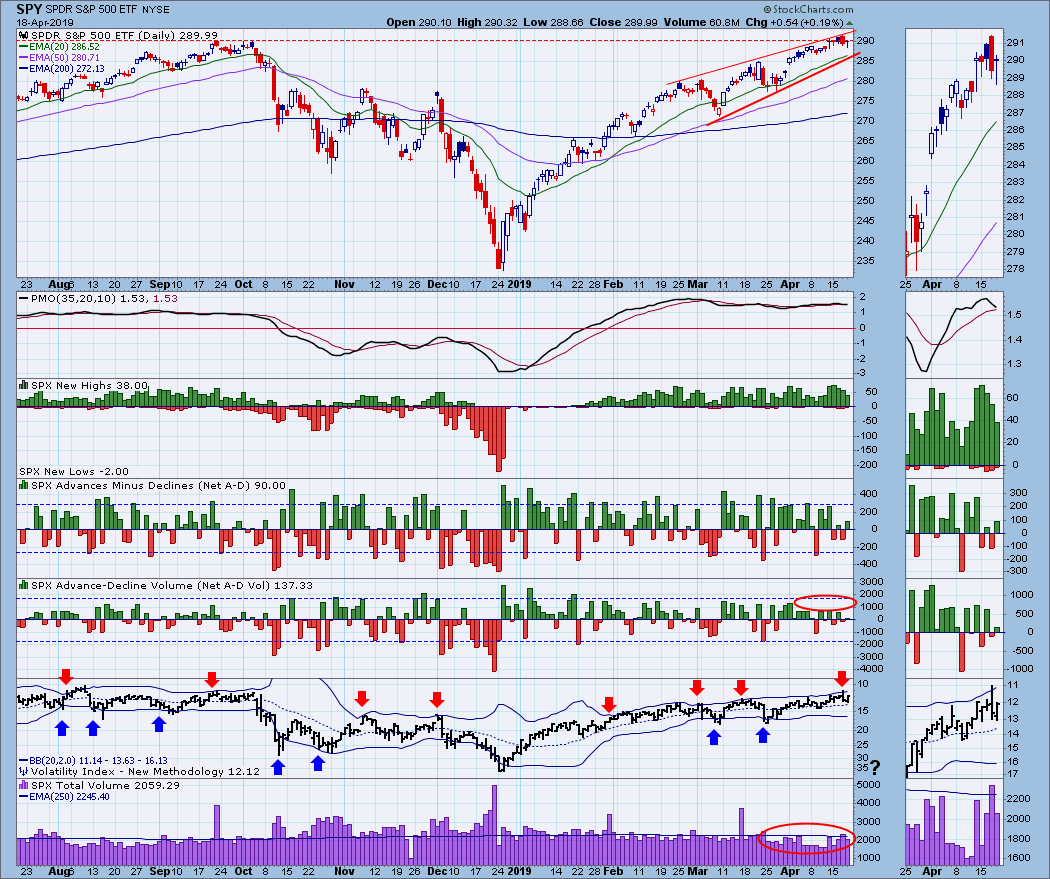
Short-Term Market Indicators: The STO-B and STO-V are not much help. They are neutral, but that may be as low as they are going to go.
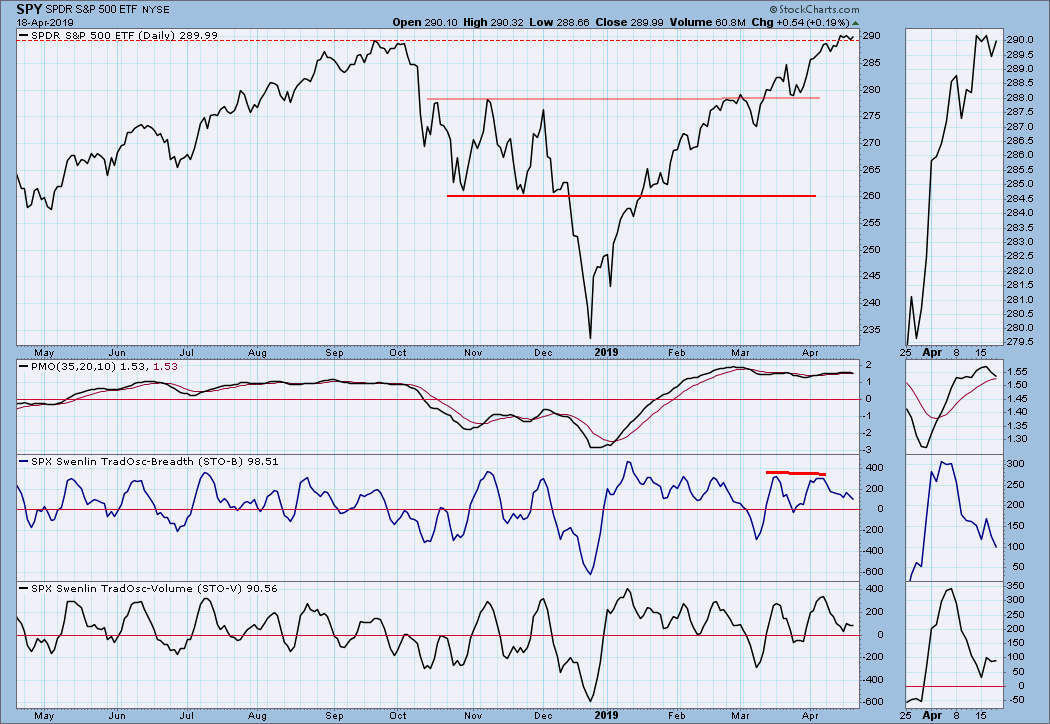
Intermediate-Term Market Indicators: They are overbought and have topped.
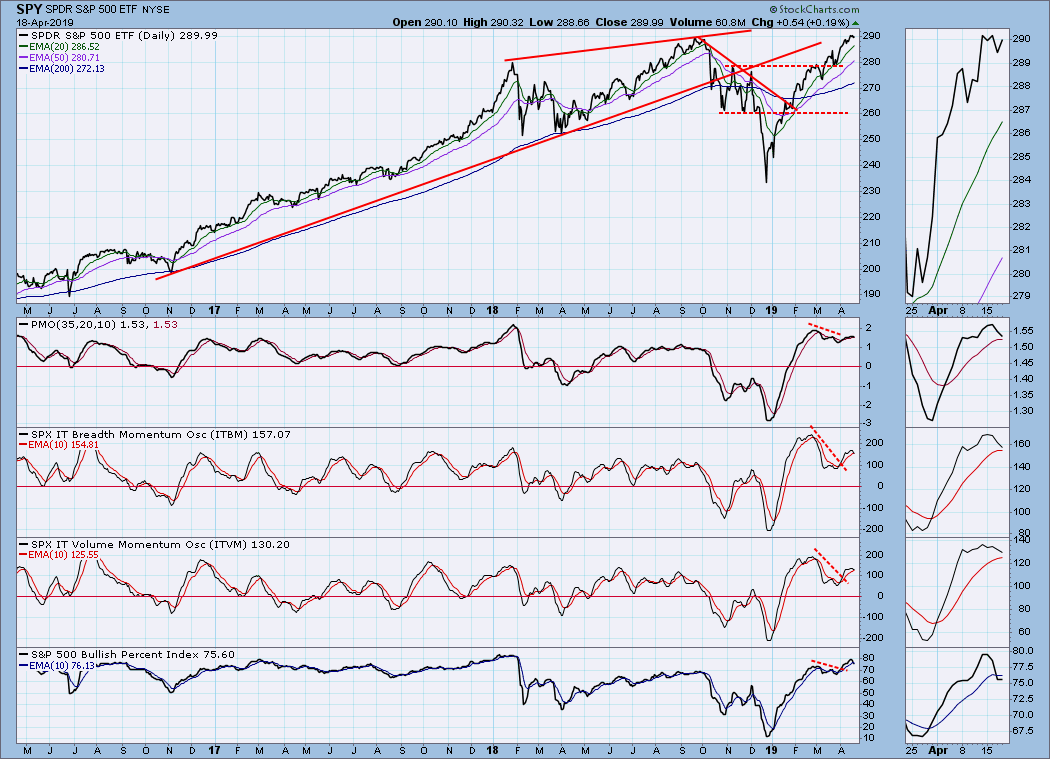
CONCLUSION: While SPY has moved to new, all-time highs, it is by no means a strong breakout at this point. Price action is reminiscent of the September 2018 price top -- minor daily changes and small daily ranges. Low volatility precedes high volatility. The market is at major overhead resistance, and this year's advance needs to be corrected. I'm hearing people calling for a market 'melt up,' but I see the potential for a major double top. Not necessarily a 'melt down,' but certainly a pullback to set a less accelerated rising trend line.
DOLLAR (UUP)
IT Trend Model: BUY as of 2/7/2019
LT Trend Model: BUY as of 5/25/2018
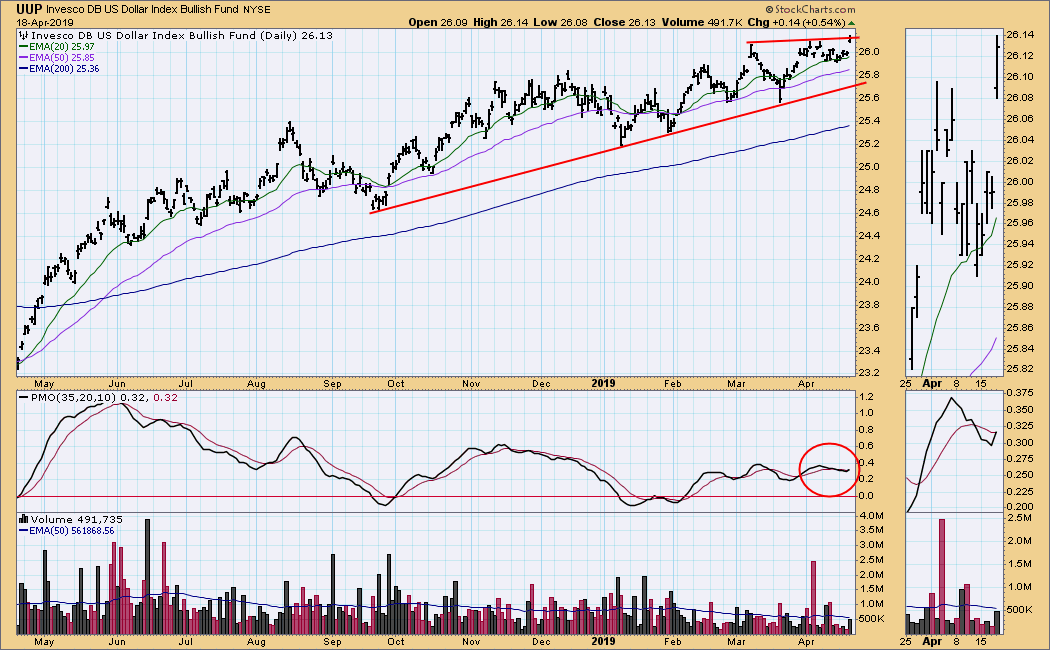
UUP Daily Chart: I think we need to look at the weekly chart for a better context.
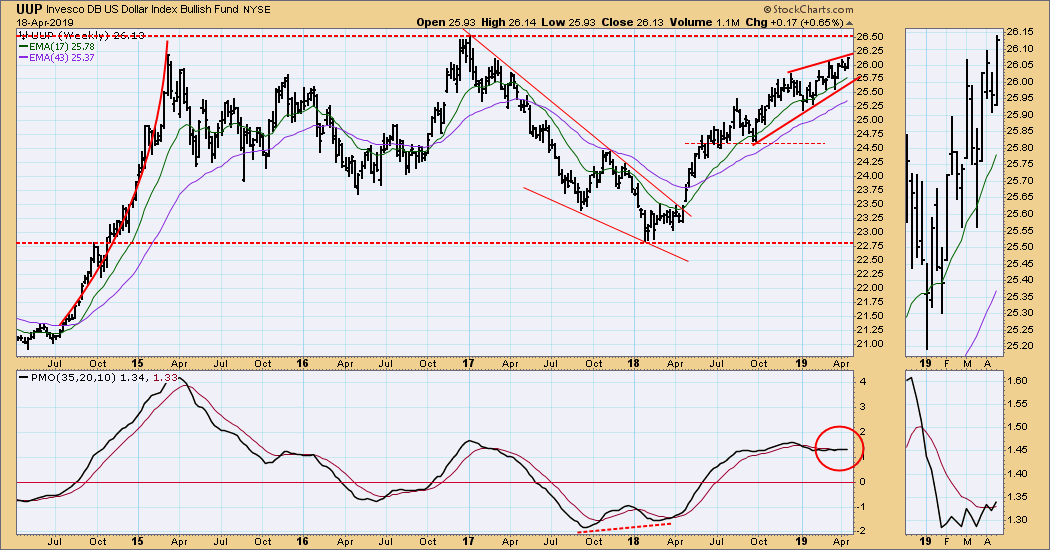
UUP Weekly Chart: Price is crowding the top of a bearish rising wedge formation. If it manages to resolve bullishly, there is long-term resistance dead ahead.
GOLD
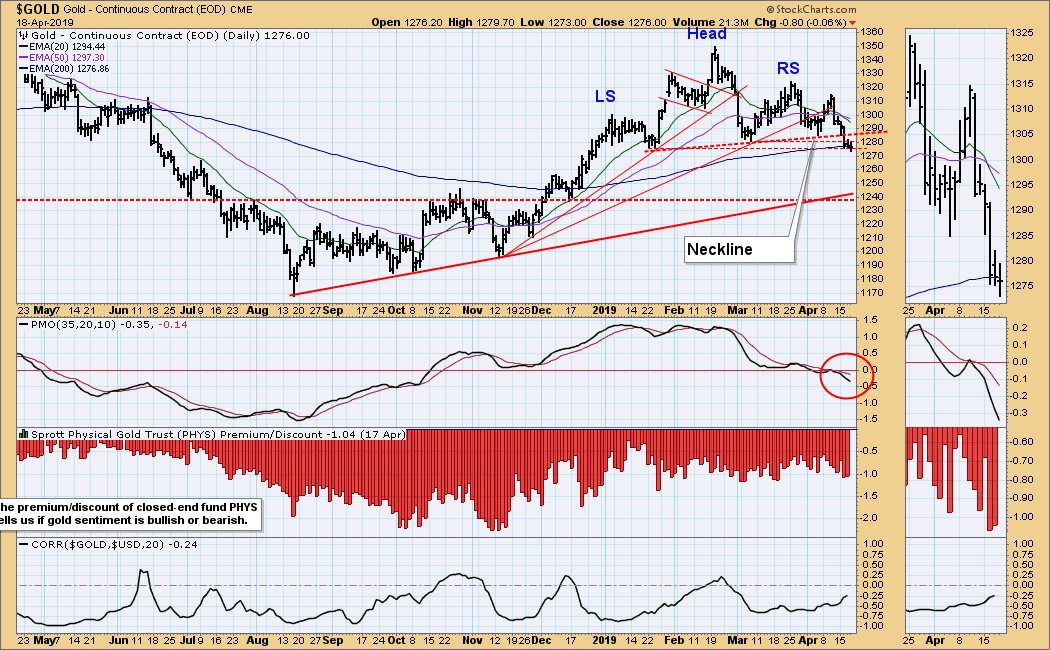
IT Trend Model: NEUTRAL as of 4/16/2019
LT Trend Model: BUY as of 1/8/2019
GOLD Daily Chart: This week the 20EMA dropped down through the 50EMA, generating an IT Trend model NEUTRAL signal. Gold has executed a head and shoulders pattern by breaking down through the neckline. The minimum downside target is about 1220.
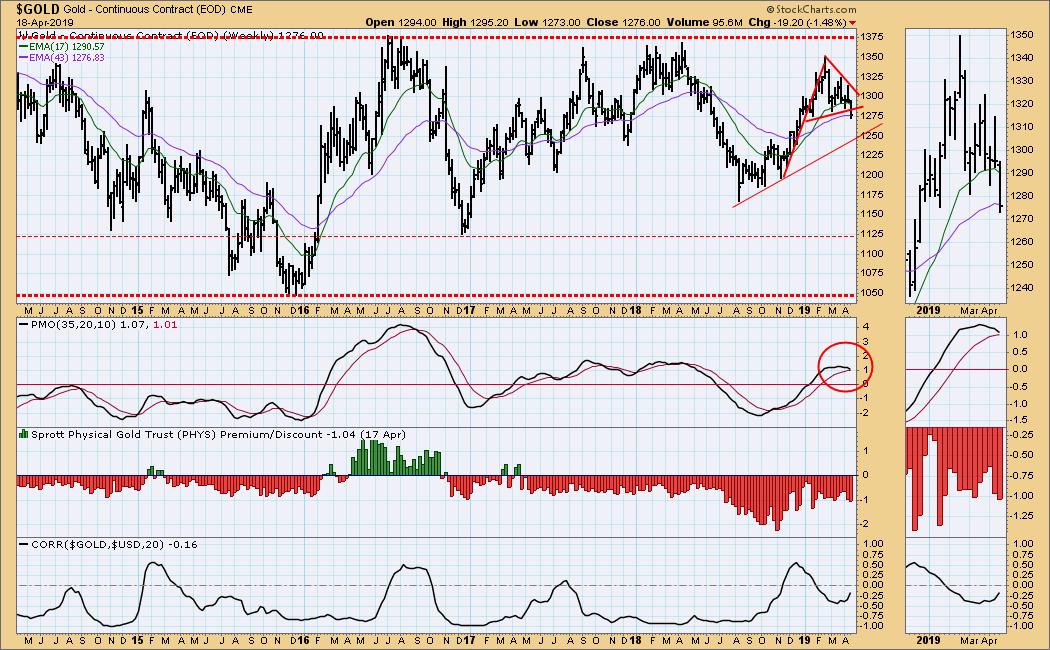
GOLD Weekly Chart: Price has broken down through the bottom of a pennant formation, and the weekly PMO is falling.
CRUDE OIL (USO)
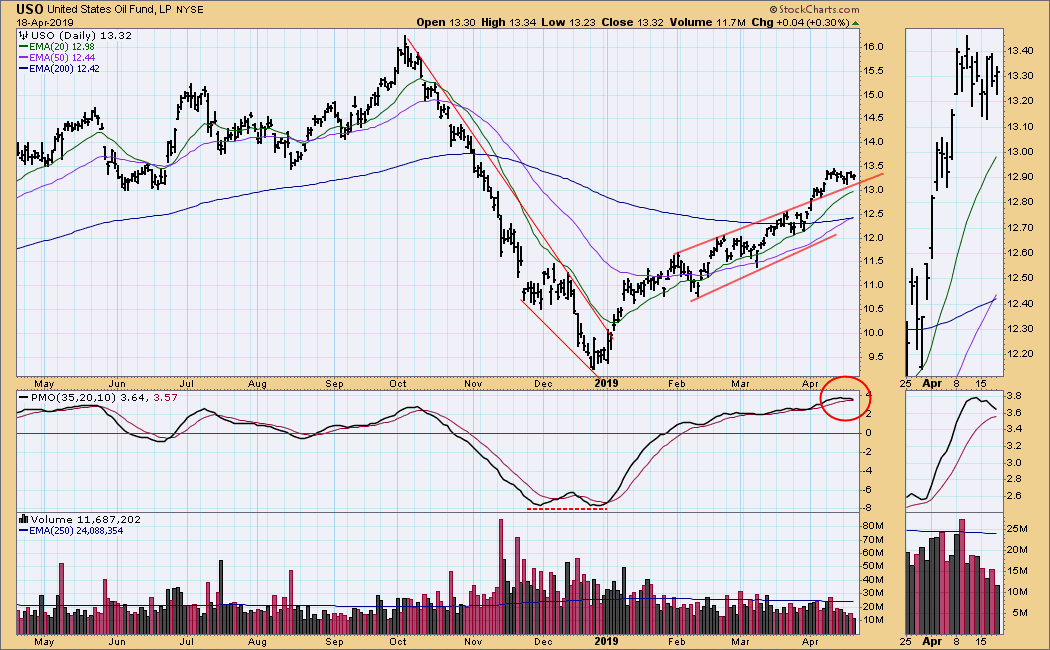
IT Trend Model: BUY as of 2/19/2019
LT Trend Model: BUY as of 4/17/2019
USO Daily Chart: On Thursday the 50EMA crossed up through the 200EMA, generating an LT Trend Model BUY signal, but the daily PMO topped last week, and I wonder how durable that new signal will prove to be.
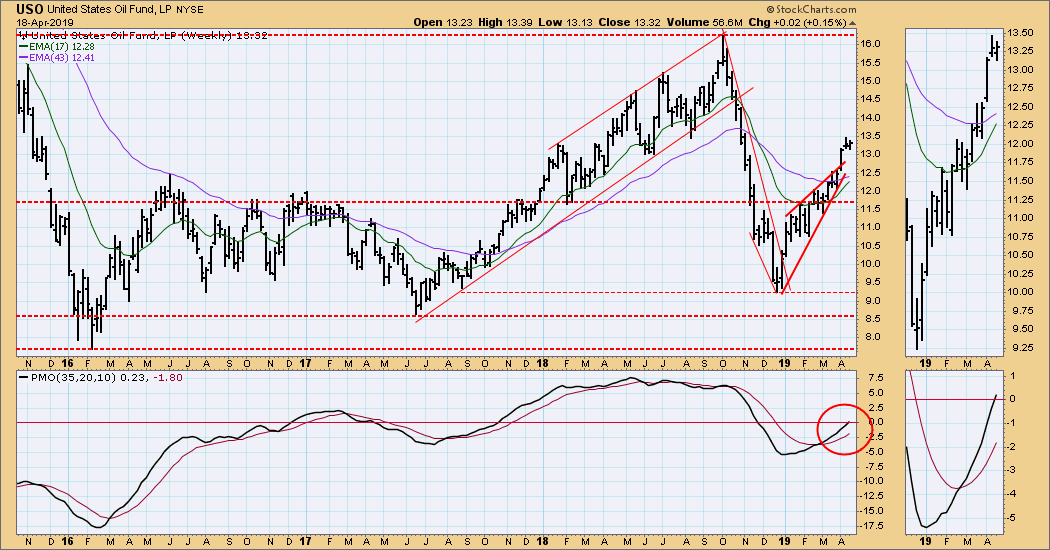
USO Weekly Chart: The tight and bearish rising wedge resolved upward, which is bullish. The weekly PMO has mover up through the zero line -- also bullish. The upside target is last year's high, which is about $76/bbl for crude.
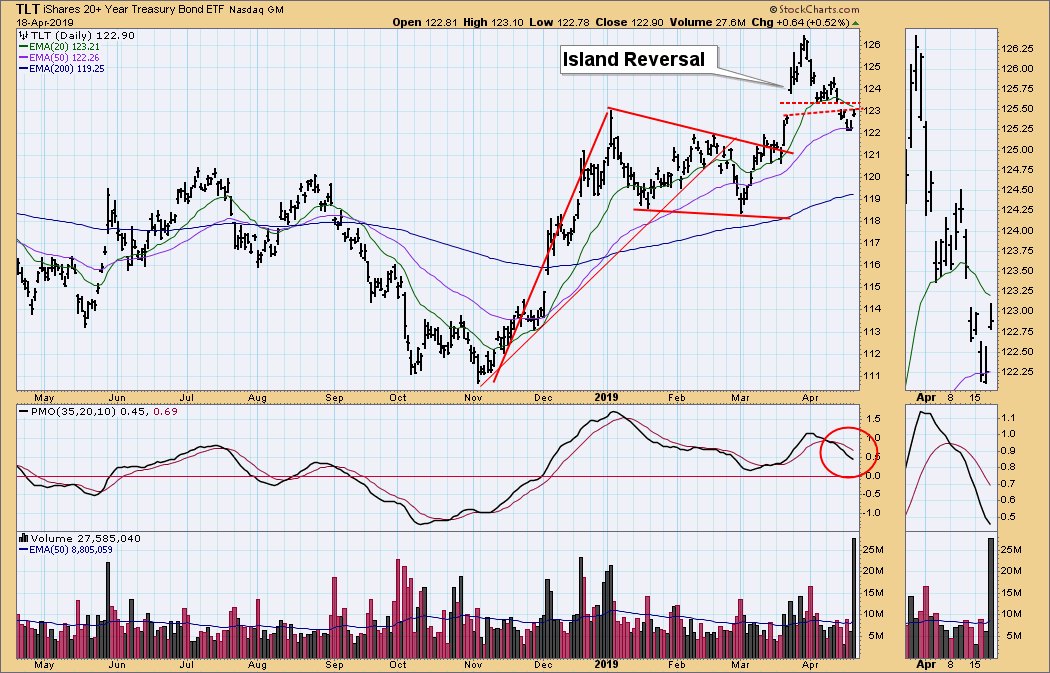
BONDS (TLT)
IT Trend Model: BUY as of 12/6/2018
LT Trend Model: BUY as of 1/2/2019
TLT Daily Chart: Last week TLT jumped down across the island reversal gap, and as of Friday it was testing the bottom of the gap.
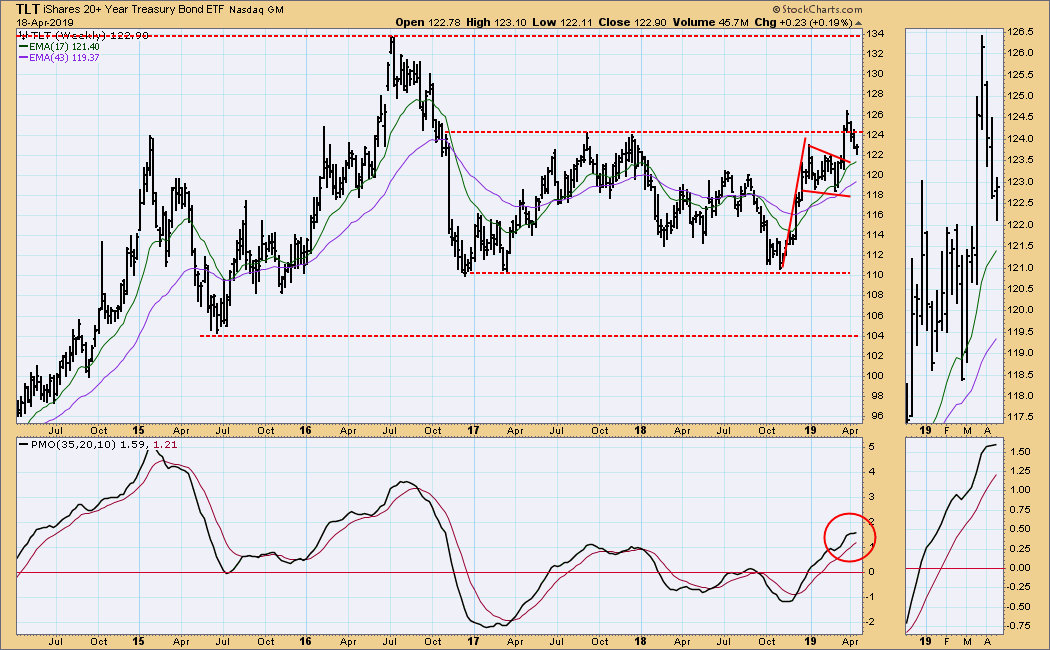
TLT Weekly Chart: Four weeks ago TLT broke out of a flag formation, and then it broke through a line of resistance drawn across two 2017 tops. It subsequently pulled back toward the point of breakout, pretty much ignoring the support/resistance line. Since it closed toward the top of this week's range, we might conclude that the pullback is over. We shall see.
**Don't miss any of the DecisionPoint commentaries! Go to the "Notify Me" box toward the end of this blog page to be notified as soon as they are published.**
Technical Analysis is a windsock, not a crystal ball.
Happy Charting!
- Carl
NOTE: The signal status reported herein is based upon mechanical trading model signals, specifically, the DecisionPoint Trend Model. They define the implied bias of the price index based upon moving average relationships, but they do not necessarily call for a specific action. They are information flags that should prompt chart review. Further, they do not call for continuous buying or selling during the life of the signal. For example, a BUY signal will probably (but not necessarily) return the best results if action is taken soon after the signal is generated. Additional opportunities for buying may be found as price zigzags higher, but the trader must look for optimum entry points. Conversely, exit points to preserve gains (or minimize losses) may be evident before the model mechanically closes the signal.
Helpful DecisionPoint Links:
DecisionPoint Shared ChartList and DecisionPoint Chart Gallery
Price Momentum Oscillator (PMO)
Swenlin Trading Oscillators (STO-B and STO-V)


