 Naturally, right after I wrote a very bullish article, the market decided to humble me somewhat with a reversal today. Yesterday, I mentioned that all-time high price resistance is generally very difficult to break above decisively (3+%). After publishing, though, Carl pointed out to me that volume on yesterday's move was suspect. I had to agree, but remained optimistic. Today's volume indicators, however, have me rethinking. I'm still bullish in the intermediate-to-long term, but the short term just got a little more complicated.
The DecisionPoint Alert presents a mid-week assessment of the trend and condition of the stock market (S&P 500), the U.S. Dollar, Gold, Crude Oil and Bonds.
Watch the latest episode of DecisionPoint on StockCharts TV's YouTube channel here!
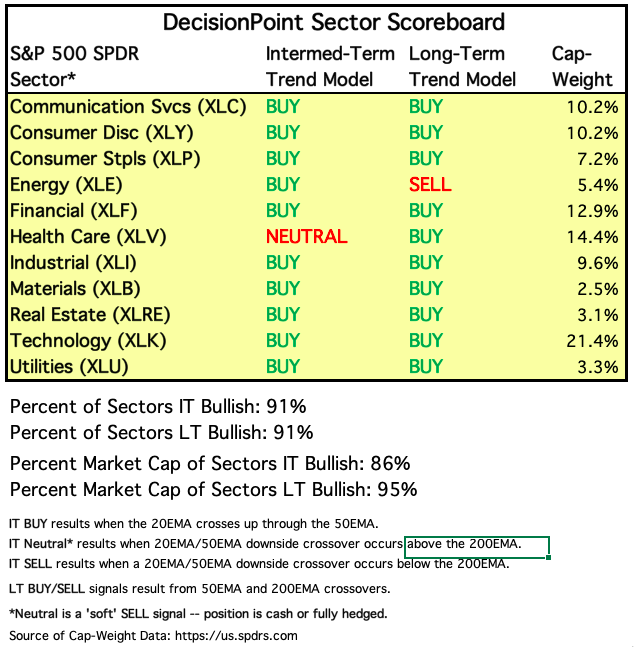
SECTORS
Each S&P 500 Index component stock is assigned to one, and only one, of eleven major sectors. This is a snapshot of the Intermediate-Term and Long-Term Trend Model signal status for those sectors.
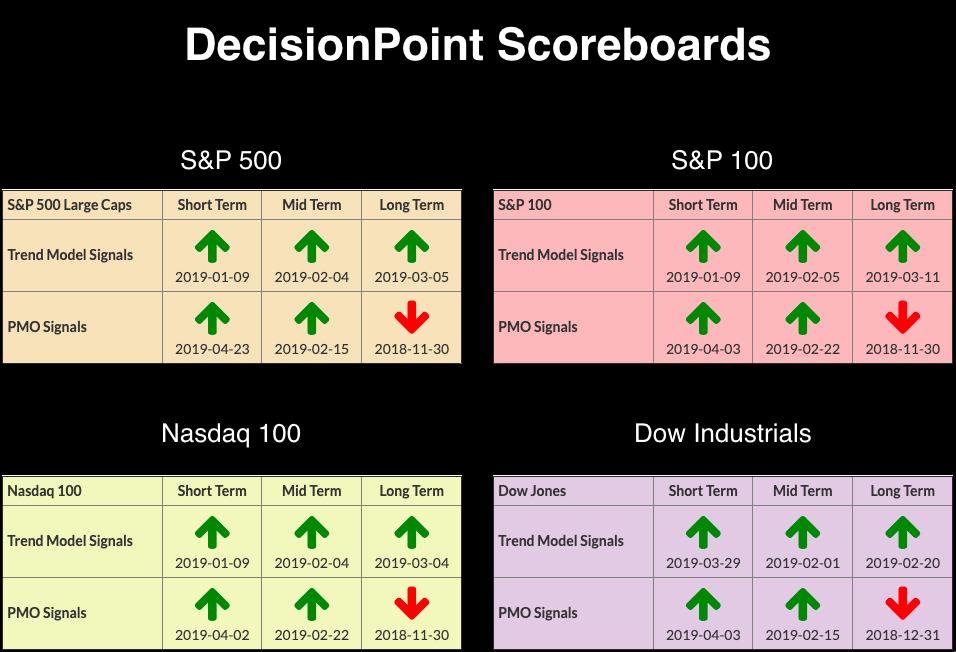
STOCKS
IT Trend Model: BUY as of 2/1/2019
LT Trend Model: BUY (SPY) as of 2/26/2019
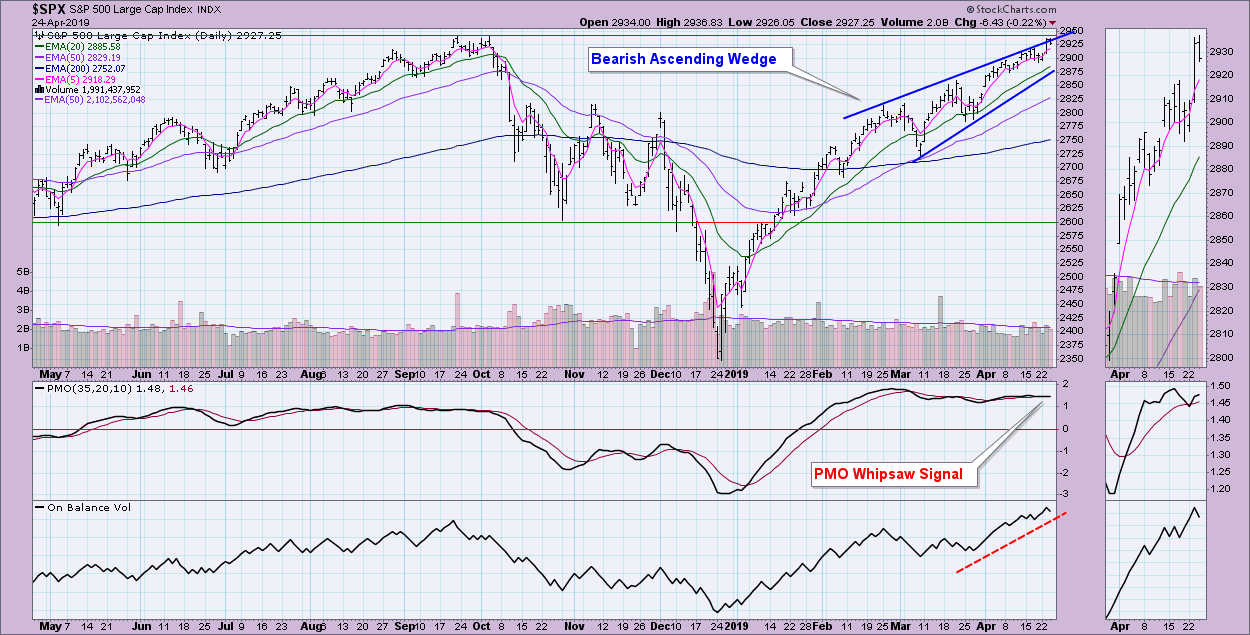
SPY Daily Chart: Yesterday, we closed at an all-time high on many of the major indexes. Today saw prices reverse. The top of the wedge is being penetrated, which is very bullish, but overhead resistance is starting to look stouter in the shorter term. The OBV on the daily chart is very healthy, with the exception of the September OBV top compared to recent readings. Note that it has pushed above that September OBV top, a reverse divergence that goes against the "price should follow volume" protocol. Yesterday's volume bar was not what you would expect on a day where new all-time highs were posted.
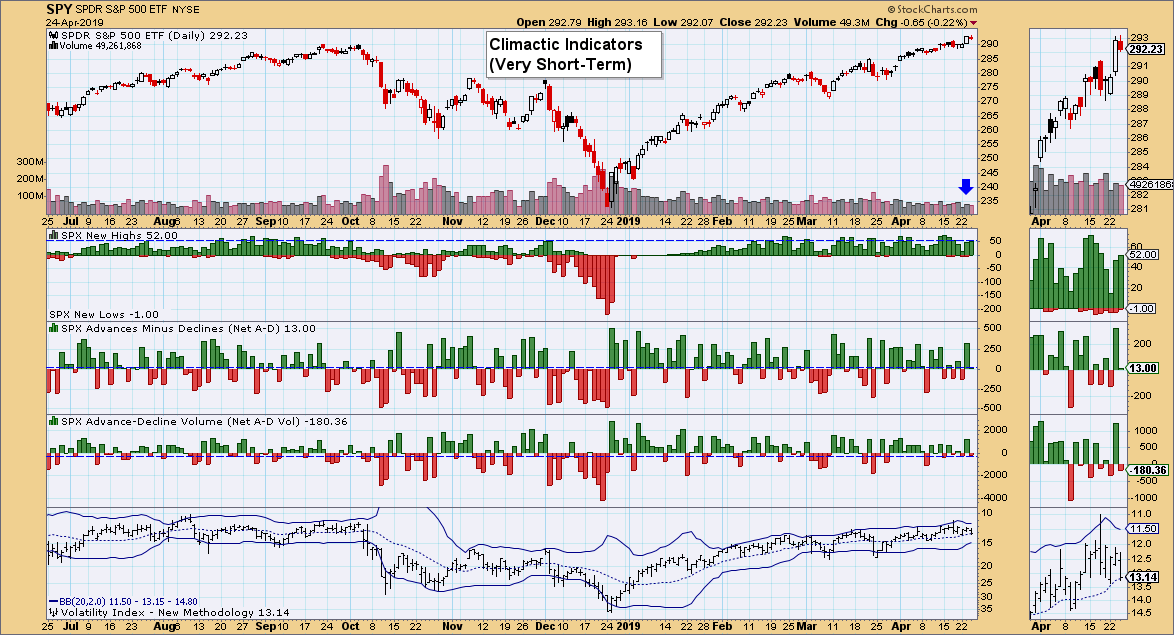
Climactic Market Indicators: The volume issue is more obvious on this chart. We are still seeing climactic New Highs, but corresponding breadth on advances/declines isn't there. Notice that the advance-decline "volume" posted a negative reading v. the positive advances-declines reading. VIX is in the middle of the thin band and is basically not helpful.
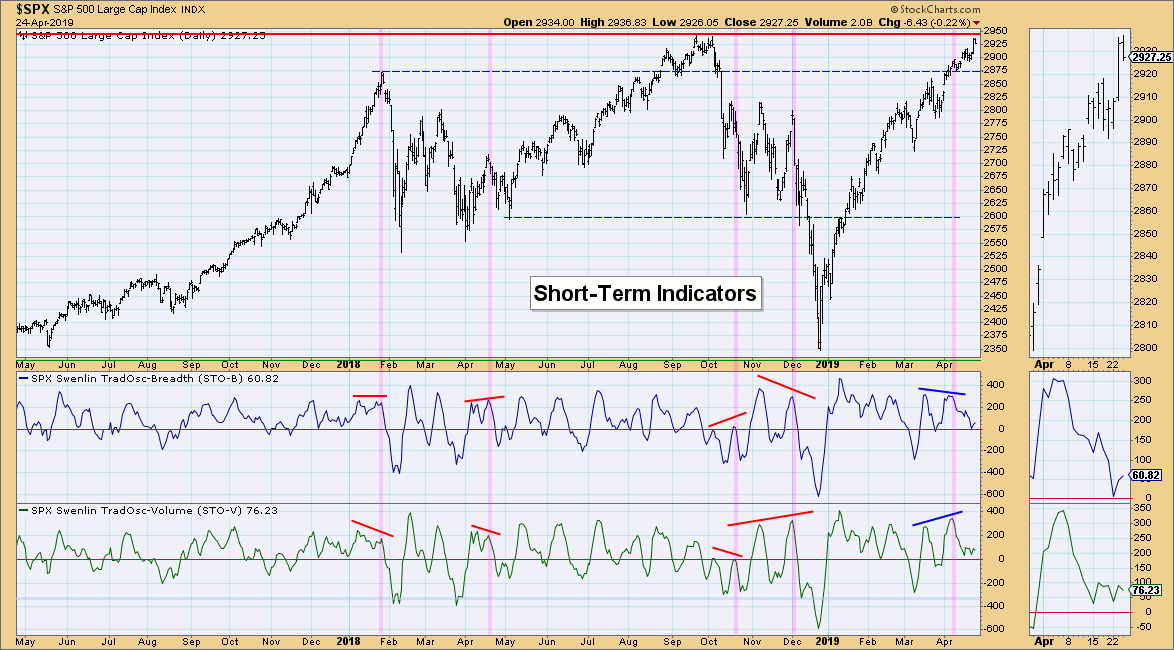
Short-Term Market Indicators: Notice that the STO-V is in decline while the STO-B in rising. I also note the declining tops in the thumbnail for both indicators that occurred while price pushed higher.
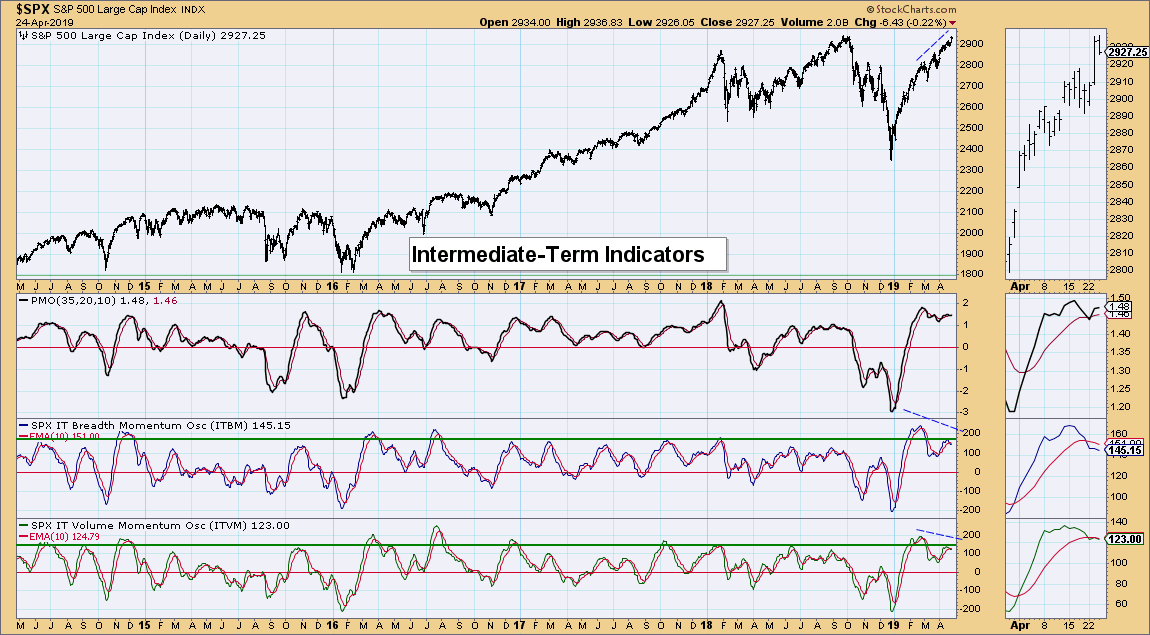
Intermediate-Term Market Indicators: Both setup indicators are negative here. They've had negative crossovers and negative divergences.
Conclusion: I don't believe the bottom will fall out; I just think the market will need to churn or pause before resuming its move higher. The volume indicators simply don't support a strong follow-on rally. They don't rule a rally out, but they should remind us to stay vigilant with short-term investments.
DOLLAR (UUP)
IT Trend Model: BUY as of 2/7/2019
LT Trend Model: BUY as of 5/25/2018
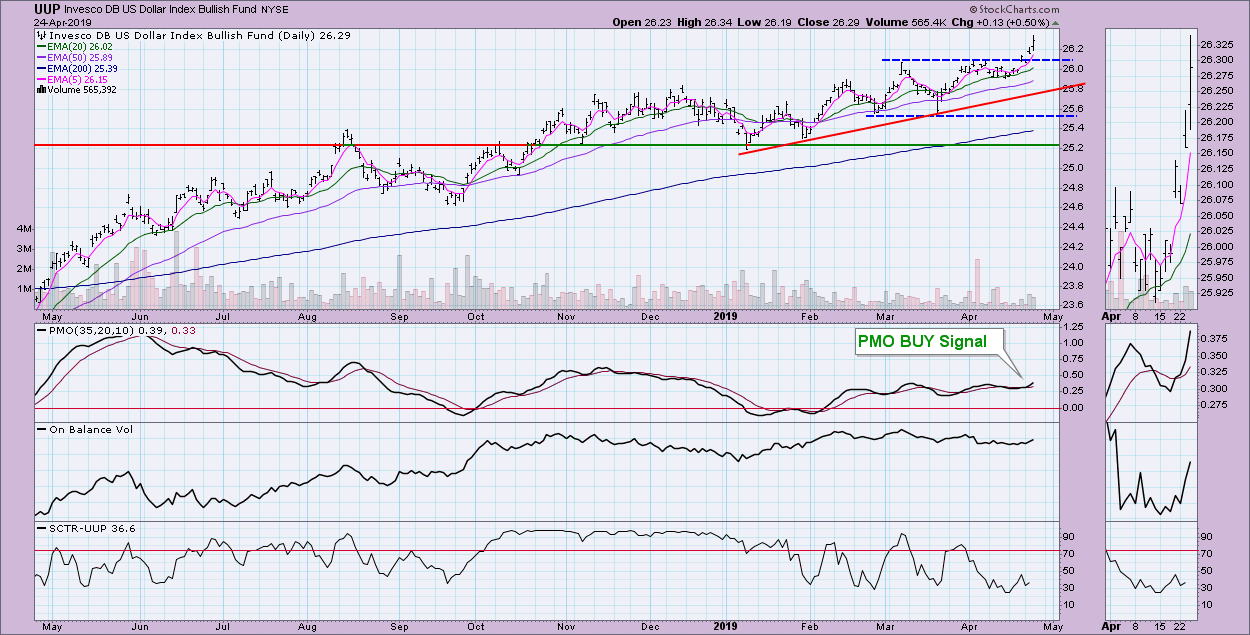
UUP Daily Chart: It was a nice breakout on the Dollar this week. The PMO BUY signal suggests higher prices. The OBV is a bit anemic on this pop higher and, like the SPX, the volume on this big breakout was a little suspect. I would look for the Dollar to continue its rise - it may just require a small move back toward the point of the breakout (around $16.10).
GOLD
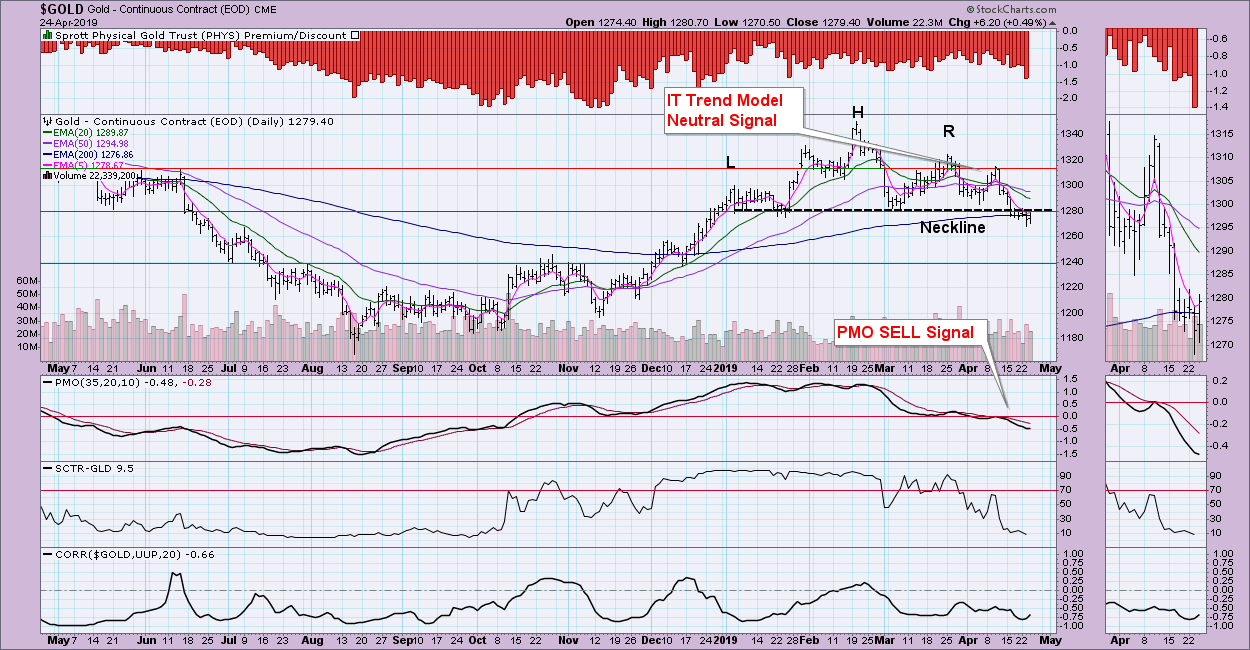
IT Trend Model: Neutral as of 4/16/2019
LT Trend Model: BUY as of 1/8/2019
GOLD Daily Chart: The head and shoulders pattern is still in play. The one positive is the rise in the discount rate. That suggests bearish sentiment, which is generally bullish for Gold. I wouldn't hang my hat on that - I'm still very bearish given the pattern and indicator behavior.
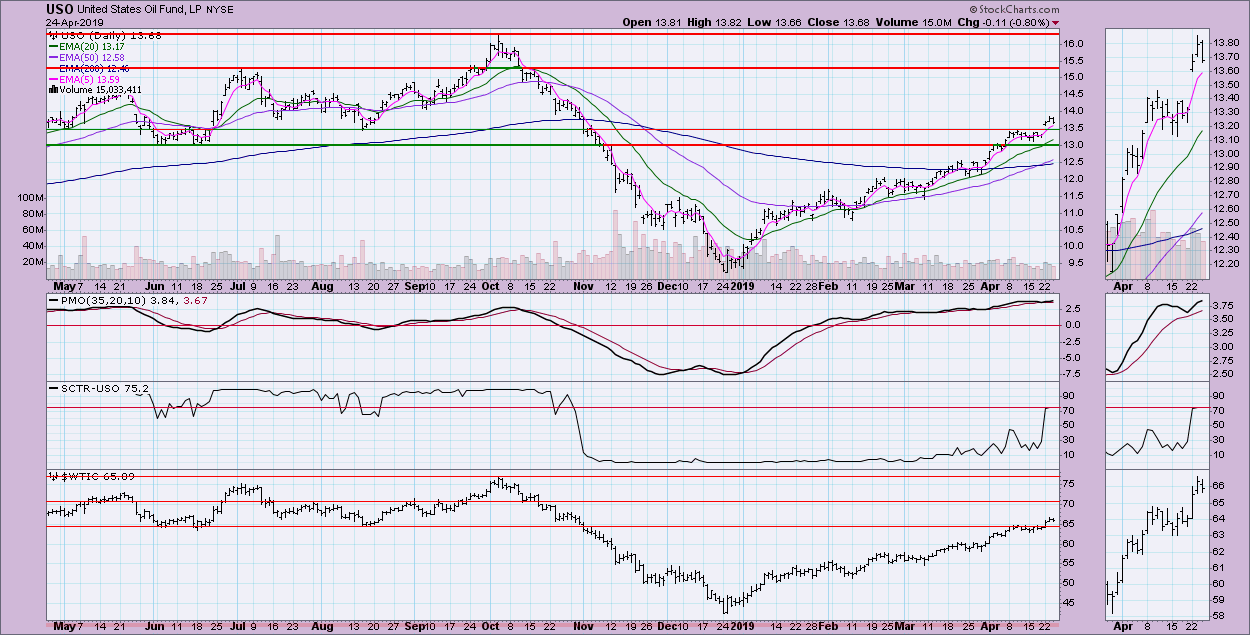
CRUDE OIL (USO)
IT Trend Model: BUY as of 2/19/2019
LT Trend Model: SELL as of 11/23/2018
USO Daily Chart: All signs point to higher prices. I would look for $70/barrel for crude.
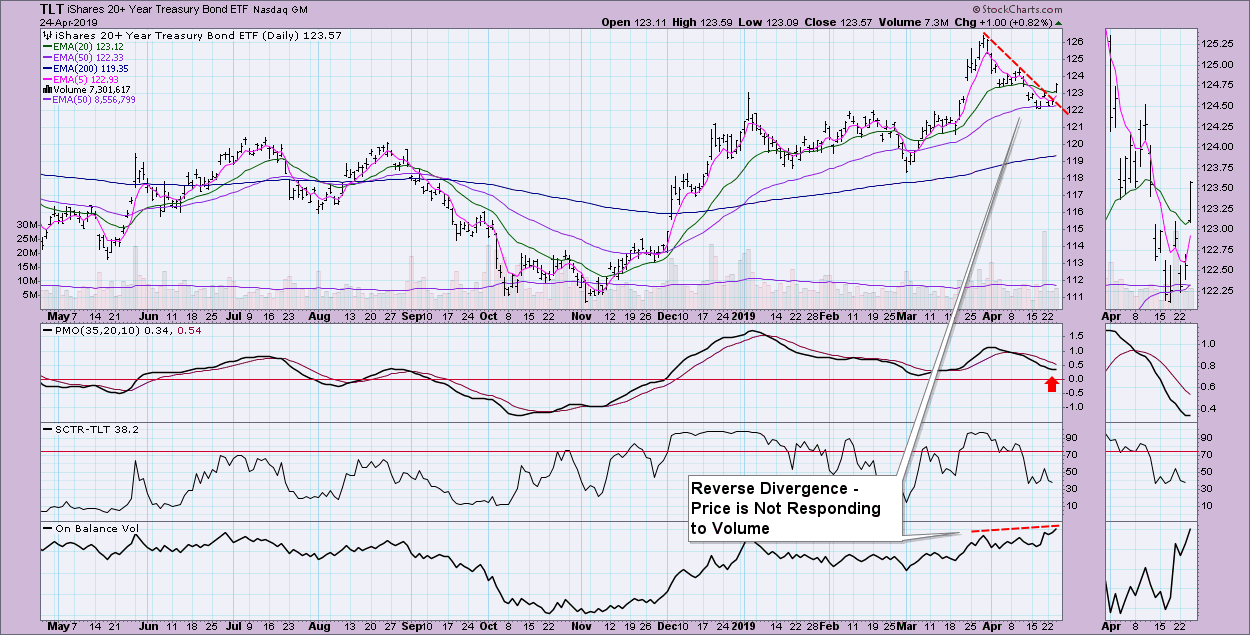
BONDS (TLT)
IT Trend Model: BUY as of 12/6/2018
LT Trend Model: BUY as of 1/2/2019
TLT Daily Chart: Today's breakout was impressive, but the reverse divergence suggests this could be short-lived. The PMO is decelerating, which is bullish, but it hasn't turned up yet.
Technical Analysis is a windsock, not a crystal ball.
Happy Charting!
- Erin
**Don't miss any of the DecisionPoint commentaries! Go to the "Notify Me" box toward the end of this blog page to be notified as soon as they are published.**
NOTE: The signal status reported herein is based upon mechanical trading model signals, specifically, the DecisionPoint Trend Model. These define the implied bias of the price index based upon moving average relationships, but they do not necessarily call for a specific action. They are information flags that should prompt chart review. Furthermore, they do not call for continuous buying or selling during the life of the signal. For example, a BUY signal will probably (but not necessarily) return the best results if action is taken soon after the signal is generated. Additional opportunities for buying may be found as price zigzags higher, but the trader must look for optimum entry points. Conversely, exit points to preserve gains (or minimize losses) may be evident before the model mechanically closes the signal.
Helpful DecisionPoint Links:
DecisionPoint Shared ChartList and DecisionPoint Chart Gallery
Price Momentum Oscillator (PMO)
Swenlin Trading Oscillators (STO-B and STO-V)


