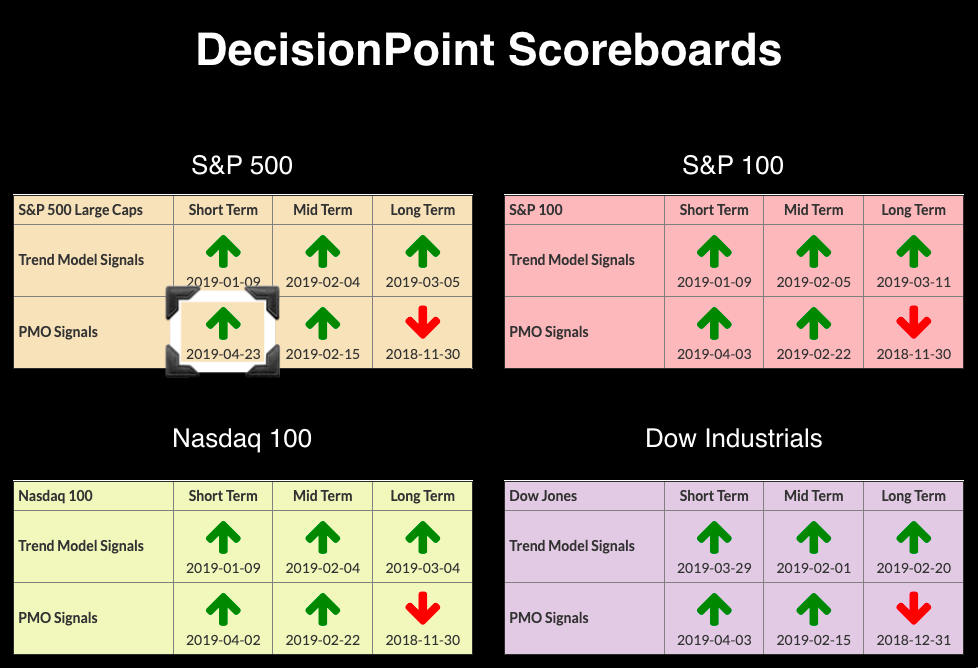
I had a feeling we would see a whipsaw right after I switched the SPX Scoreboard to a Price Momentum Oscillator (PMO) SELL Signal. The margin was incredibly thin between the PMO and its signal line. With today's rally and the market making its way to a new all-time closing high, I could see it was already moving back to a BUY. This one should stick.

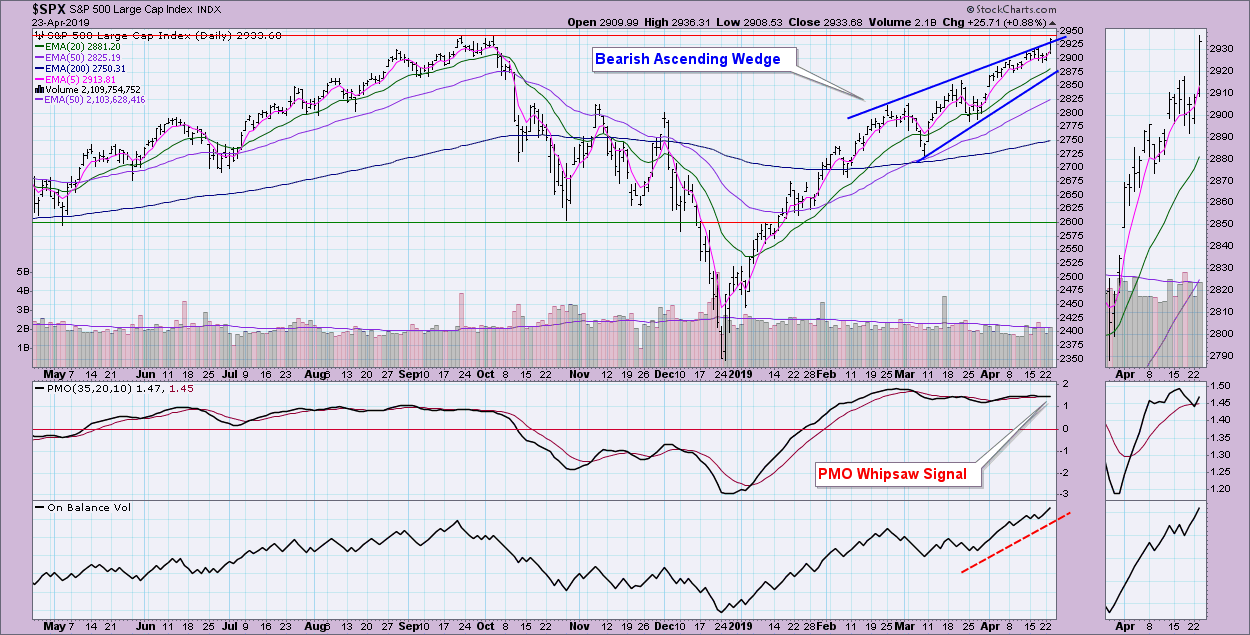
The daily chart is getting more bullish than it already was, as it appears the bearish ascending wedge will not play out with a breakdown. Today, price not only closed at an all-time high, but it also broke out above the bearish wedge. I always find bullish conclusions to bearish patterns to be especially positive. OBV is very strong, while price is following right along just as it's supposed to. The PMO may seem somewhat overbought, but it can stretch higher. The top of the normal PMO range is about +2.
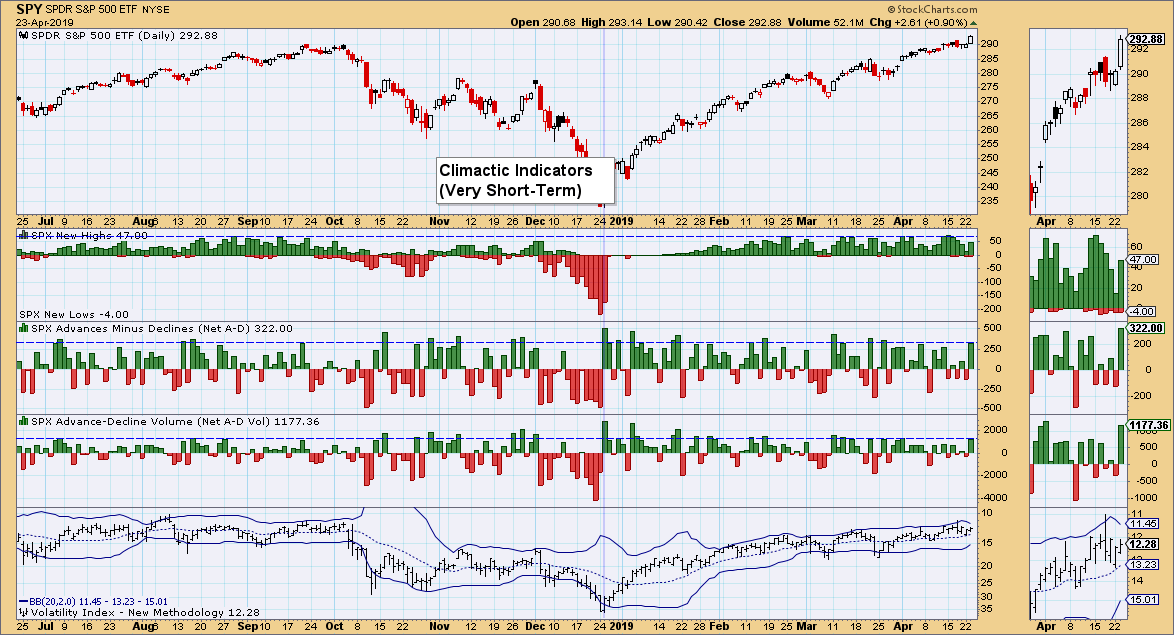
Breadth was climactic to the upside today, which has the earmarks of a buying initiation. The VIX settling near the center of the Bollinger Bands, above its MA, suggests we could see lower readings without puncturing the upper BB.
Conclusion: It isn't a done deal yet that this BUY signal will stick, but there are plenty of bullish implications to support follow-through on this rally. What could trip things up? Well, all-time highs are generally a source of strong resistance.
Watch the latest episode of DecisionPoint with Carl & Erin Swenlin LIVE on Fridays 4:30p EST, or on the StockCharts TV YouTube channel here!
Technical Analysis is a windsock, not a crystal ball.
Happy Charting!
- Erin
erinh@stockcharts.com
Helpful DecisionPoint Links:
DecisionPoint Shared ChartList and DecisionPoint Chart Gallery
Price Momentum Oscillator (PMO)
Swenlin Trading Oscillators (STO-B and STO-V)
**Don't miss DecisionPoint Commentary! Add your email below to be notified of new updates"**


