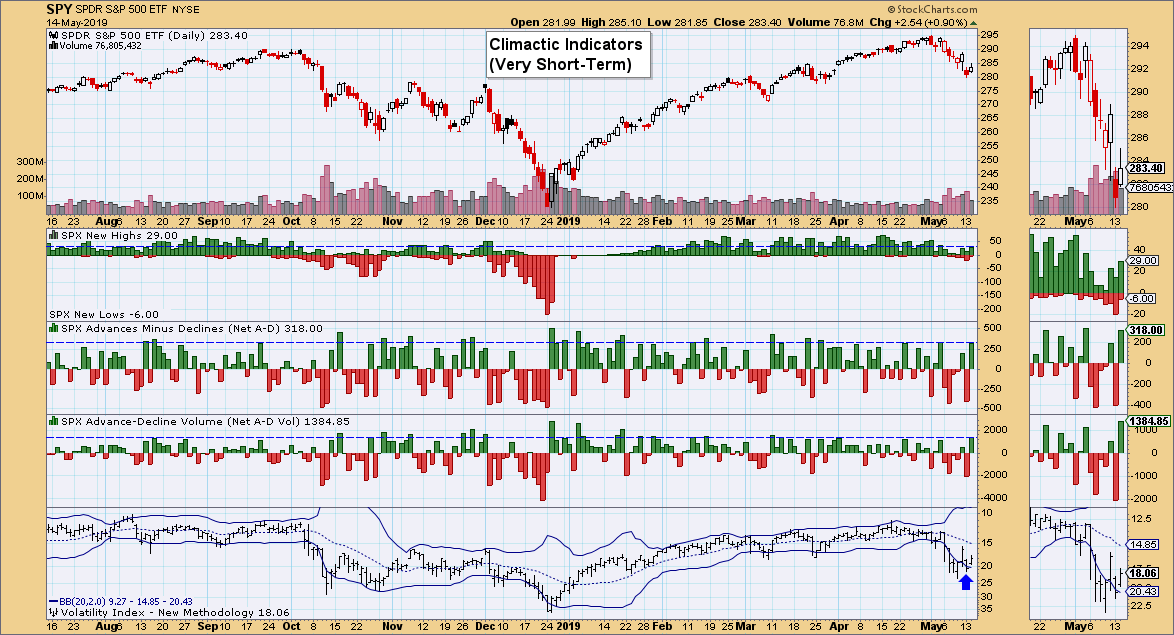
At present, it appears that the DecisionPoint climactic indicator chart could be suggesting a possible buying initiation. This is tricky. With volatility so high right now, often what appears to be an initiation isn't always the case. Climactic readings can persist, as we've seen with the $VIX.
The first item to notice is the $VIX on the chart below. I have the scale inverted so that very high readings appear "oversold." The Bollinger Band around the $VIX has expanded greatly, which is not a surprise given the wild swings right now. Notice that, before today, the lower Bollinger Band was penetrated a few times. This is what I was referring to as far as climactic readings persisting. Typically, a puncture of the lower BB is enough to get the positive price move to the upside. Yesterday's lower BB puncture and the climactic negative readings in breadth suggested a selling exhaustion. On the other hand, the $VIX is moving back into the band and we had climactic positive breadth readings today. You can see what happened previously in 2018 when breadth readings really stretched to the bearish side. Once that was resolved with positive climactic breadth readings, it marked a bottom.
Conclusion: I'm NOT suggesting we have hit a major reversal point here. What I am suggesting is that, over the next few days, we should see price follow-through on today's rally based on climactic breadth to the upside, along with the $VIX making its way back within the Bollinger Bands.
Watch the latest episode of DecisionPoint with Carl & Erin Swenlin LIVE on Fridays 4:30p EST or on the StockCharts TV YouTube channel here!
Technical Analysis is a windsock, not a crystal ball.
Happy Charting!
- Erin
erinh@stockcharts.com
Helpful DecisionPoint Links:
DecisionPoint Shared ChartList and DecisionPoint Chart Gallery
Price Momentum Oscillator (PMO)
Swenlin Trading Oscillators (STO-B and STO-V)
**Don't miss DecisionPoint Commentary! Add your email below to be notified of new updates"**


