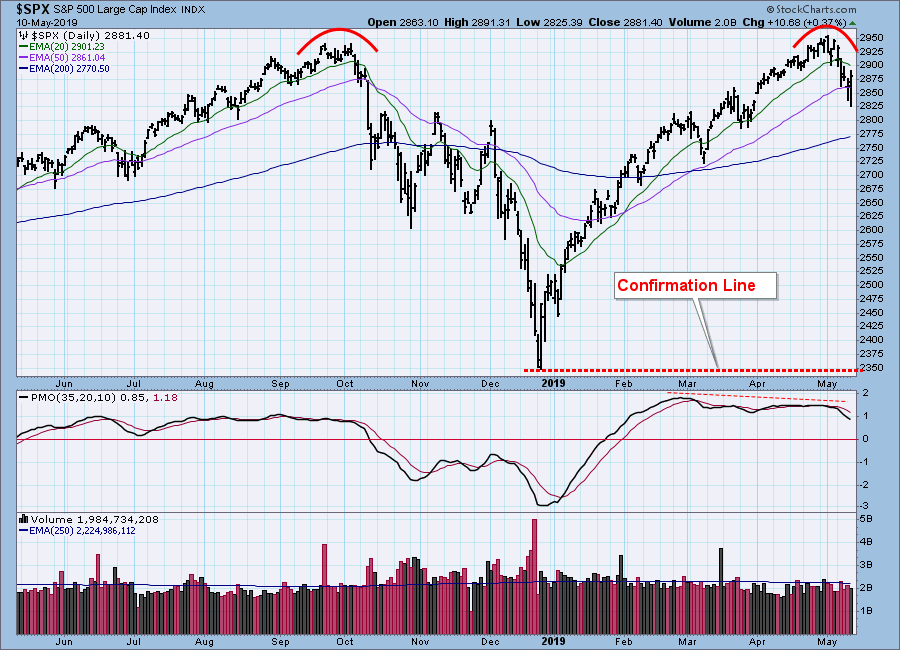
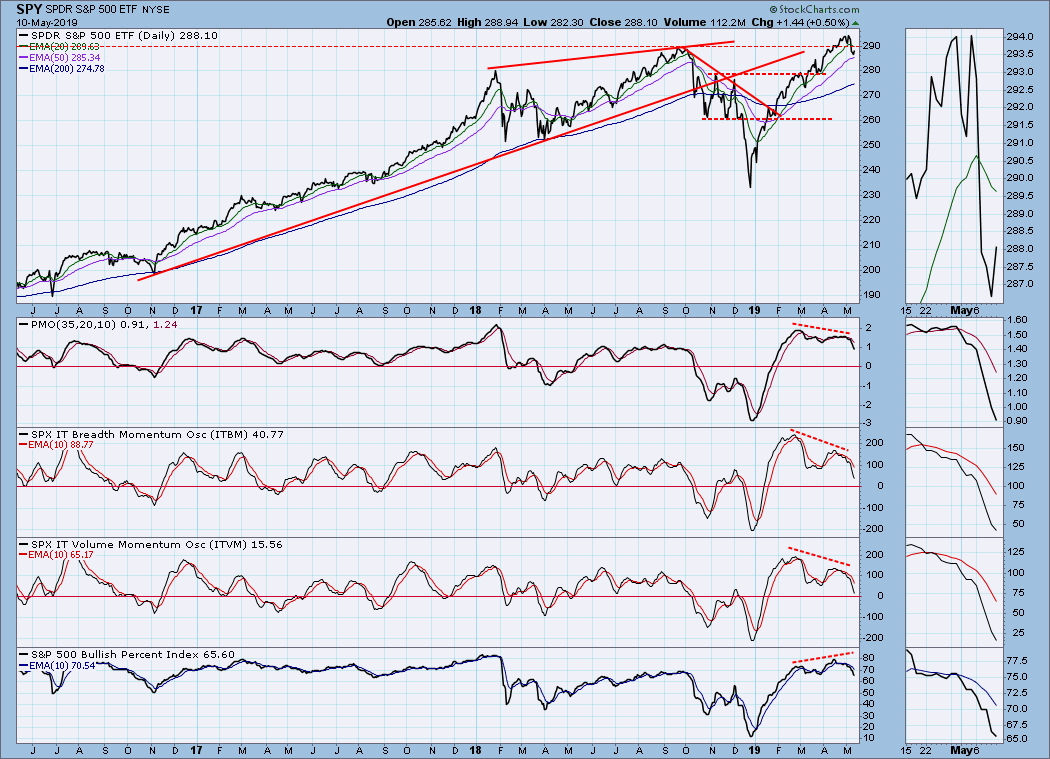
A few weeks ago, when the market began challenging the 2018 price highs, I pointed out that there was a potential for a double top. Since then, a second top has clearly formed, and the potential for more downside must be considered. The double top confirmation line is drawn across the low between the two tops, about -20% below the recent highs. If the confirmation line is violated, the double top pattern will 'execute' and infer another leg down of equal or greater magnitude, but that is way too far in the future to think about now. The potential for a continued decline from current levels is of more immediate interest.
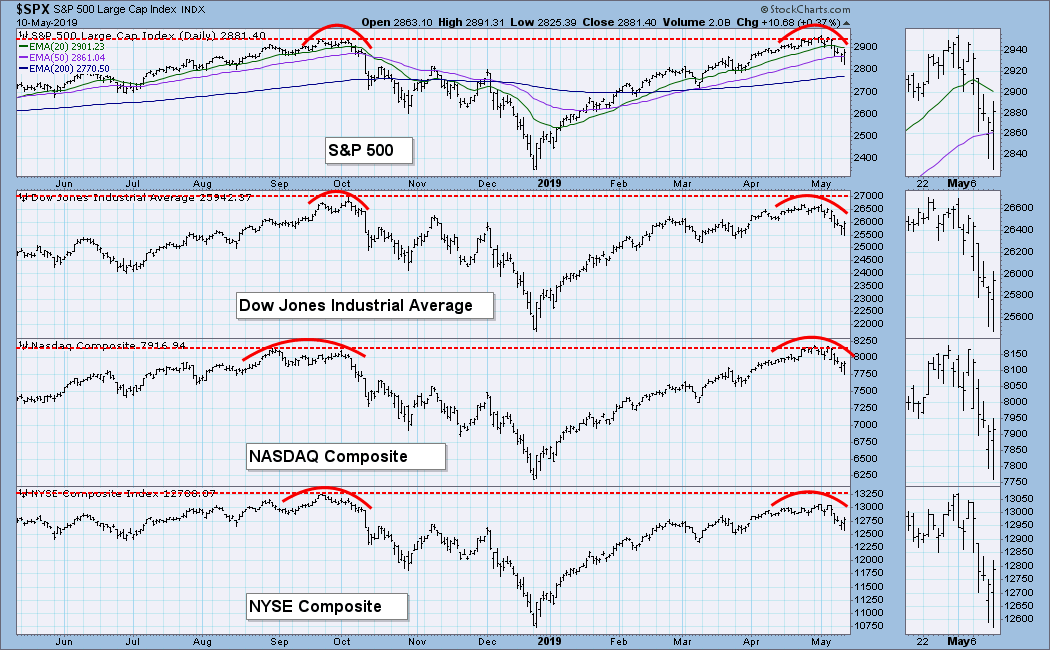
Looking at the other broad market indexes, we see a similar setup.
The DecisionPoint Weekly Wrap presents an end-of-week assessment of the trend and condition of the stock market (S&P 500), the U.S. Dollar, Gold, Crude Oil, and Bonds.
Watch the latest episode of DecisionPoint on StockCharts TV's YouTube channel here!
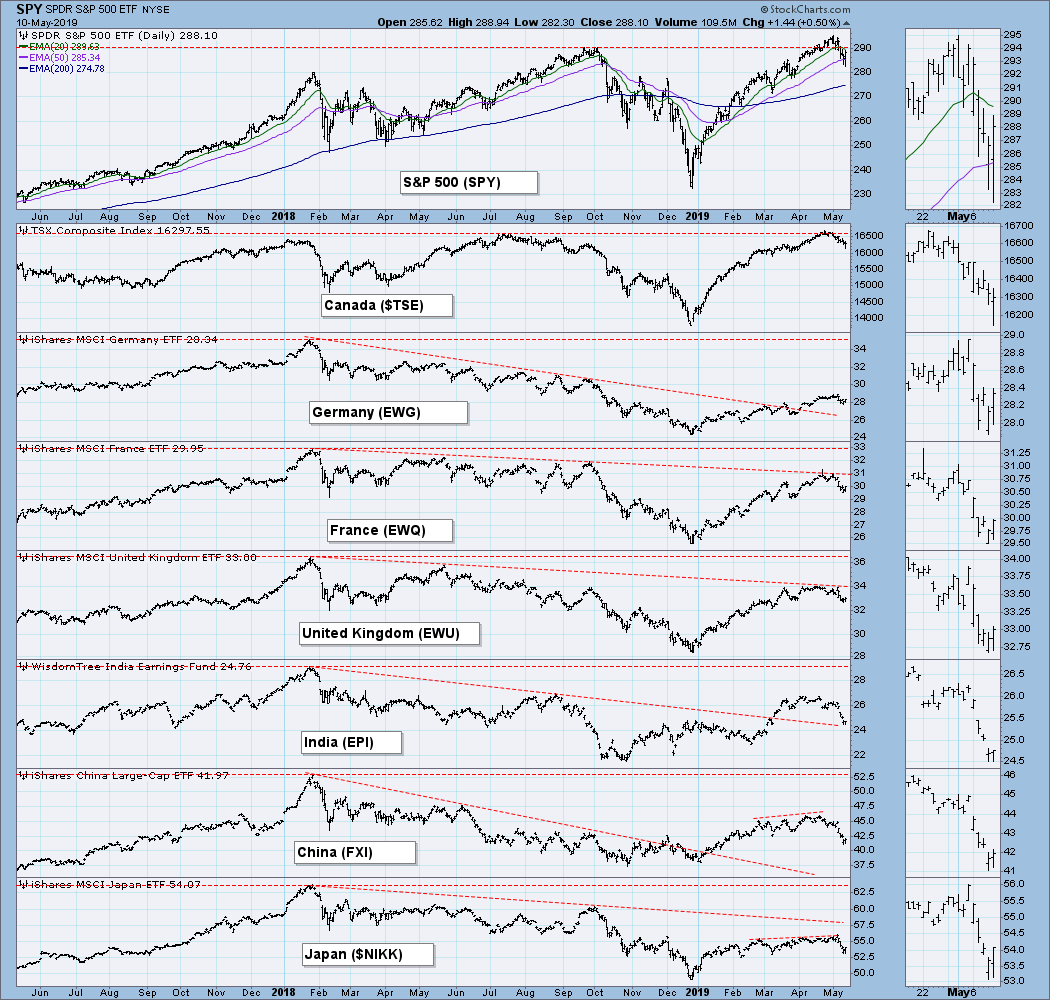
GLOBAL MARKETS
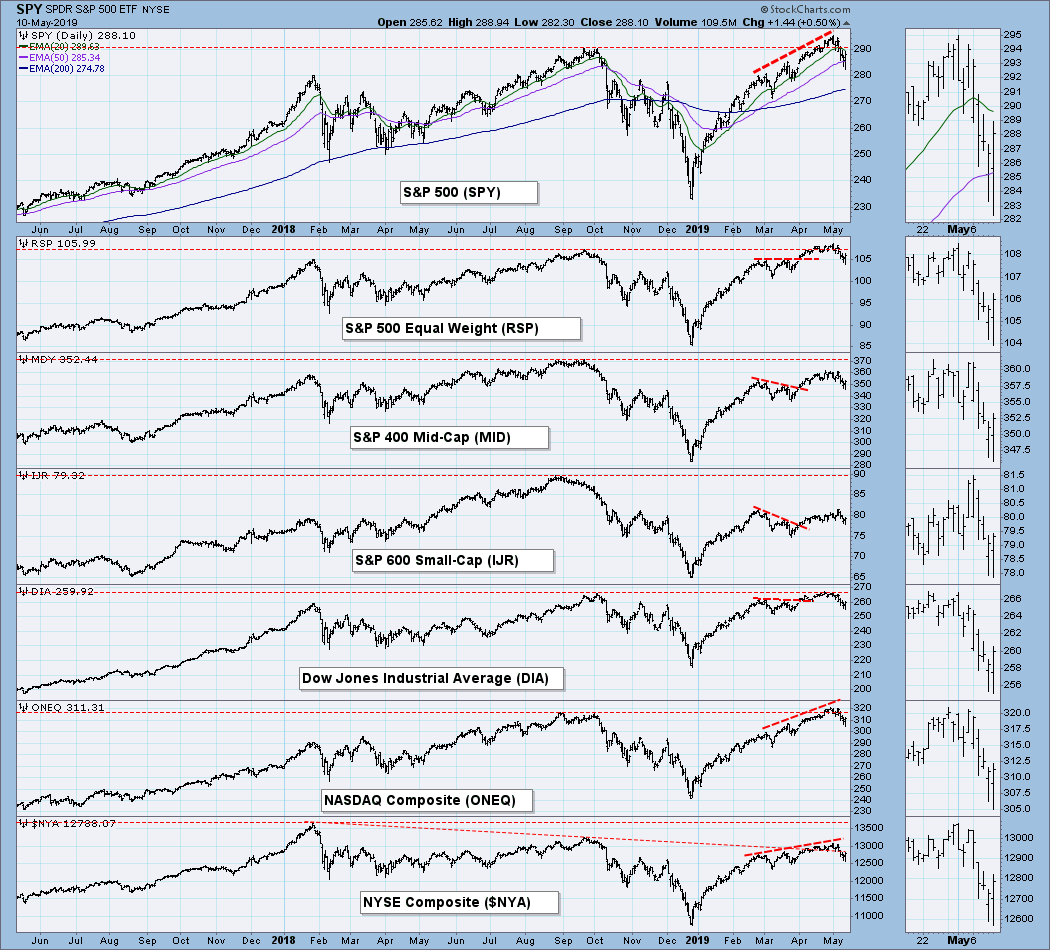
BROAD MARKET INDEXES
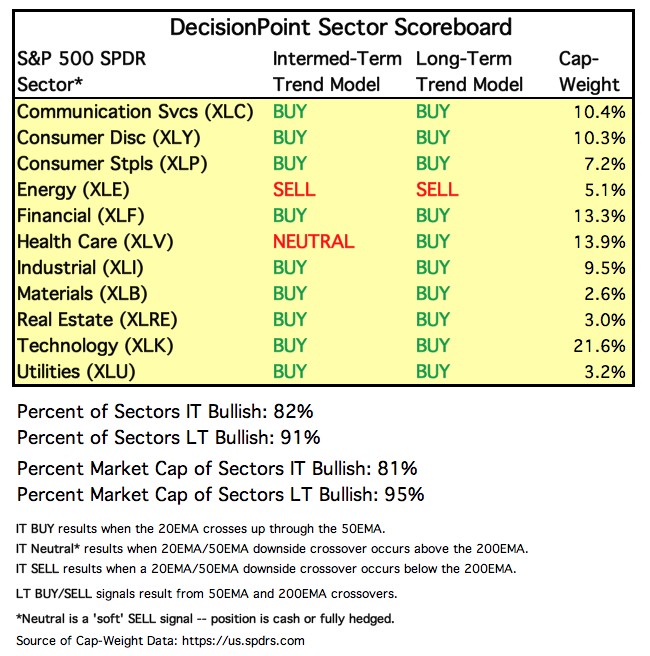
SECTORS
Each S&P 500 Index component stock is assigned to one, and only one, of 11 major sectors. This is a snapshot of the Intermediate-Term and Long-Term Trend Model signal status for those sectors.
STOCKS
IT Trend Model: BUY as of 2/1/2019
LT Trend Model: BUY as of 2/26/2019
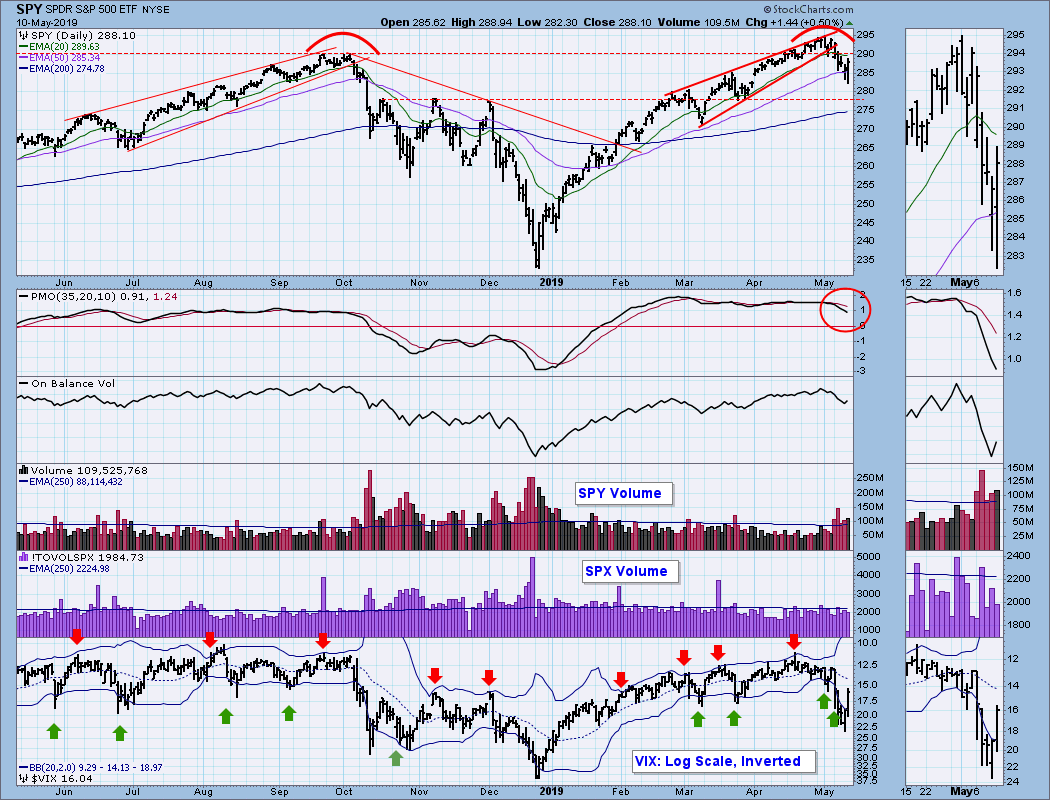
SPY Daily Chart: The market has declined about -4.6% from the May 1 top, and intraday swings are obviously initiated by news. Nevertheless, the technical structure isn't particularly favorable, with price having advanced relentlessly and substantially from the December lows into a double top. It's time for a pause to refresh.
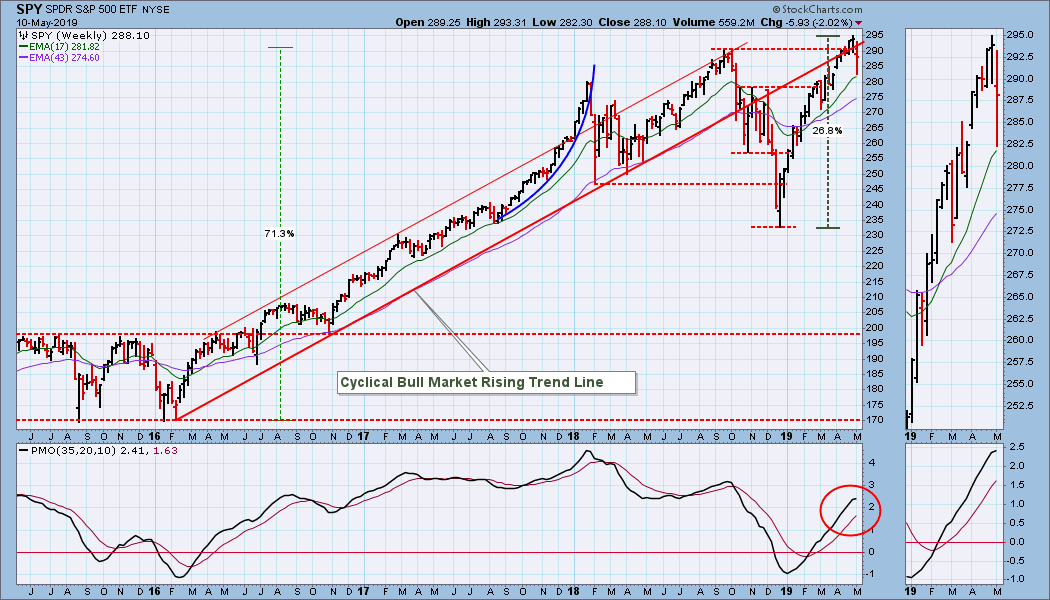
SPY Weekly Chart: The weekly PMO is about to top, and that would be particularly negative.
Climactic Market Indicators: There were negative climactic readings for net breadth and net volume on Wednesday, but the VIX was most interesting as it forced the Bollinger Bands apart.
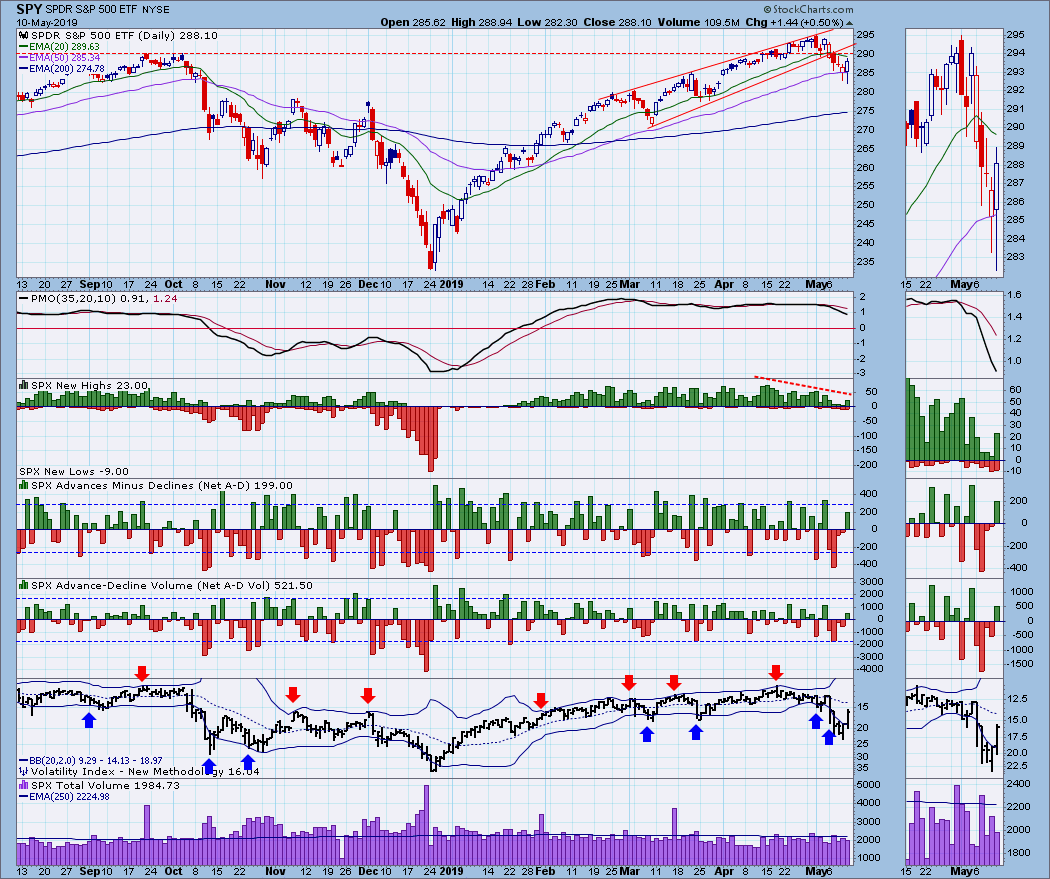
Short-Term Market Indicators: The STO-B and STO-V are finally reaching actual oversold readings based upon most of their range of the last year.

Intermediate-Term Market Indicators: The persistent negative divergences have finally delivered on their promises of lower prices, but the ITBM and ITVM are nearly at bull market oversold levels.
CONCLUSION: The stock market has been strongly whipped around by trade talk news, and I don't think we are going to see any relief from that in the near future. Tariffs were imposed by the U.S. on Friday, and some kind of retaliatory action from the Chinese will probably hit the market soon, if not next week. The developing double top structure is the most pressing technical issue, and on the chart immediately above the indicators allow plenty of room for things to go wrong in that regard. Based upon the VIX structure, we were certainly entitled to Friday's bounce, but that does not translate into the decline being over.
REMINDER: Options expiration takes place at the end of next week, and, absent unusual external events, we normally expect low volatility. It is not an end-of-quarter expiration, so volume on Friday next week should be normal.
PUBLICATION NEXT WEEK: Because of a scheduling conflict, the DP Weekly Wrap won't be published on Friday night (May 17), but will instead will be published on Saturday or Sunday.
DOLLAR (UUP)
IT Trend Model: BUY as of 2/7/2019
LT Trend Model: BUY as of 5/25/2018
UUP Daily Chart: A rising wedge dominates, but there is plenty of room for it to continue upward. The daily PMO is below the signal line and falling.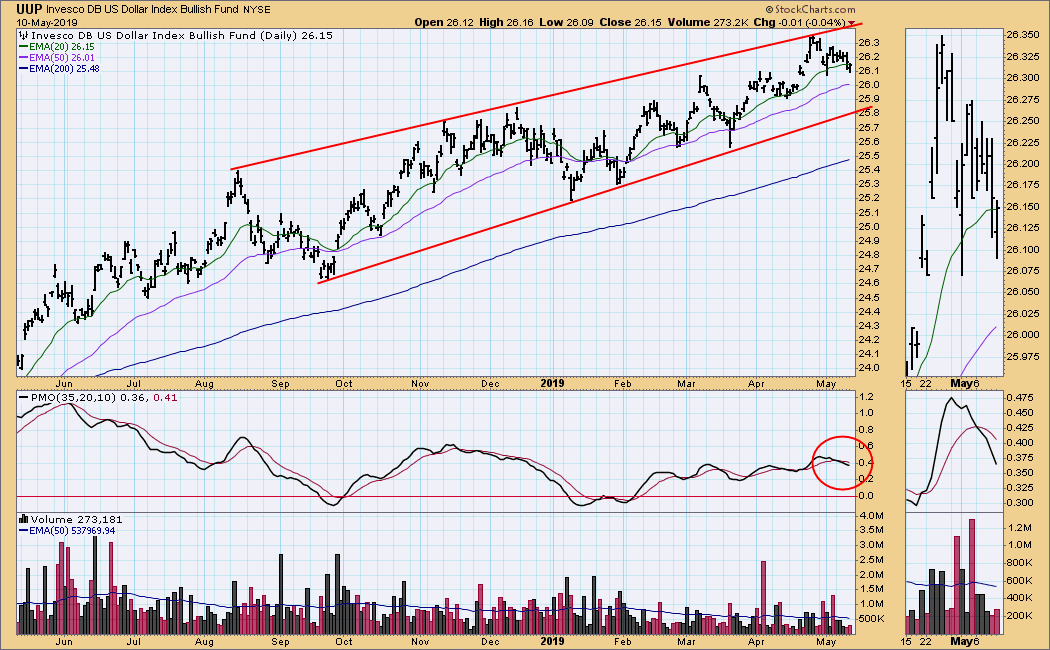
UUP Weekly Chart: Price is approaching long-term overhead resistance.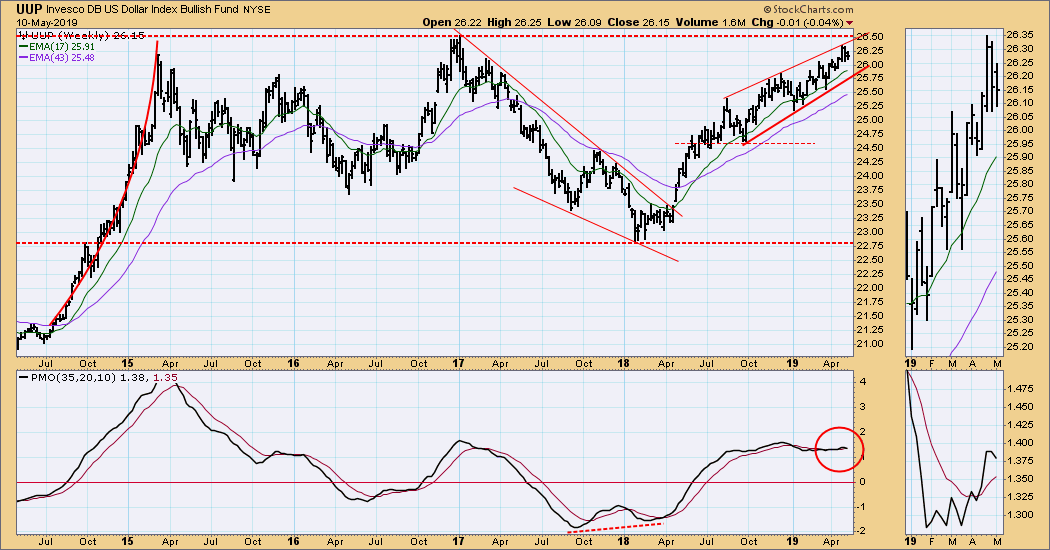
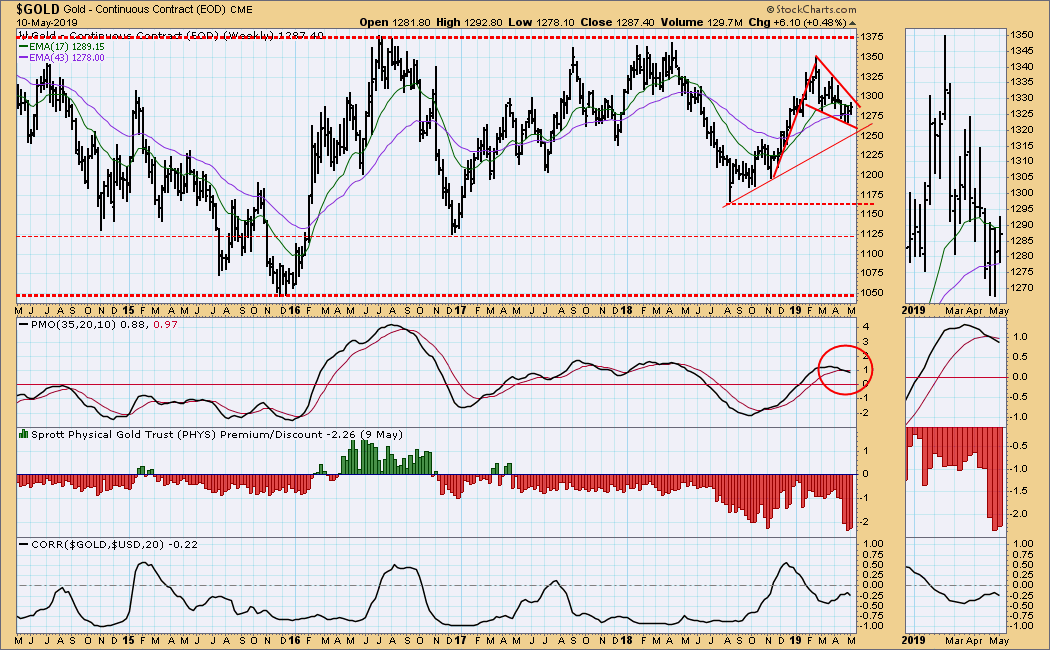
GOLD
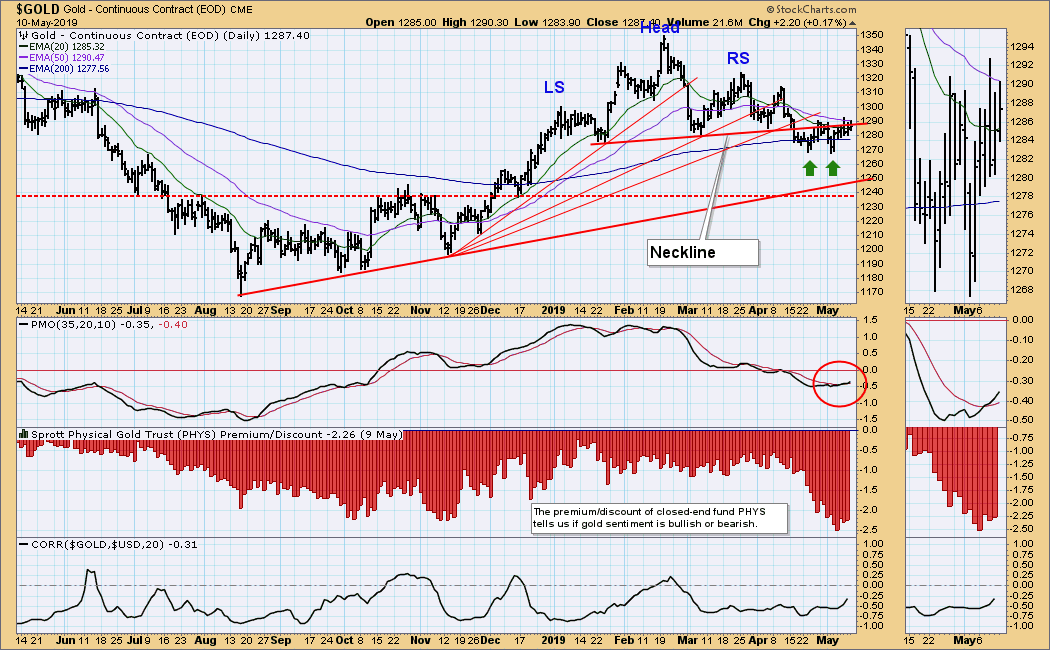
IT Trend Model: NEUTRAL as of 4/16/2019
LT Trend Model: BUY as of 1/8/2019
GOLD Daily Chart: After breaking down through the head and shoulders neckline, gold has now formed a double bottom just below the neckline. The daily PMO is above the signal line and rising. Looking positive.
GOLD Weekly Chart: The weekly PMO is configured negatively, but price has formed a bullish pennant. Looking positive.
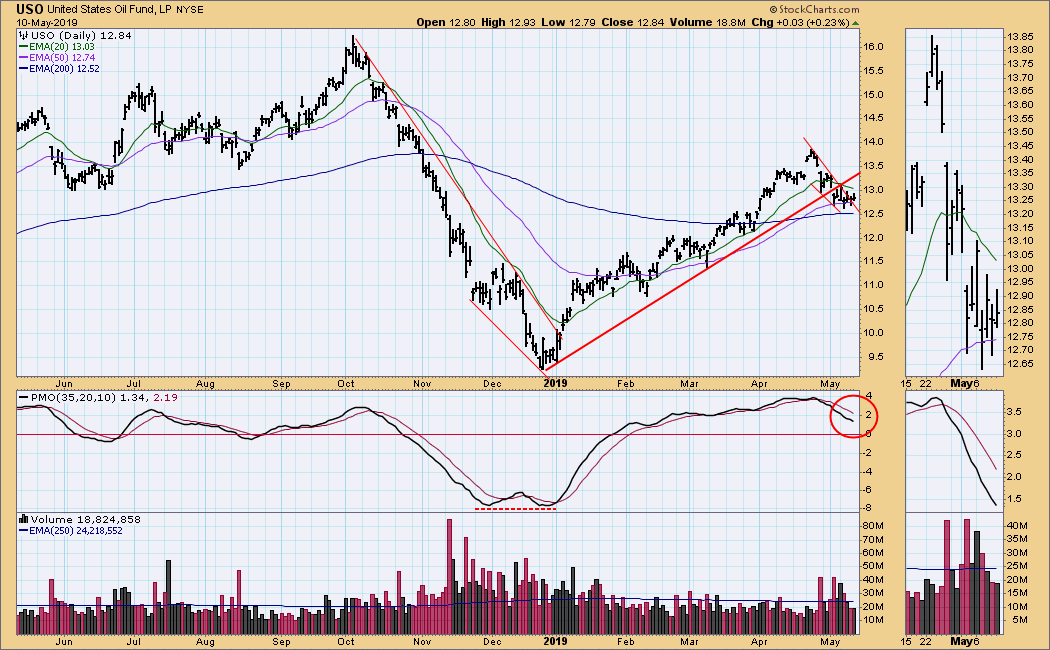
CRUDE OIL (USO)
IT Trend Model: BUY as of 2/19/2019
LT Trend Model: BUY as of 4/17/2019
USO Daily Chart: Price has moved through the top of the falling wedge, as expected, but it was a sideways 'default' rather than a breakout.
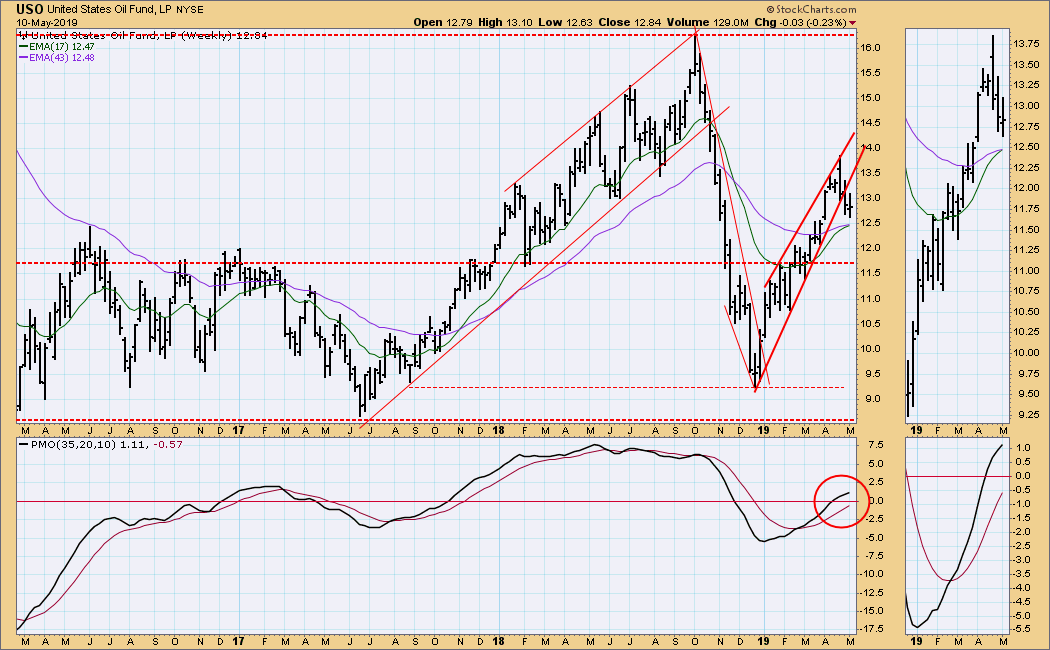
USO Weekly Chart: The weekly PMO is decelerating and possibly getting ready to top.
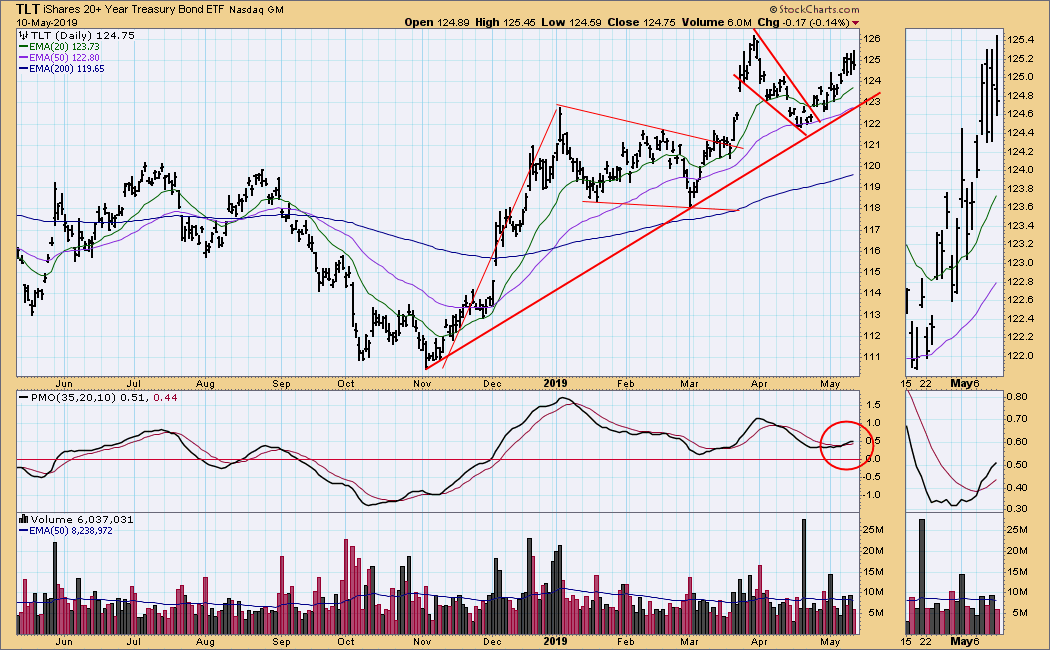
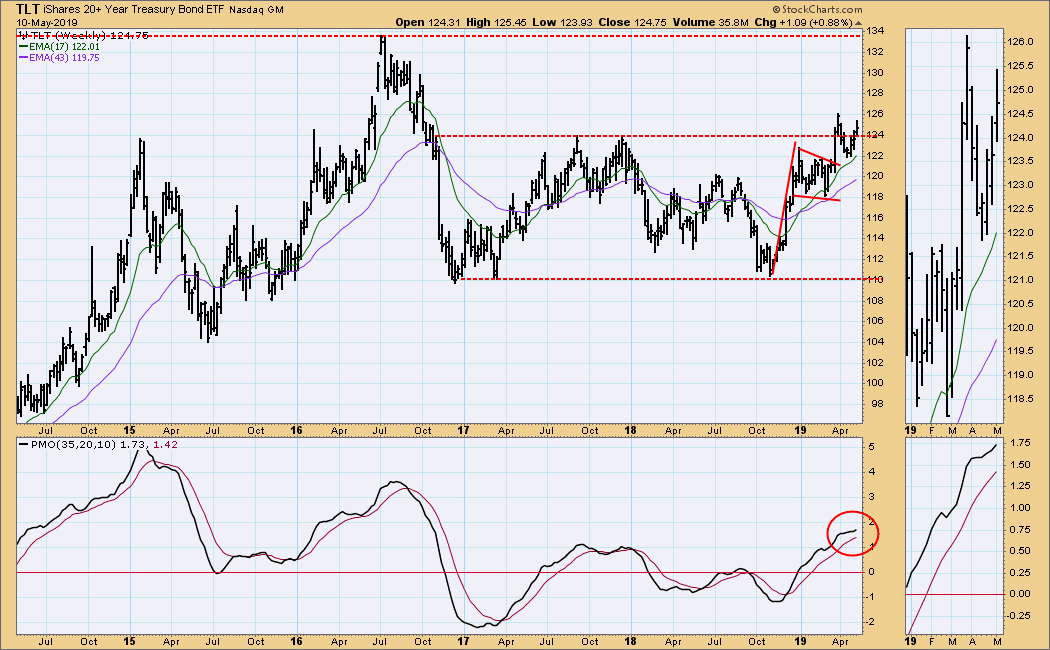
BONDS (TLT)
IT Trend Model: BUY as of 12/6/2018
LT Trend Model: BUY as of 1/2/2019
TLT Daily Chart: Several weeks ago price broke out of a falling wedge and has been moving higher at about the same rate as it fell within the wedge.
TLT Weekly Chart: Positive within this time frame. I doubt that the upside potential will exceed the 2016 top.
**Don't miss any of the DecisionPoint commentaries! Go to the "Notify Me" box toward the end of this blog page to be notified as soon as they are published.**
Technical Analysis is a windsock, not a crystal ball.
Happy Charting!
- Carl
NOTE: The signal status reported herein is based upon mechanical trading model signals, specifically, the DecisionPoint Trend Model. They define the implied bias of the price index based upon moving average relationships, but they do not necessarily call for a specific action. They are information flags that should prompt chart review. Further, they do not call for continuous buying or selling during the life of the signal. For example, a BUY signal will probably (but not necessarily) return the best results if action is taken soon after the signal is generated. Additional opportunities for buying may be found as price zigzags higher, but the trader must look for optimum entry points. Conversely, exit points to preserve gains (or minimize losses) may be evident before the model mechanically closes the signal.
Helpful DecisionPoint Links:
DecisionPoint Shared ChartList and DecisionPoint Chart Gallery
Price Momentum Oscillator (PMO)
Swenlin Trading Oscillators (STO-B and STO-V)


