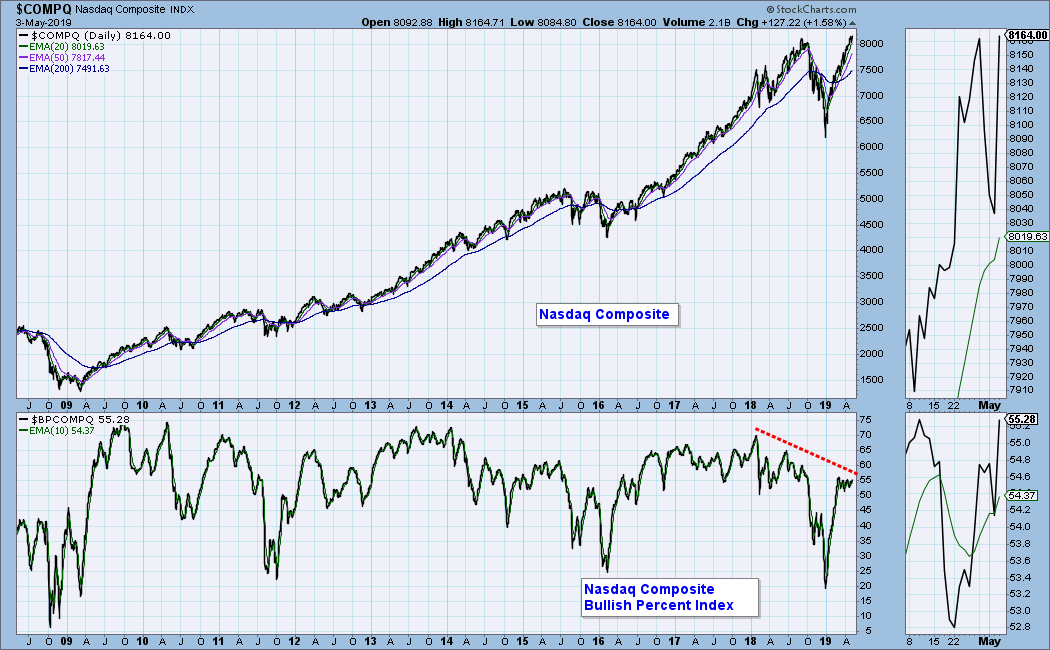
This week the Nasdaq Composite Index closed at a new, all-time high, but the Bullish Percent Index (BPI) is a long way from confirming that. The BPI is the percentage of Nasdaq Composite stocks that are on point and figure BUY signals, and Friday's reading is 55%. That is significantly lower than the two previous BPI tops in 2018 -- one was 70% and the other was 65%. The result is a strong negative divergence against the rising tops of the price index, and that says that the participation supporting the market advance is pretty thin.
The DecisionPoint Weekly Wrap presents an end-of-week assessment of the trend and condition of the stock market (S&P 500), the U.S. Dollar, Gold, Crude Oil, and Bonds.
Watch the latest episode of DecisionPoint on StockCharts TV's YouTube channel here!
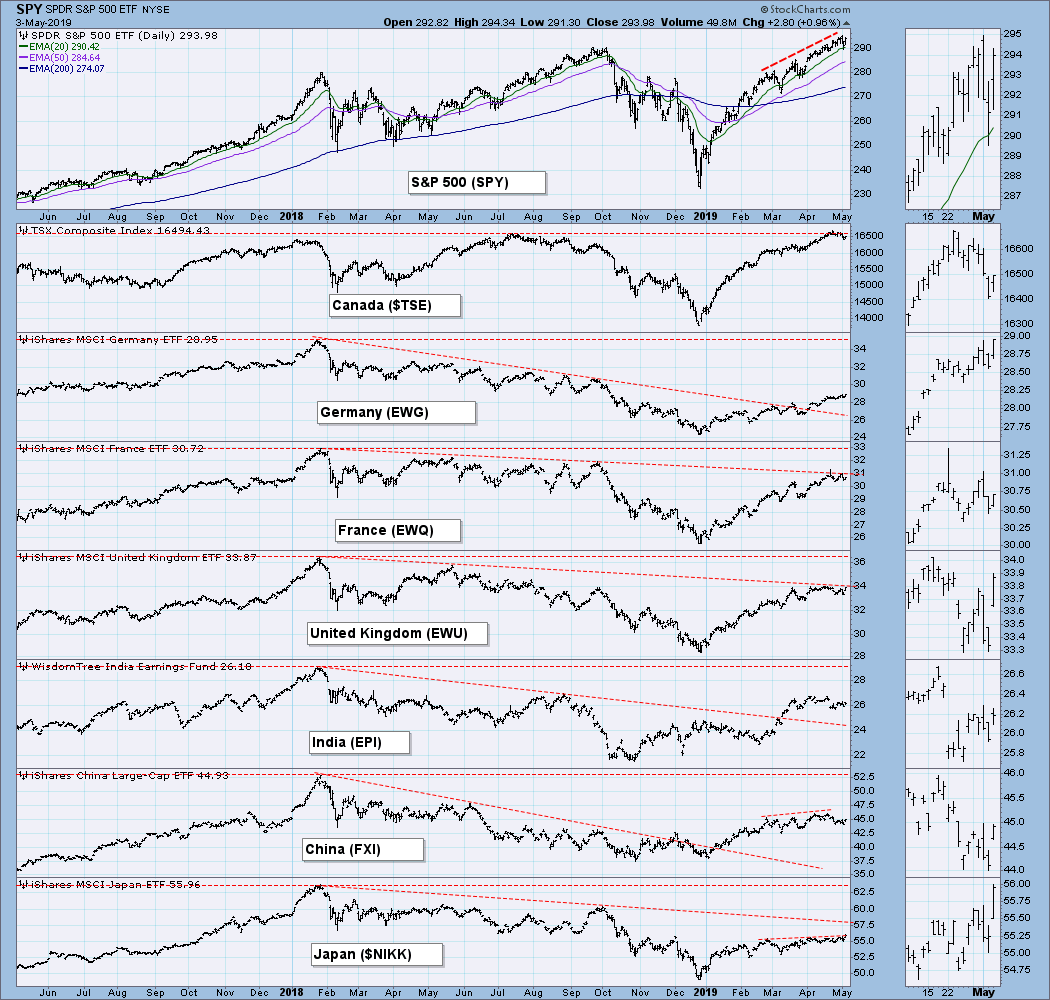
GLOBAL MARKETS
Only Canada is keeping up with the S&P 500.
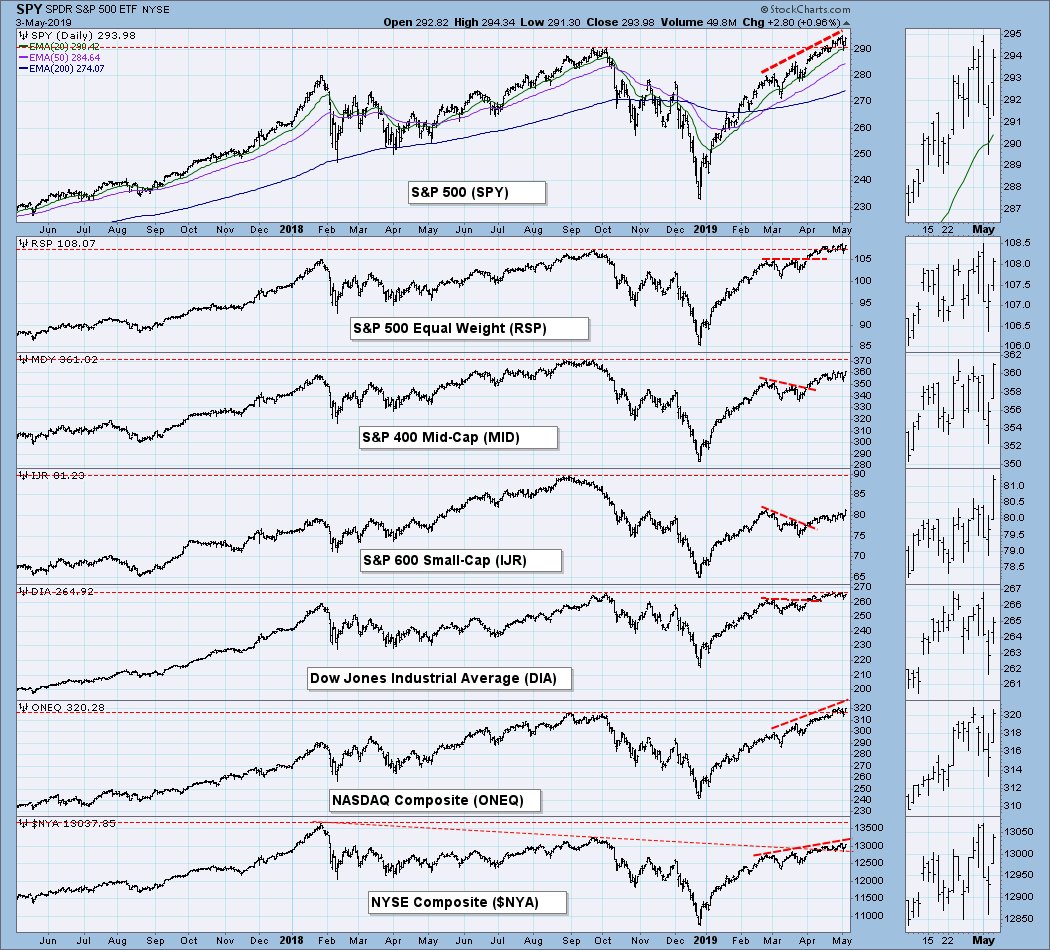
BROAD MARKET INDEXES
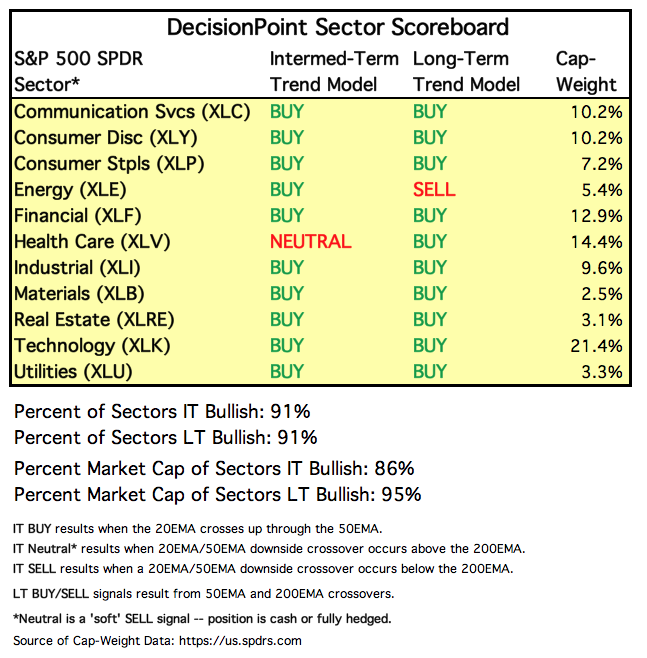
SECTORS
Each S&P 500 Index component stock is assigned to one, and only one, of 11 major sectors. This is a snapshot of the Intermediate-Term and Long-Term Trend Model signal status for those sectors.
STOCKS
IT Trend Model: BUY as of 2/1/2019
LT Trend Model: BUY as of 2/26/2019
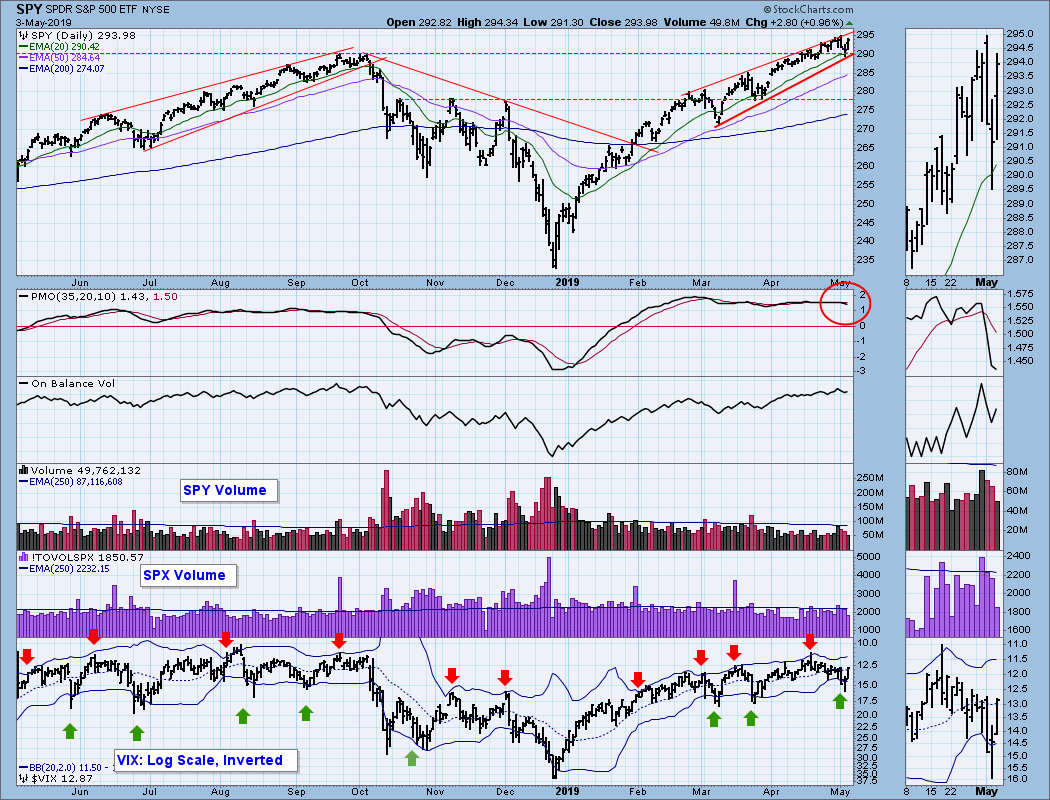
SPY Daily Chart: There was just an itty-bitty pullback on Thursday, and there was zero follow through on Friday. Price remains in the rising wedge formation, which we expect to resolve downward.
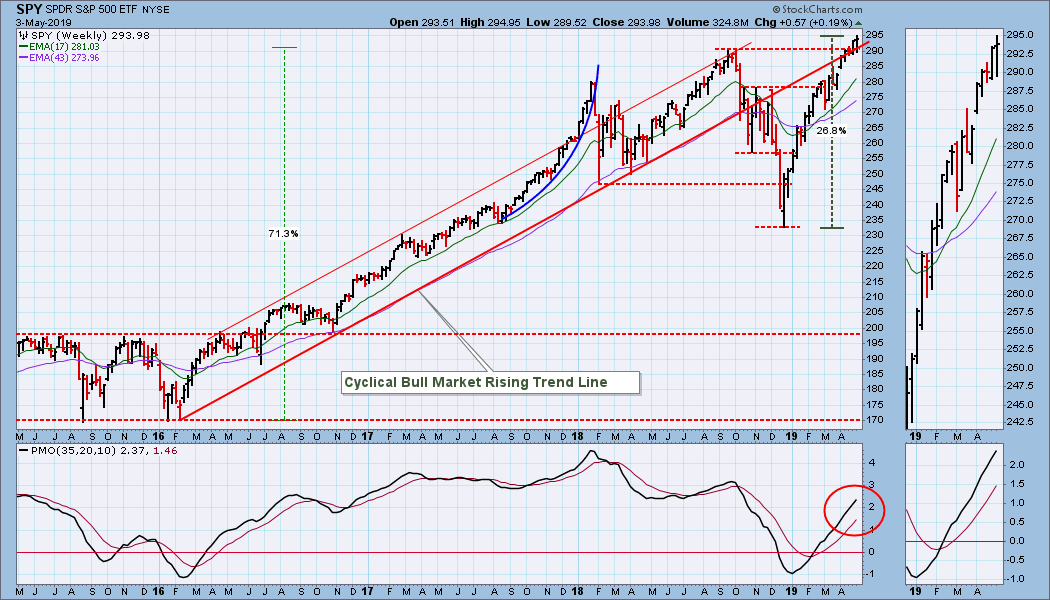
SPY Weekly Chart: The weekly PMO is very strong as the market keeps setting records.
Climactic Market Indicators: There was a downside exhaustion climax on Wednesday, and an upside exhaustion climax on Friday, but the price moves on those days were small, so the implications were not far reaching. The VIX penetrated the lower Bollinger Band on Wednesday and Thursday. I thought we might finally see higher volatility and an expansion of the bands, but no.
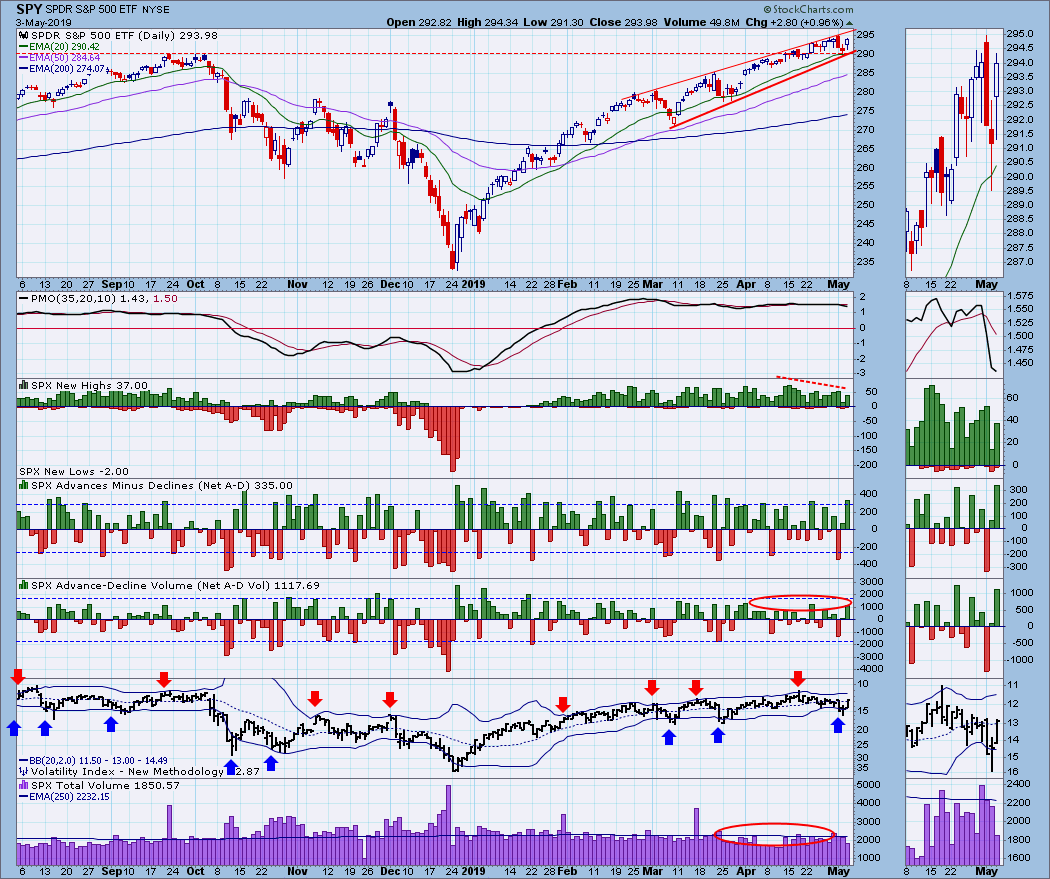
Short-Term Market Indicators: Persistent negative divergences.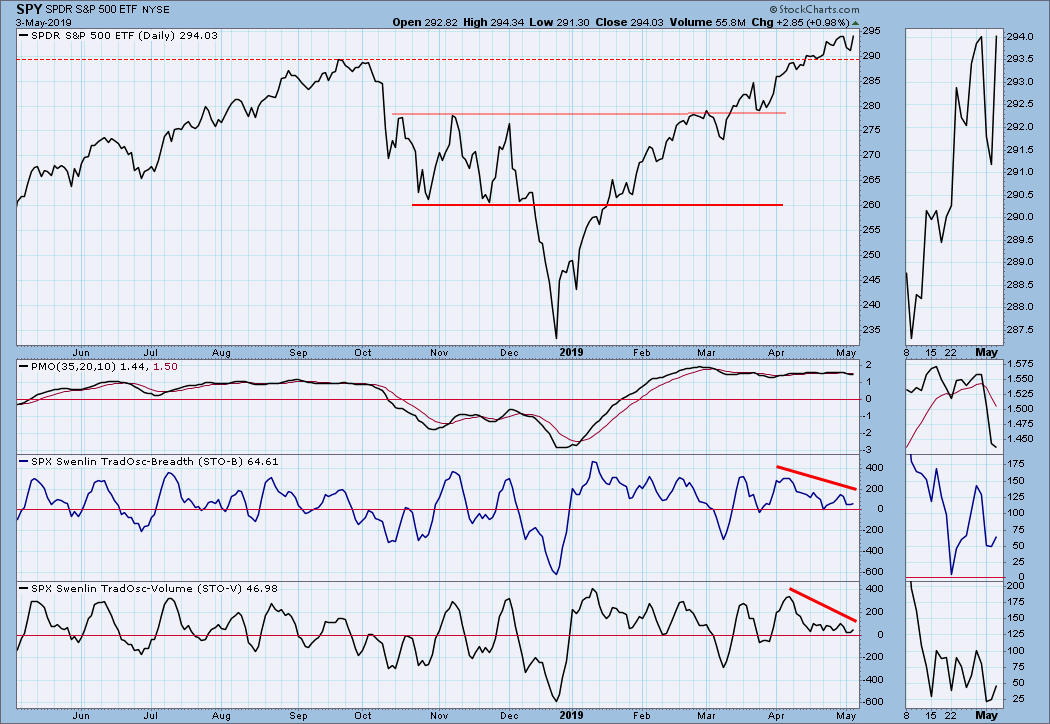 Intermediate-Term Market Indicators: Significant negative divergences persist across the February and April indicator tops. While the SPX Bullish Percent Index (BPI) confirms those price tops, I notice that, like the other indicators, it shows some internal erosion from the April indicator top.
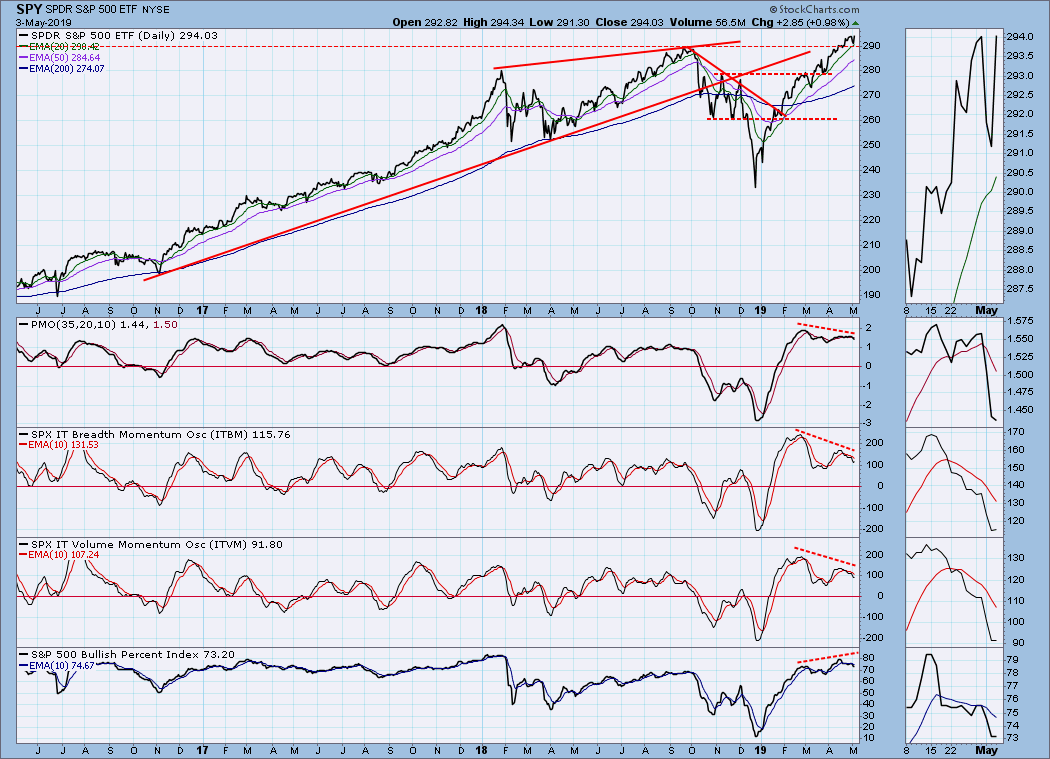
CONCLUSION: Primarily following the S&P 500 and its indicators, as I do, can result in overlooking problems that exist in the less "royal" parts of the market. Certainly, the Nasdaq BPI, discussed at the beginning of this article, is an excellent case in point. I was stunned by how sharp a divergence actually exists. Then there are the negative divergences on the chart immediately above that I have been flogging for about a month. The relentless rally can't help but cause me to doubt my "lyin' eyes," but the divergences are there, and we need to be on our guard. While all we hear now is good news, rest assured that, if the market starts down, we'll hear all the bad news that currently doesn't fit the narrative.
DOLLAR (UUP)
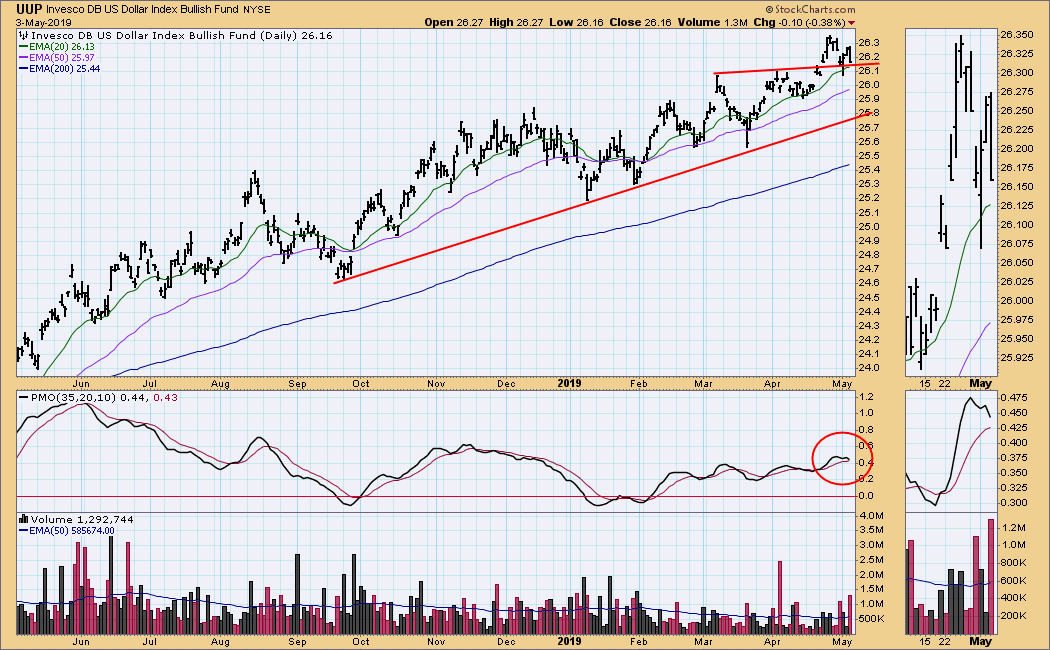
IT Trend Model: BUY as of 2/7/2019
LT Trend Model: BUY as of 5/25/2018
UUP Daily Chart: Price broke out of the rising wedge last week, but this week it chopped downward.
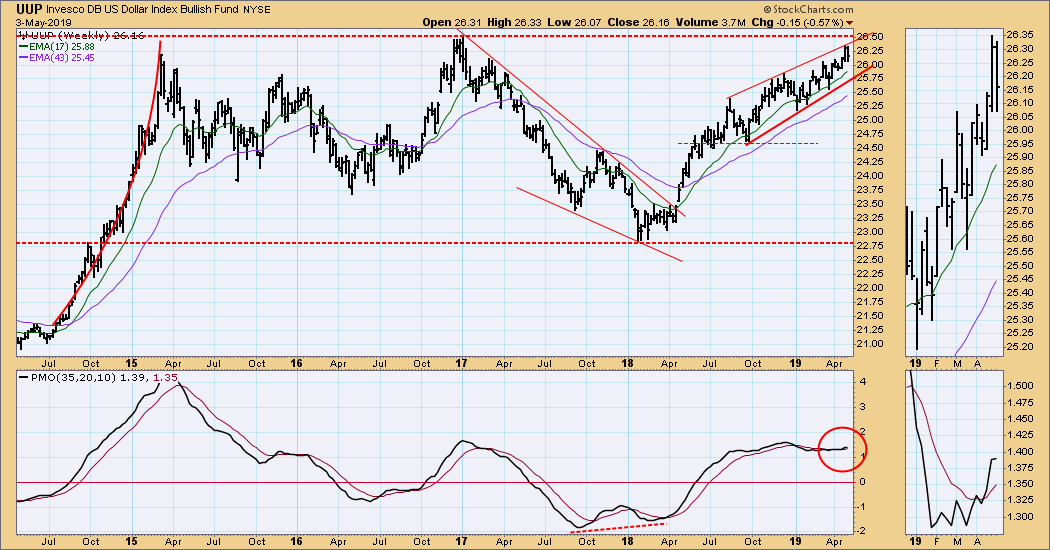
UUP Weekly Chart: Price is still inside the rising wedge in this time frame, but significant overhead resistance is just ahead.
GOLD
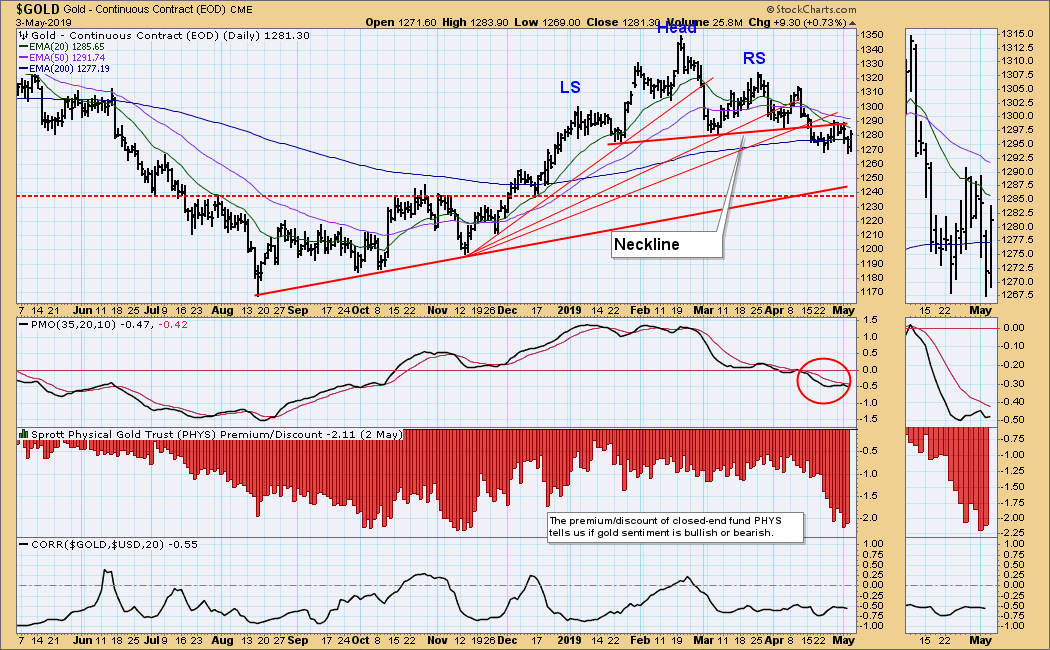
IT Trend Model: NEUTRAL as of 4/16/2019
LT Trend Model: BUY as of 1/8/2019
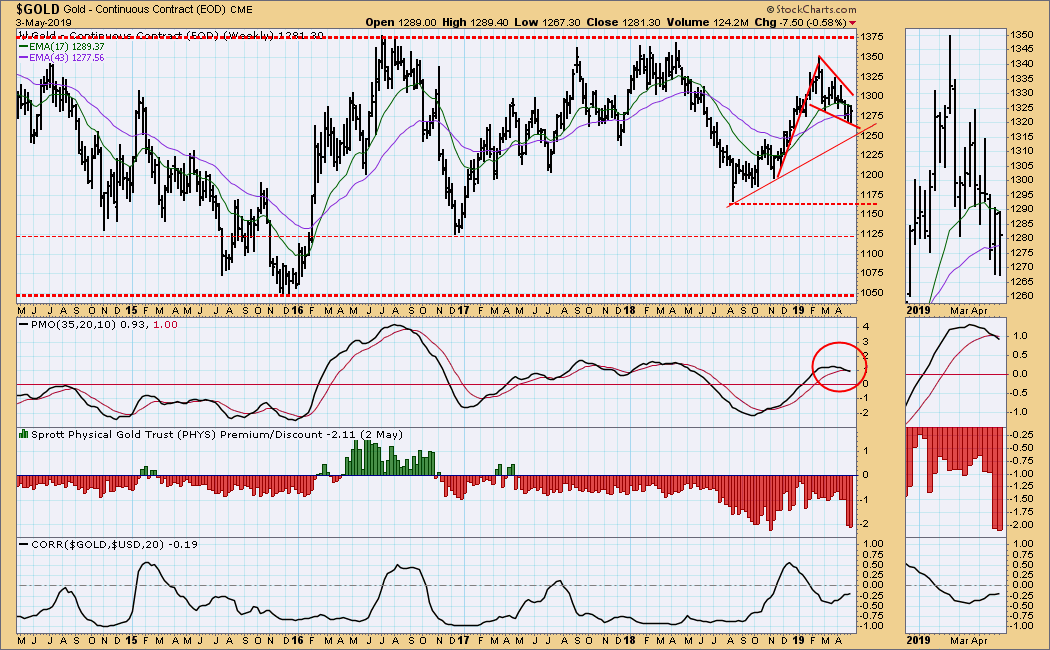
GOLD Daily Chart: The head and shoulders neckline was violated three weeks ago. After a short decline, price bounced back toward the point of breakdown, but, instead of resuming the decline, price seems to be consolidating below the neckline.
GOLD Weekly Chart: In this time frame price has formed a flag/pennant, which we normally expect to resolve upward; however, the weekly PMO is below the signal line and falling, and sentiment is still very bearish.
CRUDE OIL (USO)
IT Trend Model: BUY as of 2/19/2019
LT Trend Model: BUY as of 4/17/2019
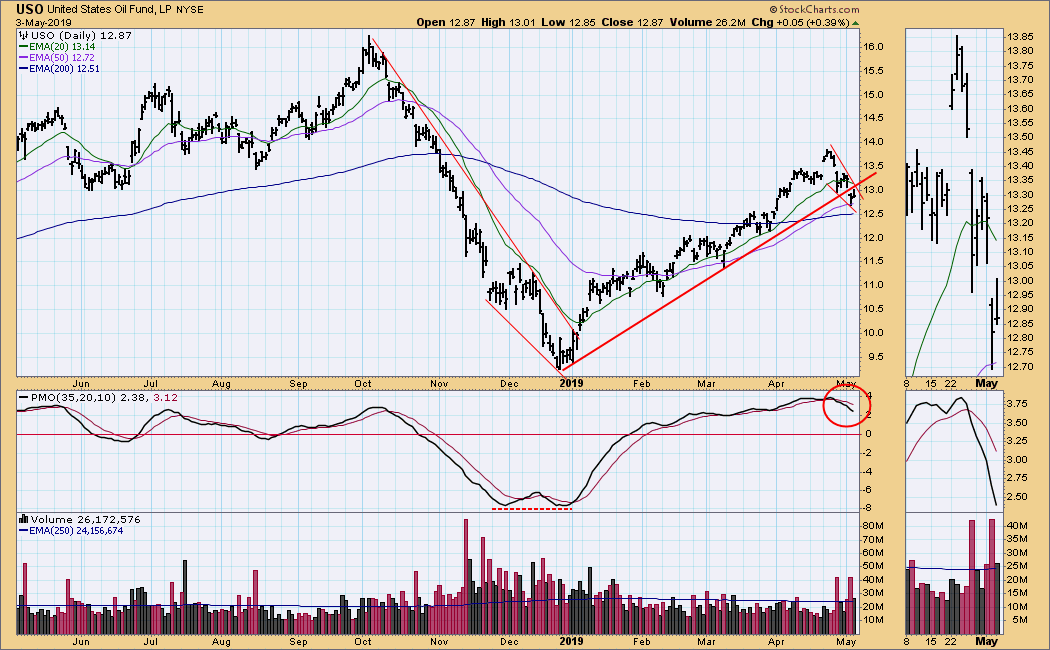
USO Daily Chart: The rising trend line was violated on Thursday, but price has formed a falling wedge since last week's price top, which is short-term bullish; however, the daily PMO is negative, below the signal line and falling from overbought levels.
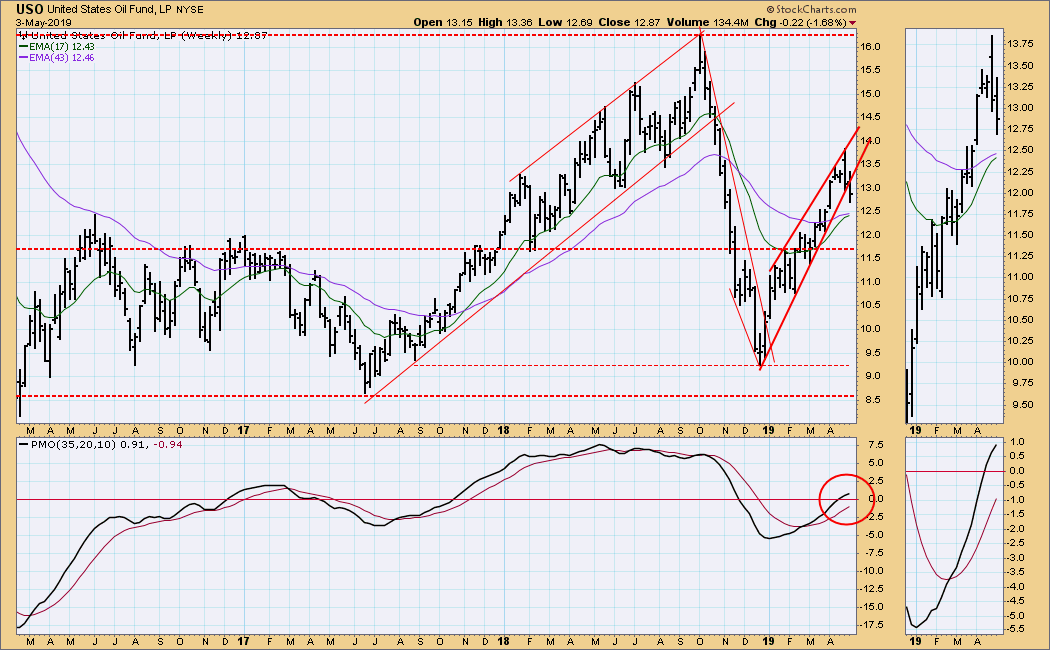
USO Weekly Chart: The rising wedge has resolved downward, as expected; however, we don't know if there will be downside follow through.
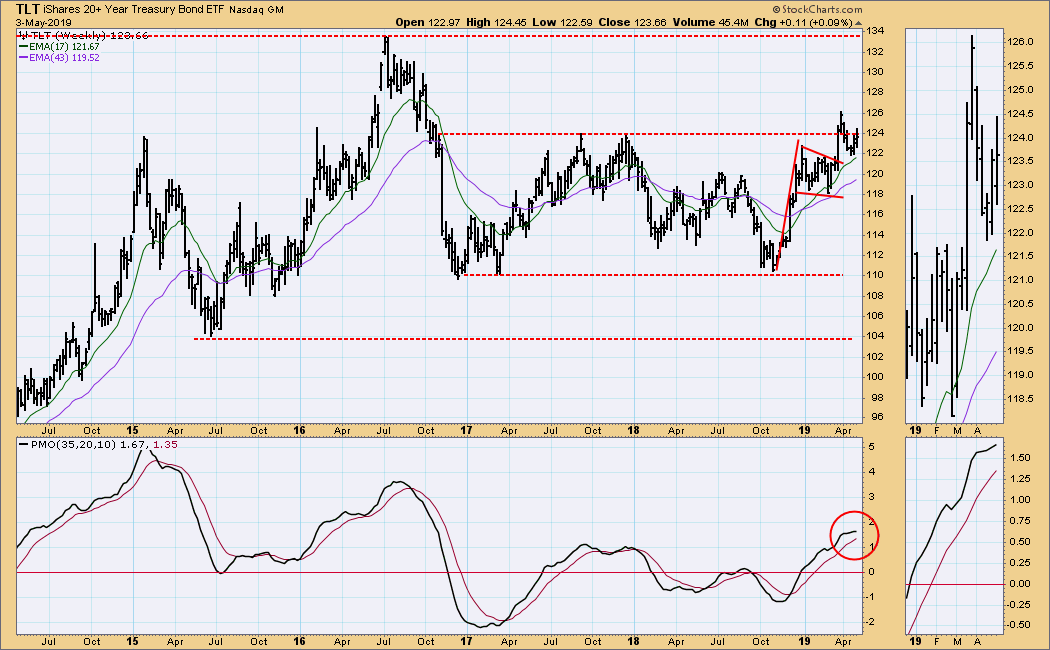
BONDS (TLT)
IT Trend Model: BUY as of 12/6/2018
LT Trend Model: BUY as of 1/2/2019
TLT Daily Chart: In March TLT broke out of a large flag formation and made a new high soon after. Following a late-March price top price pulled back toward the point of breakout, then resumed its advance before reaching the rising trend line drawn from the November low. The daily PMO is positive but flat, indicating a small upward momentum.
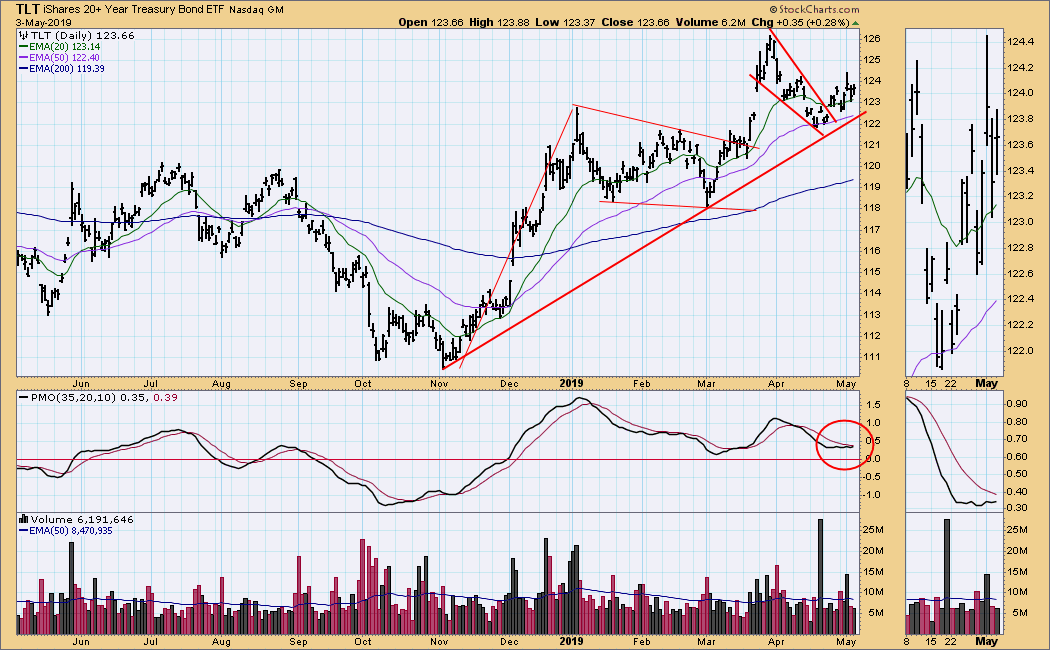
TLT Weekly Chart: The weekly chart provides a better context, and we can see that horizontal resistance is interfering with the advance.
**Don't miss any of the DecisionPoint commentaries! Go to the "Notify Me" box toward the end of this blog page to be notified as soon as they are published.**
Technical Analysis is a windsock, not a crystal ball.
Happy Charting!
- Carl
NOTE: The signal status reported herein is based upon mechanical trading model signals, specifically, the DecisionPoint Trend Model. They define the implied bias of the price index based upon moving average relationships, but they do not necessarily call for a specific action. They are information flags that should prompt chart review. Further, they do not call for continuous buying or selling during the life of the signal. For example, a BUY signal will probably (but not necessarily) return the best results if action is taken soon after the signal is generated. Additional opportunities for buying may be found as price zigzags higher, but the trader must look for optimum entry points. Conversely, exit points to preserve gains (or minimize losses) may be evident before the model mechanically closes the signal.
Helpful DecisionPoint Links:
DecisionPoint Shared ChartList and DecisionPoint Chart Gallery
Price Momentum Oscillator (PMO)
Swenlin Trading Oscillators (STO-B and STO-V)


