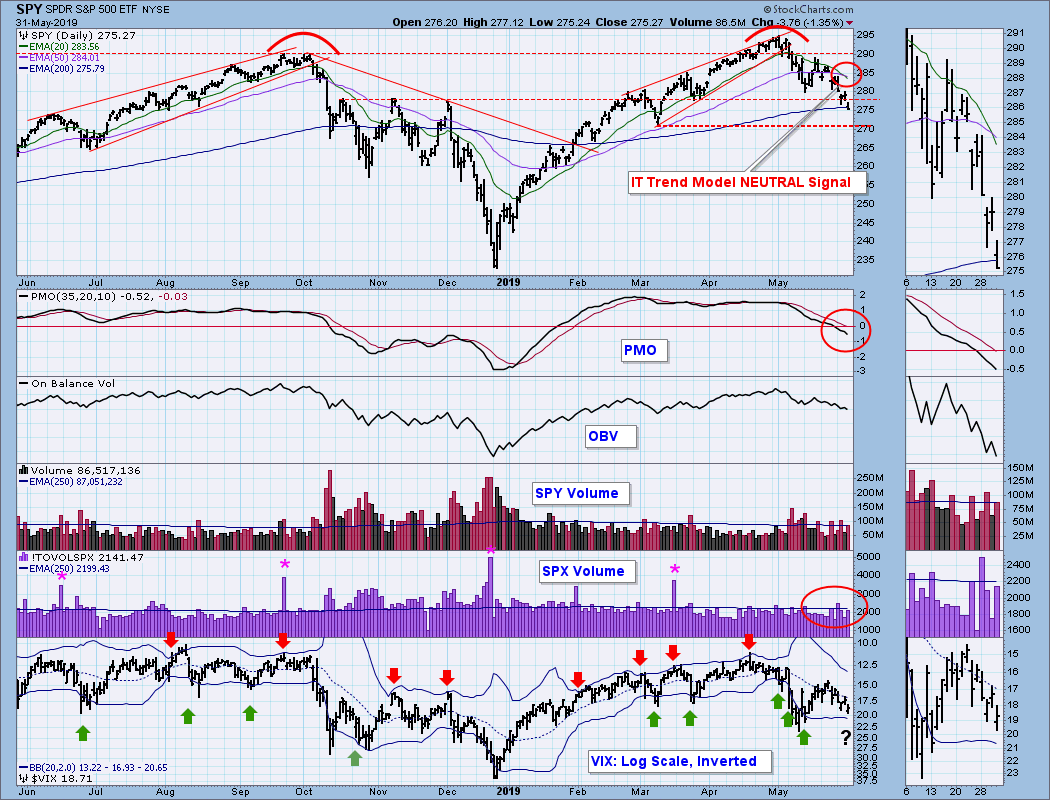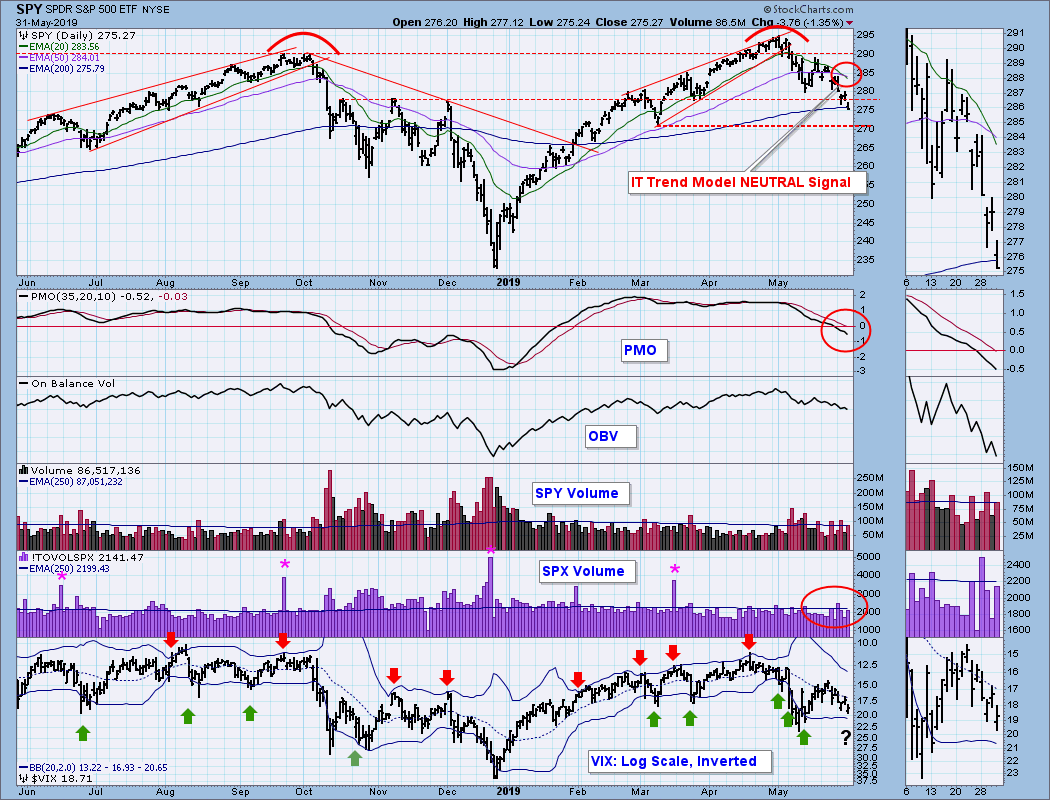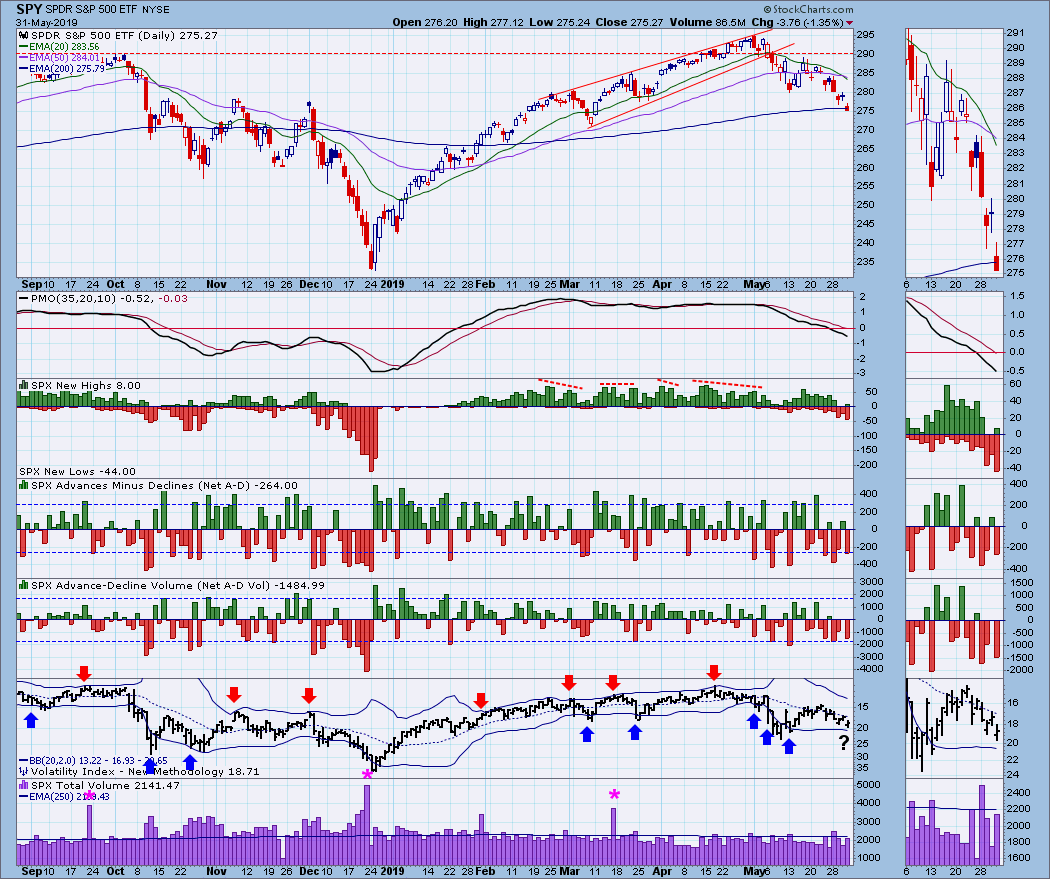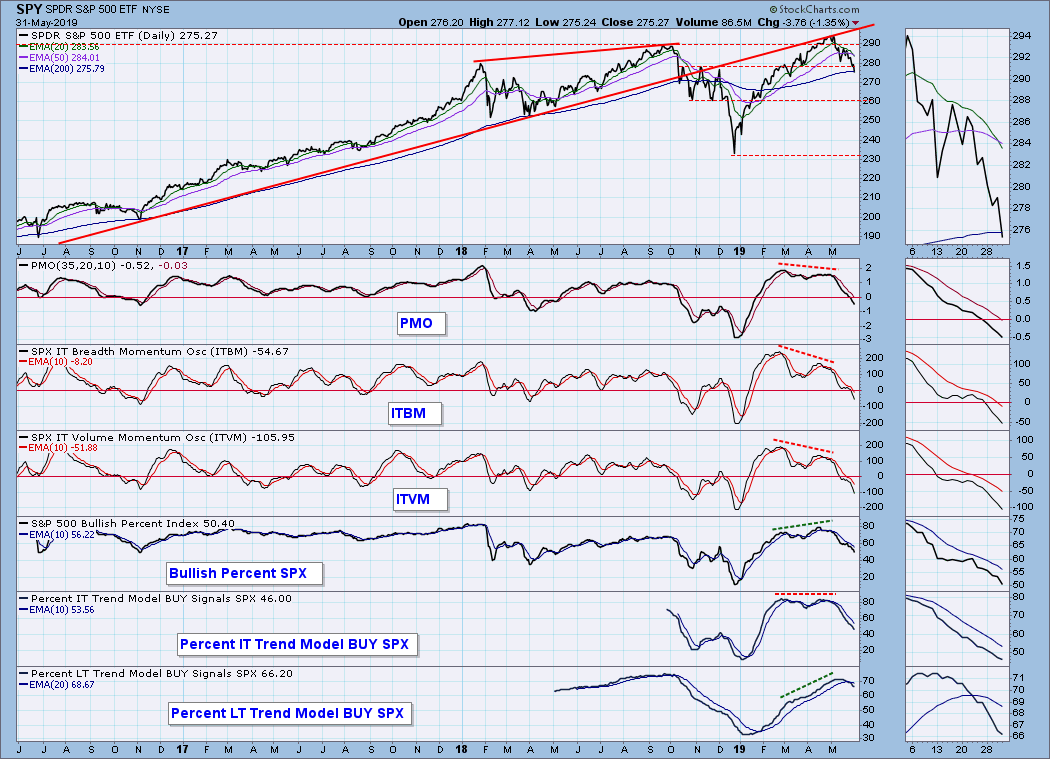
Today the SPY 20EMA crossed down through the 50EMA and the IT Trend Model for SPY changed from BUY to NEUTRAL. As usual, this signal is an information flag to encourage us to take a closer look at the situation. In this case, the price breakdown is associated with a double top, and is quite similar to the NEUTRAL signal generated in October. We cannot know the future, but it is hard not to imagine a decline of similar depth and velocity to the October-December decline. It probably won't happen that way, but it's a plan.
The DecisionPoint Weekly Wrap presents an end-of-week assessment of the trend and condition of the stock market (S&P 500), the U.S. Dollar, Gold, Crude Oil, and Bonds.
Watch the latest episode of DecisionPoint on StockCharts TV's YouTube channel here!
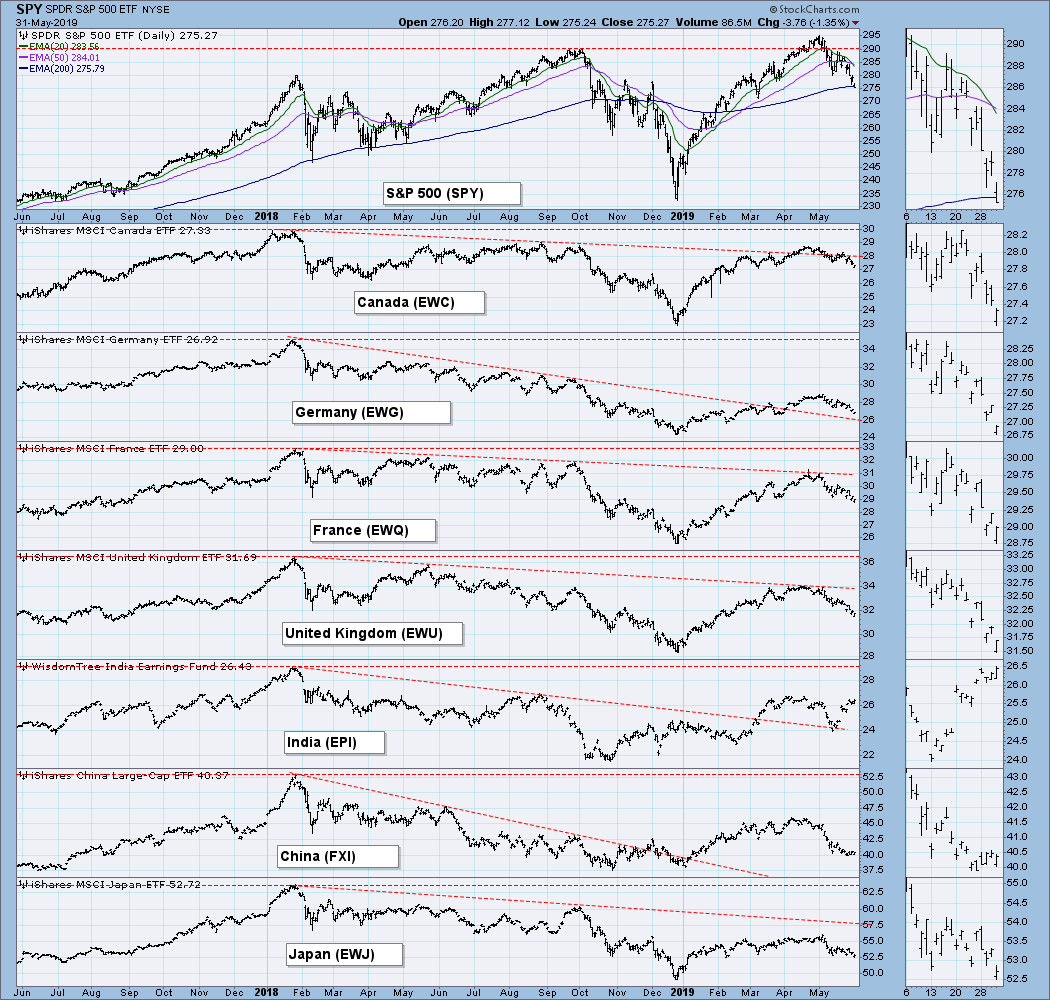
GLOBAL MARKETS
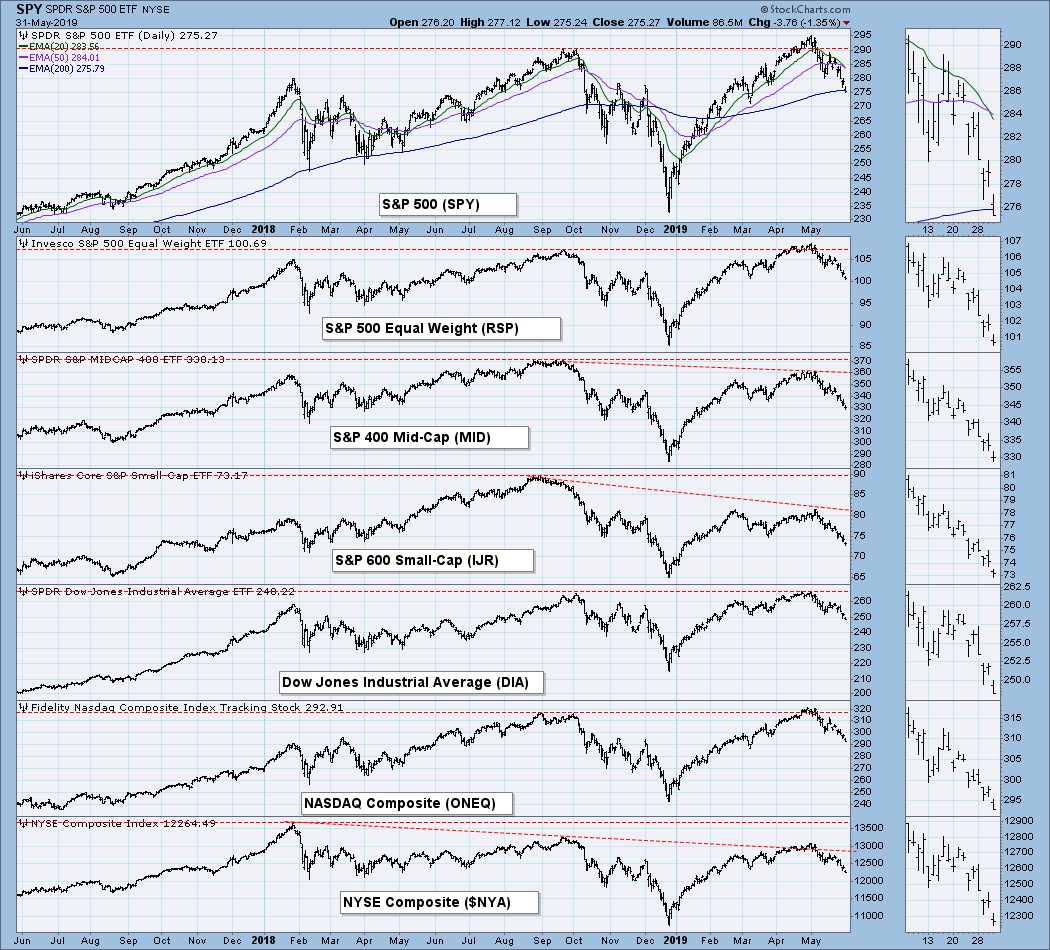
BROAD MARKET INDEXES
SECTORS
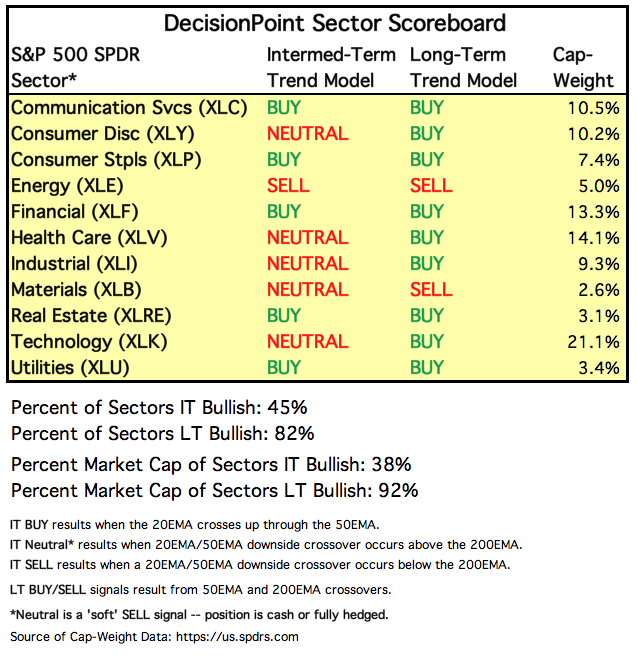
Each S&P 500 Index component stock is assigned to one, and only one, of 11 major sectors. This is a snapshot of the Intermediate-Term and Long-Term Trend Model signal status for those sectors.
STOCKS
IT Trend Model: NEUTRAL as of 5/31/2019
LT Trend Model: BUY as of 2/26/2019
SPY Daily Chart: Except for a few days, SPX Total Volume has been thin for the last three weeks. This shows a lack of commitment to the decline. The VIX is approaching the lower Bollinger Band, and it may penetrate the Band next week. Because of this, we should be alert for a possible bounce. The question we have is will the penetration lead to a price bounce, like the two in April, or will we see a series of lower lows like we did in early-May?
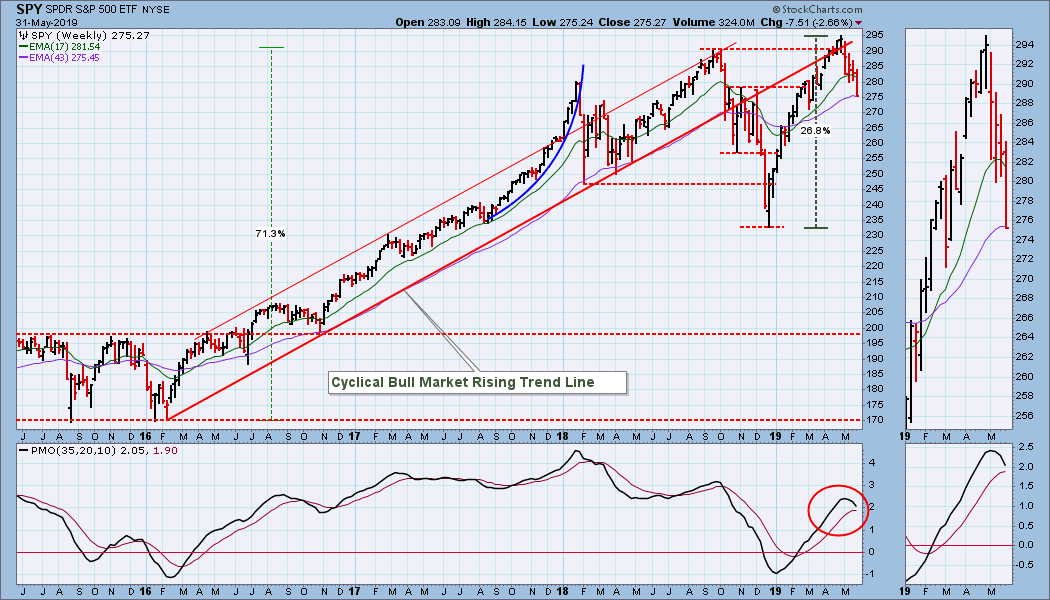
SPY Weekly Chart: Very bearish-looking chart with the weekly PMO falling most of the month.
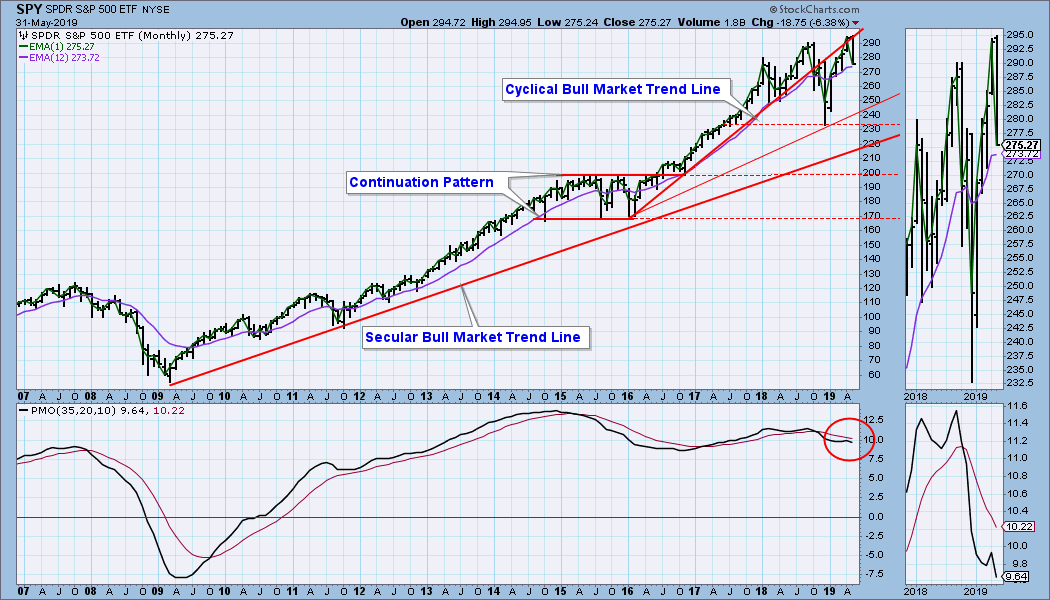
SPY Monthly Chart: The monthly PMO had turned up as of the end of April, but it turned down again (below the signal line) as of the end of this month. Along with this, price failed to hold the new, all-time highs, so in this time frame the picture is bearish.
Climactic Market Indicators: My conclusion is that Friday was not a climax day because SPX Total Volume fell short of the 250EMA of volume.
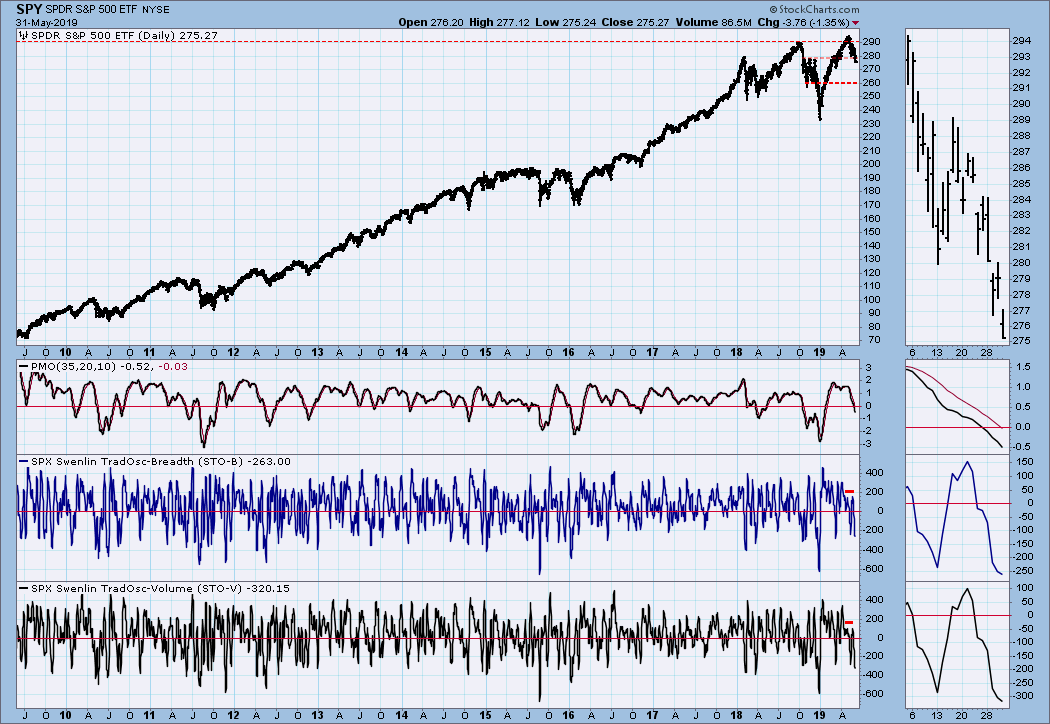
Short-Term Market Indicators: I have put up a 10-year chart to demonstrate that the STO-B and STO-V are definitely at oversold levels.
Intermediate-Term Market Indicators: The ITBM and ITVM are oversold based upon their range in the bull market, but there is plenty of room for more decline. The percentage of IT Trend Model BUY signals has dropped to 46%.
CONCLUSION: I am alert for a short-term price bottom -- the STOs and VIX being my primary indications in this regard. Nevertheless, the fundamental backdrop offers no encouragement that a longer-term turnaround is about to take place, and the technical structure in that time frame is quite negative.
DOLLAR (UUP)
IT Trend Model: BUY as of 2/7/2019
LT Trend Model: BUY as of 5/25/2018
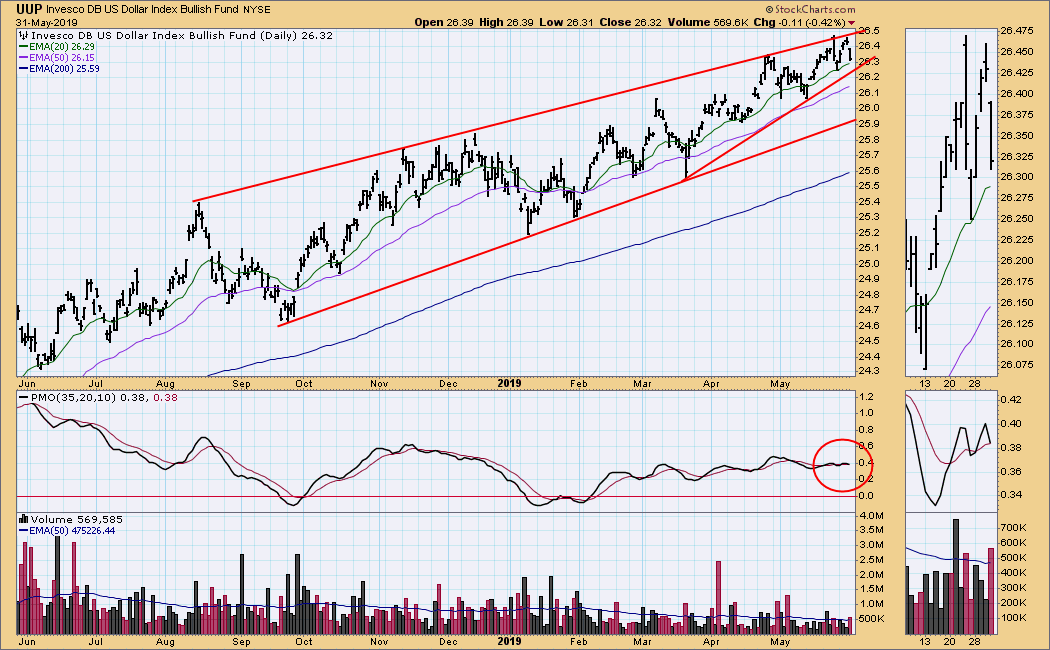
UUP Daily Chart: We can see a rising wedge within a rising wedge, a structure that calls for a price breakdown.
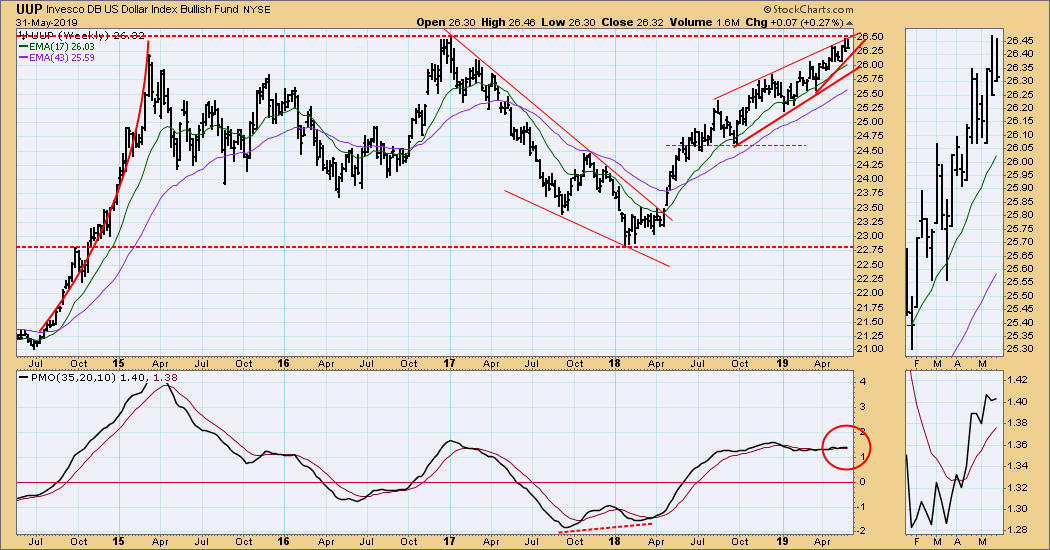
UUP Weekly Chart: The rising wedge formation is approaching overhead resistance, which should act to inhibit further upward movement.
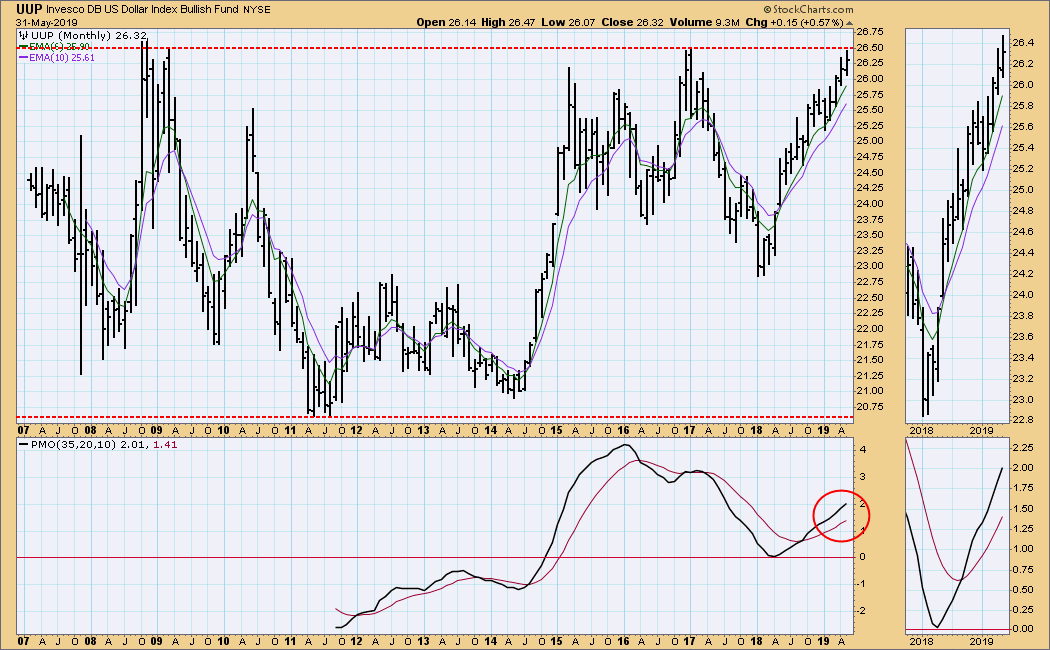
UUP Monthly Chart: The line of resistance drawn across the 2017 top has its roots in 2008/09, so I expect it will be difficult for UUP to get above it by very much.
GOLD
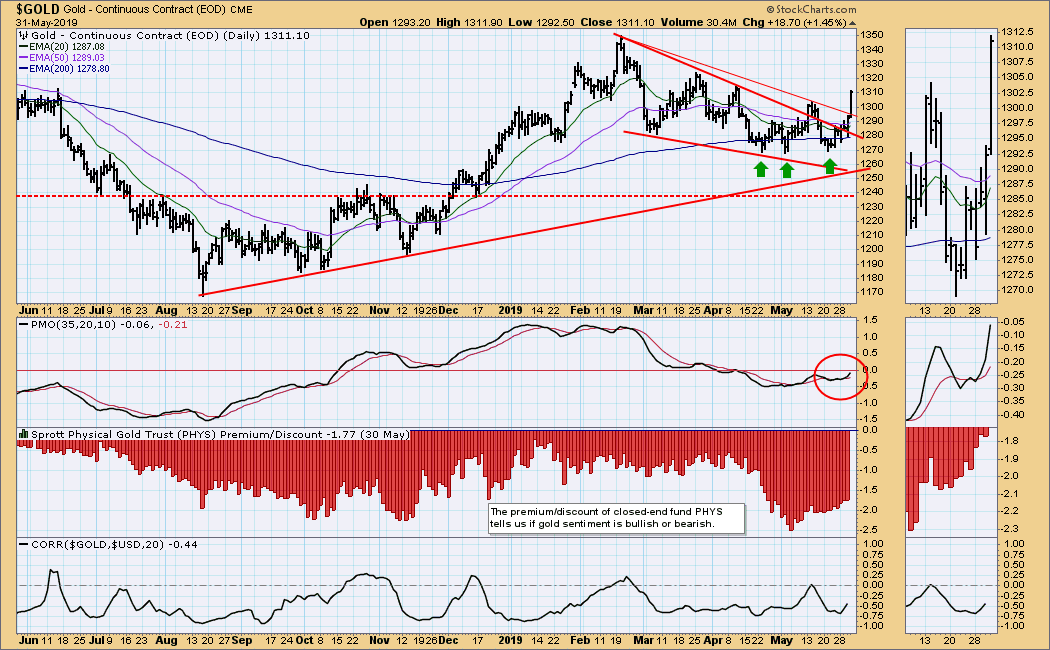
IT Trend Model: NEUTRAL as of 4/16/2019
LT Trend Model: BUY as of 1/8/2019
GOLD Daily Chart: Gold finally managed a clear break out of the falling wedge, shifting emphasis to the positive implications of the triple bottom. The possibility that the dollar may be at the end of its advance is a positive for gold.
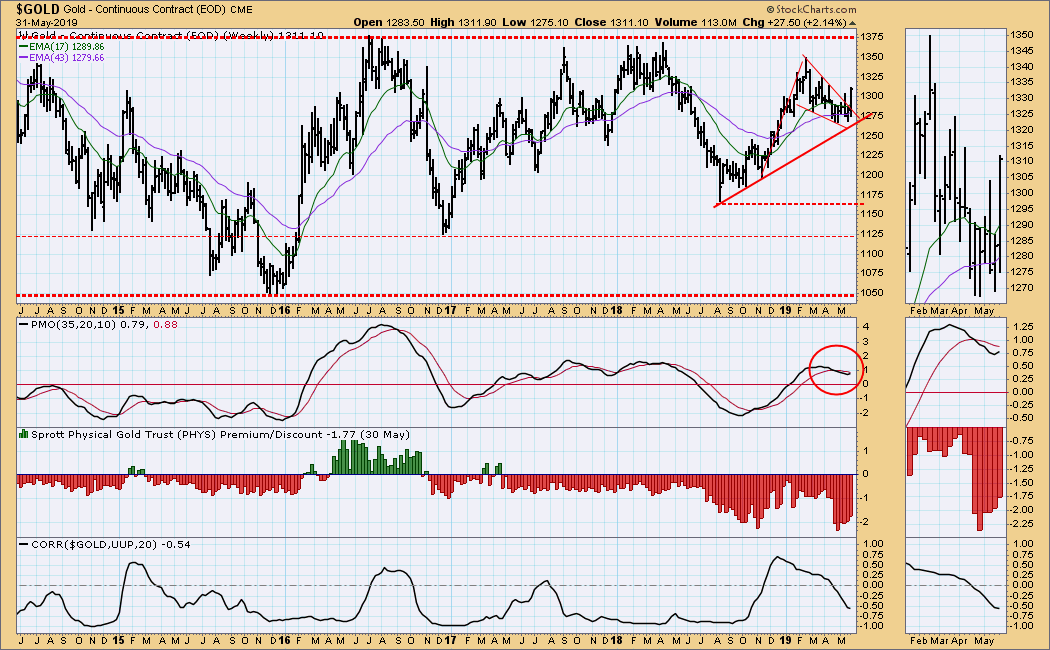
GOLD Weekly Chart: The price formation from the February top is a bullish pennant. Also, a rising trend line is coming into play. On the negative side, the weekly PMO is falling.
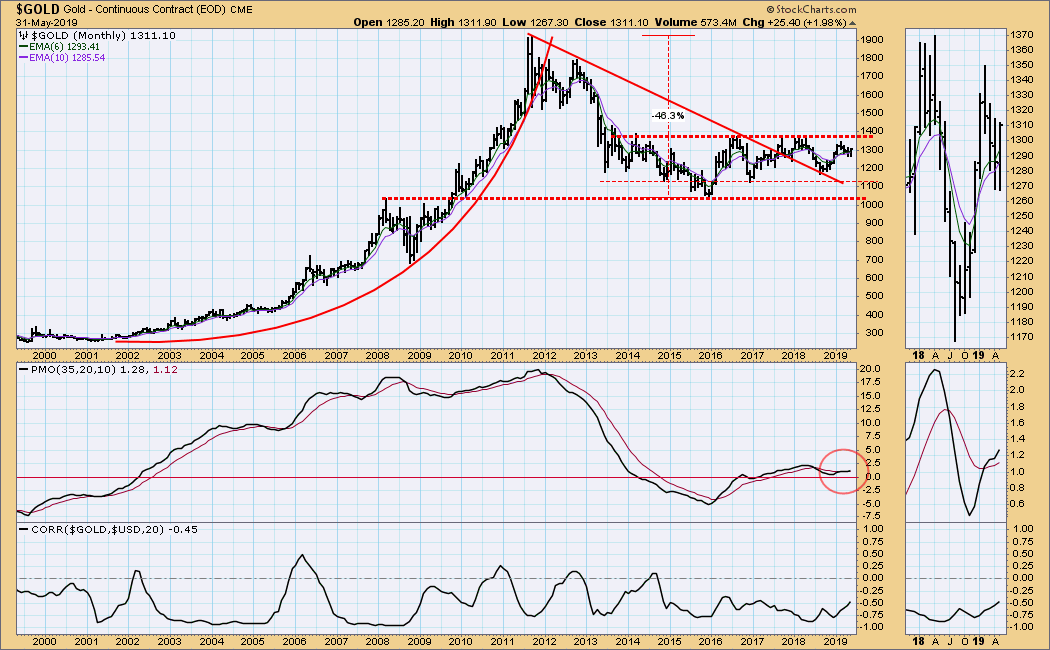
GOLD Monthly Chart: The monthly PMO has been relatively flat for over two years, but it is above the zero line, indicating a mild upward pressure on price. This chart is an example of how parabolic up moves can break down into a substantial correction, but rather than fall back to the basing pattern (about 300), gold has been moving sideways in what is known as a high-level consolidation. The expectation is for price to eventually break out of the trading range.
CRUDE OIL (USO)
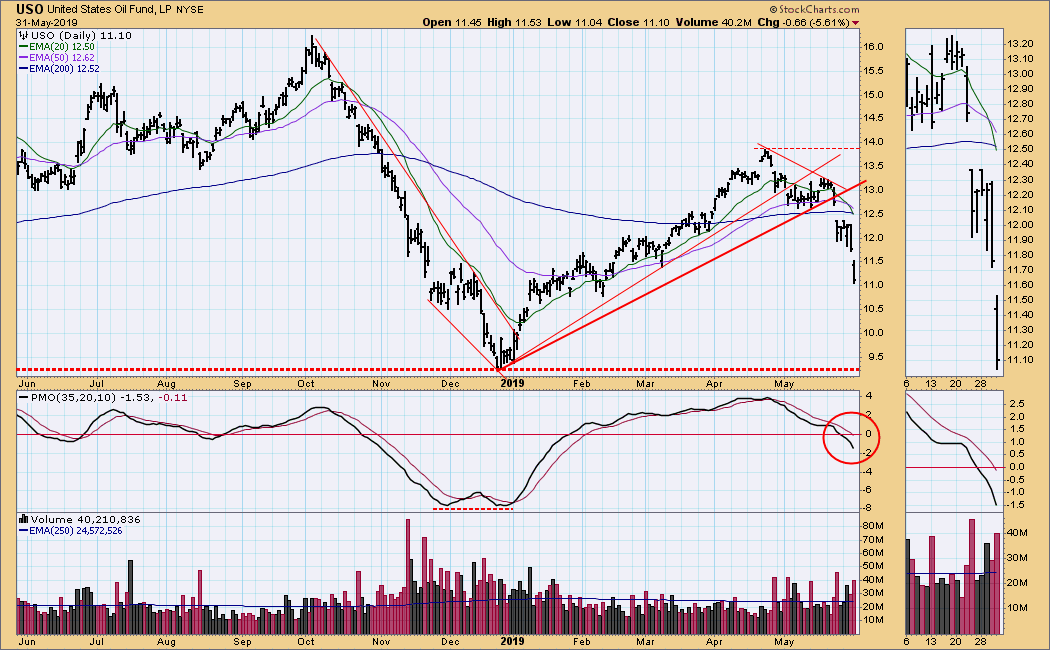
IT Trend Model: NEUTRAL as of 5/30/2019
LT Trend Model: BUY as of 4/17/2019
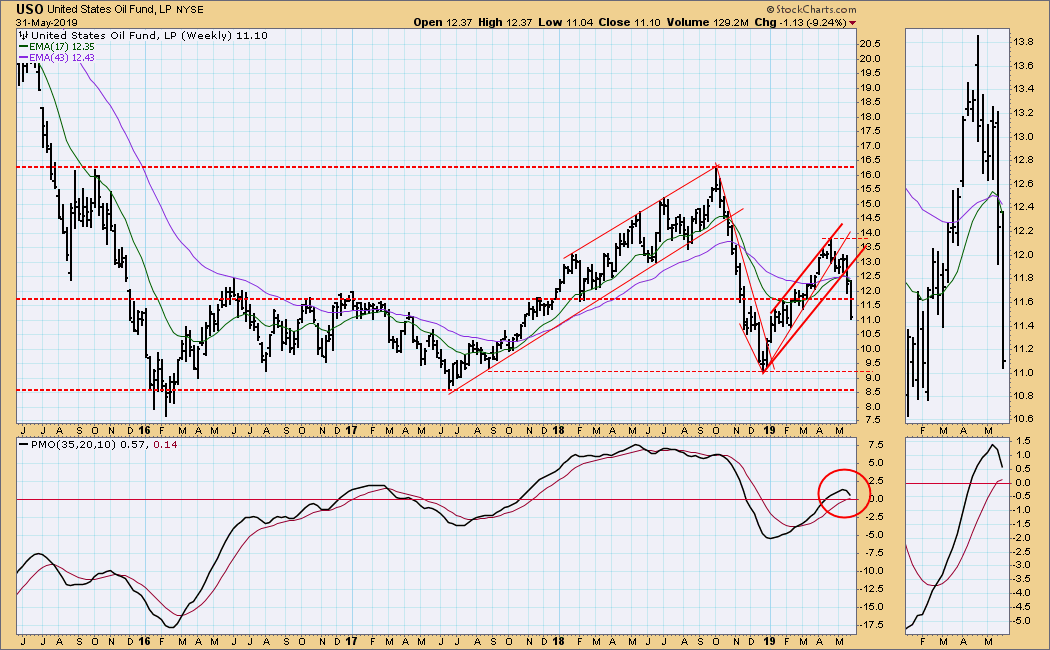
USO Daily Chart: On Thursday the USO 20EMA dropped below the 50EMA, causing the IT Trend Model to change from BUY to NEUTRAL. USO has declined about -18% from the April top, and the most obvious support is at the December low, which is the equivalent to about $42/bbl for crude.
USO Weekly Chart: USO has hit an area of support, but I think it is still likely to fall toward the support at 8.50. The weekly PMO has topped and adds weight to my downside expectations.
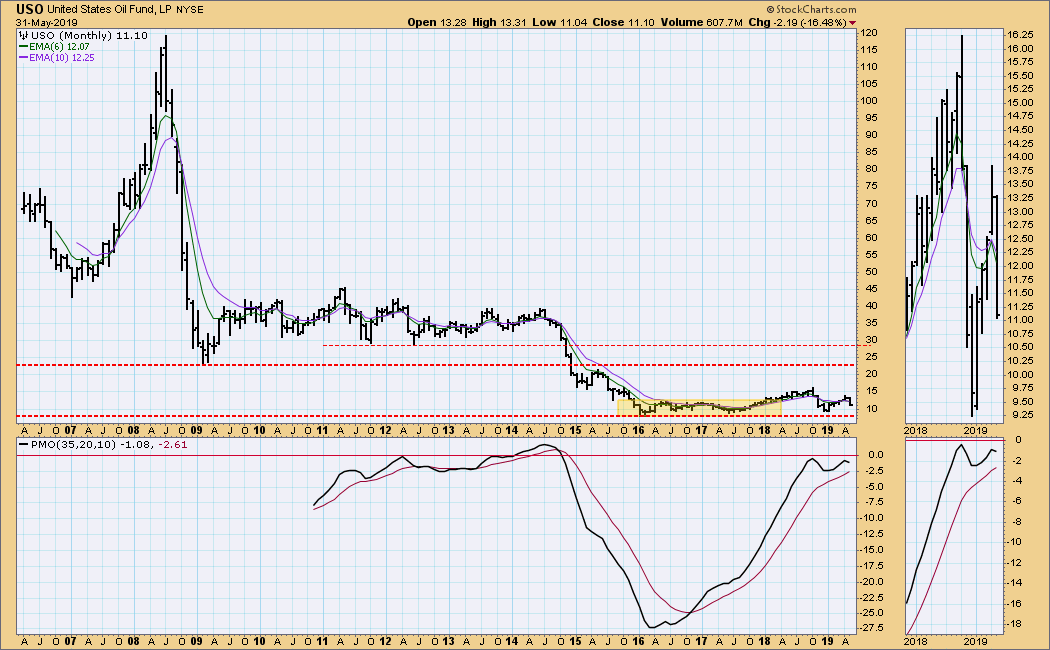
USO Monthly Chart: This is a good example of how the PMO responds to price movement. USO took a dive in 2015, and the PMO became very oversold. USO has been moving sideways for over three years, and during that time the PMO has moved back to the zero line, indicating no internal pressure to move either way. I expect it to remain within the trading range for some time.
BONDS (TLT)
IT Trend Model: BUY as of 12/6/2018
LT Trend Model: BUY as of 1/2/2019
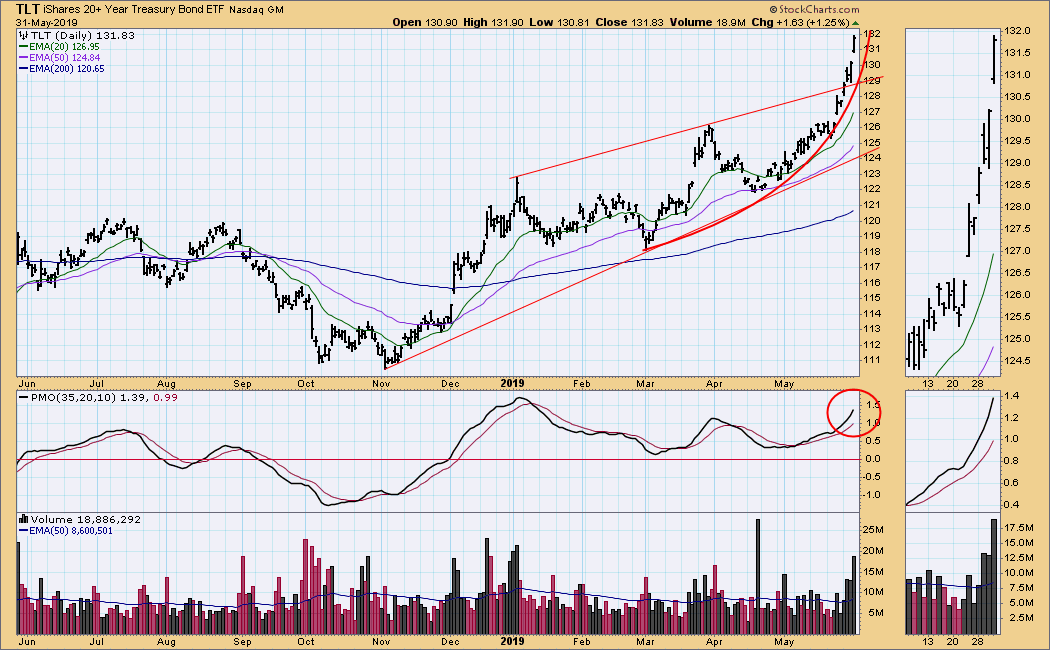
TLT Daily Chart: I've been watching the rising wedge formation, but this morning I noticed the emergence of a parabolic advance, which implies that the move to bonds is getting a bit frenzied.
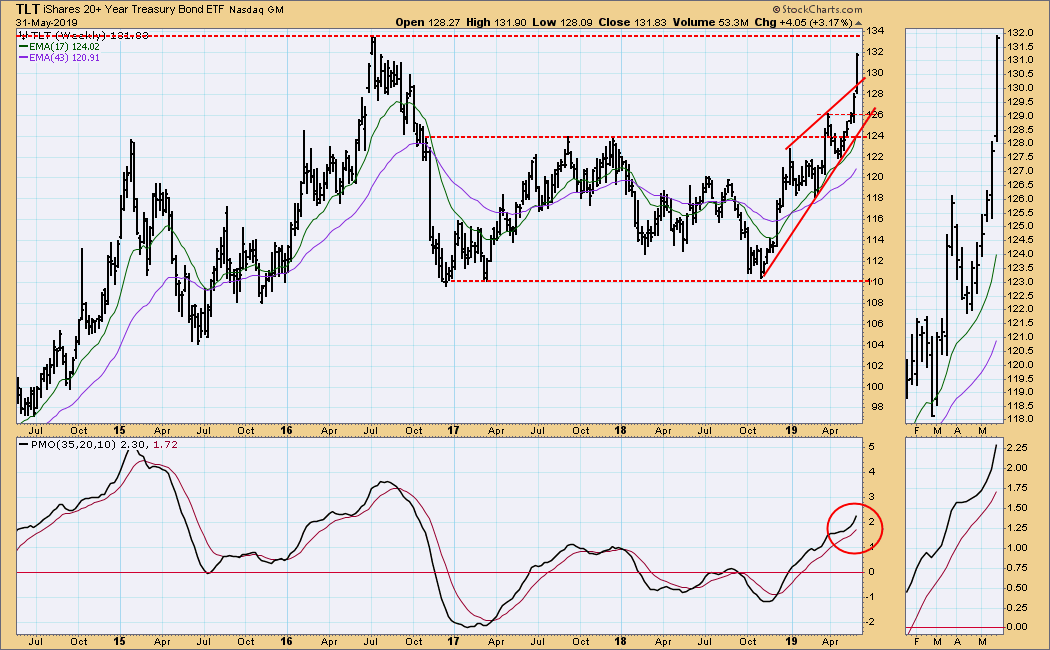
TLT Weekly Chart: The rising wedge has resolved upward, the opposite of our expectation for that kind of formation. The parabolic advance will run into resistance at the line drawn across the 2016 top, but I'll make no bets that resistance will hold.
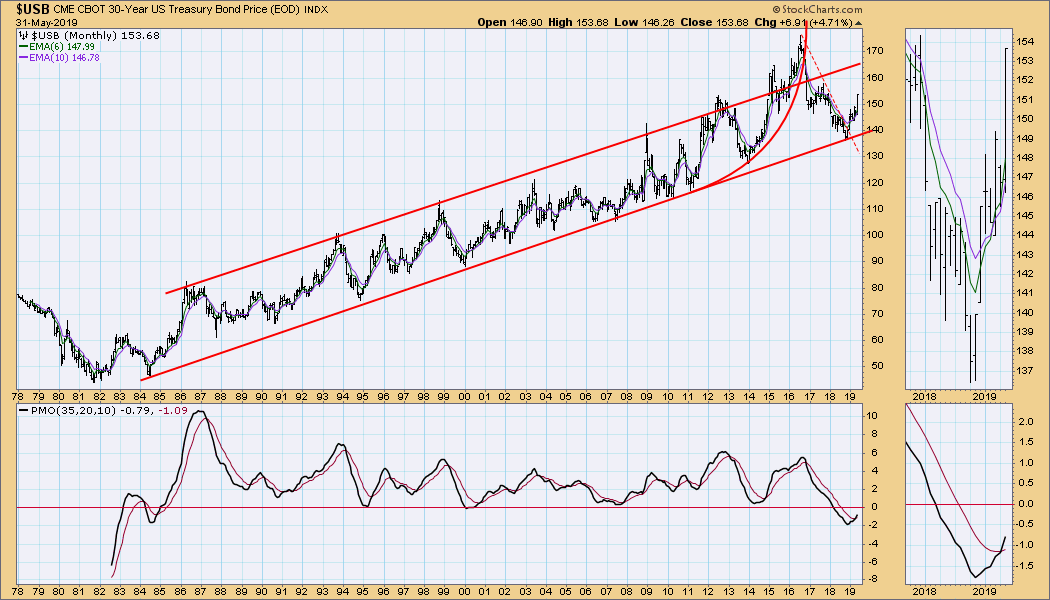
$USB Monthly Chart: Late last year I expected that the 30-year bond would break below the 37-year rising trend line after a short bounce; however, the trend line held and price is over half-way to the top of the rising trend channel.
**Don't miss any of the DecisionPoint commentaries! Go to the "Notify Me" box toward the end of this blog page to be notified as soon as they are published.**
Technical Analysis is a windsock, not a crystal ball.
Happy Charting!
- Carl
NOTE: The signal status reported herein is based upon mechanical trading model signals, specifically, the DecisionPoint Trend Model. They define the implied bias of the price index based upon moving average relationships, but they do not necessarily call for a specific action. They are information flags that should prompt chart review. Further, they do not call for continuous buying or selling during the life of the signal. For example, a BUY signal will probably (but not necessarily) return the best results if action is taken soon after the signal is generated. Additional opportunities for buying may be found as price zigzags higher, but the trader must look for optimum entry points. Conversely, exit points to preserve gains (or minimize losses) may be evident before the model mechanically closes the signal.
Helpful DecisionPoint Links:
DecisionPoint Shared ChartList and DecisionPoint Chart Gallery
Price Momentum Oscillator (PMO)
Swenlin Trading Oscillators (STO-B and STO-V)

