 The number I've heard tossed around over the past few weeks regarding a gold rally is a move to $1340. Well, in just a few days, we have popped above that, and the chart suggests we will continue to see more rallying. This week's climactic indicator chart recorded the highest reading of the year for the number of New Highs in the SPX. It smells like a buying exhaustion, especially when compared to other breadth indicators.
The DecisionPoint Alert presents a mid-week assessment of the trend and condition of the stock market (S&P 500), the U.S. Dollar, Gold, Crude Oil and Bonds.
Watch the latest episode of DecisionPoint on StockCharts TV's YouTube channel here!
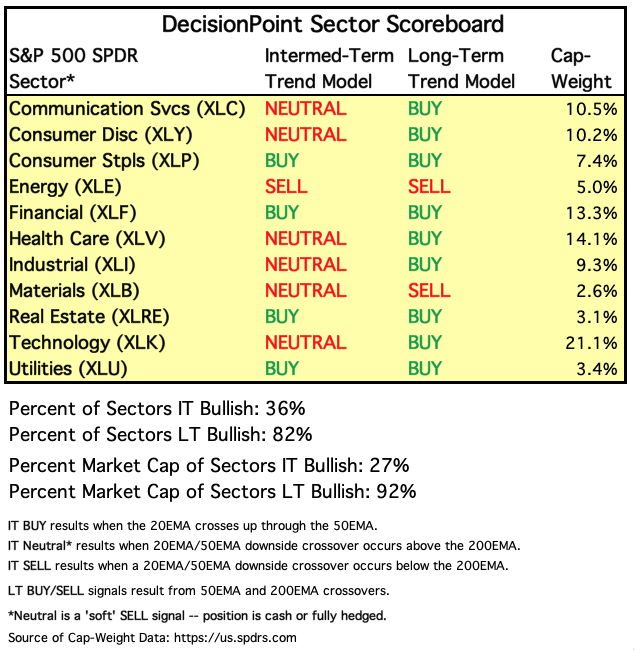
SECTORS
Each S&P 500 Index component stock is assigned to one, and only one, of eleven major sectors. This is a snapshot of the Intermediate-Term and Long-Term Trend Model signal status for those sectors.
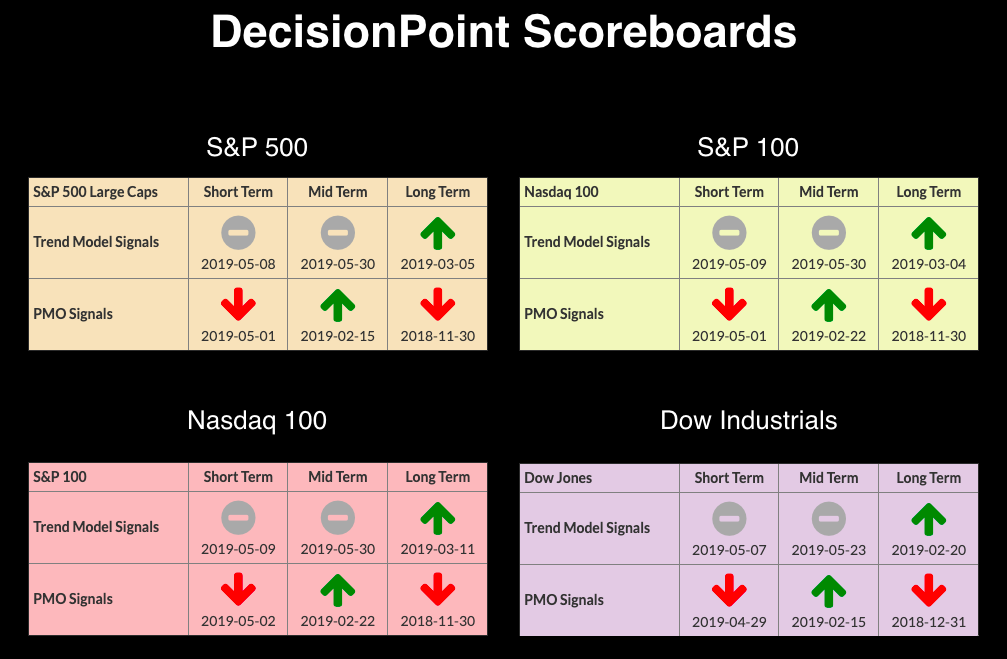
STOCKS
IT Trend Model: BUY as of 2/1/2019
LT Trend Model: BUY (SPY) as of 2/26/2019
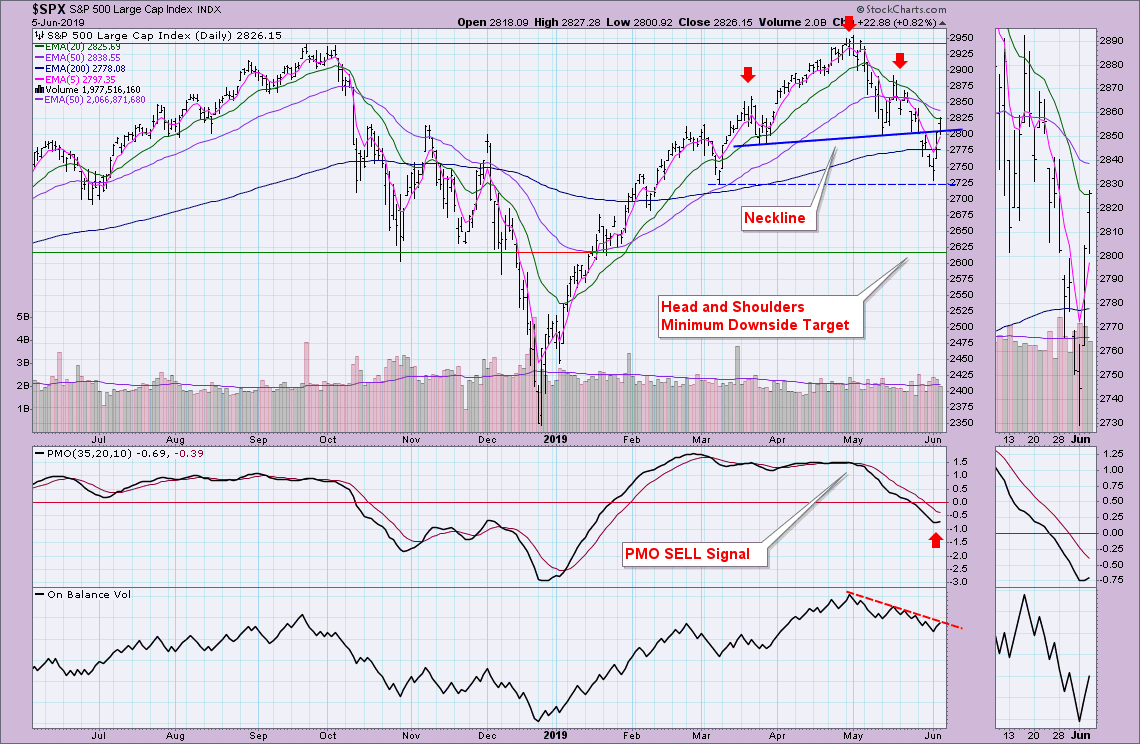
SPY Daily Chart: The head-and-shoulders pattern executed, but, as soon as it reached support at the March low, it rocketed skyward and back above the neckline. Price managed to close above the 20-EMA and the Price Momentum Oscillator (PMO) has turned up. This is encouraging, but I suspect we will be reversing lower soon.
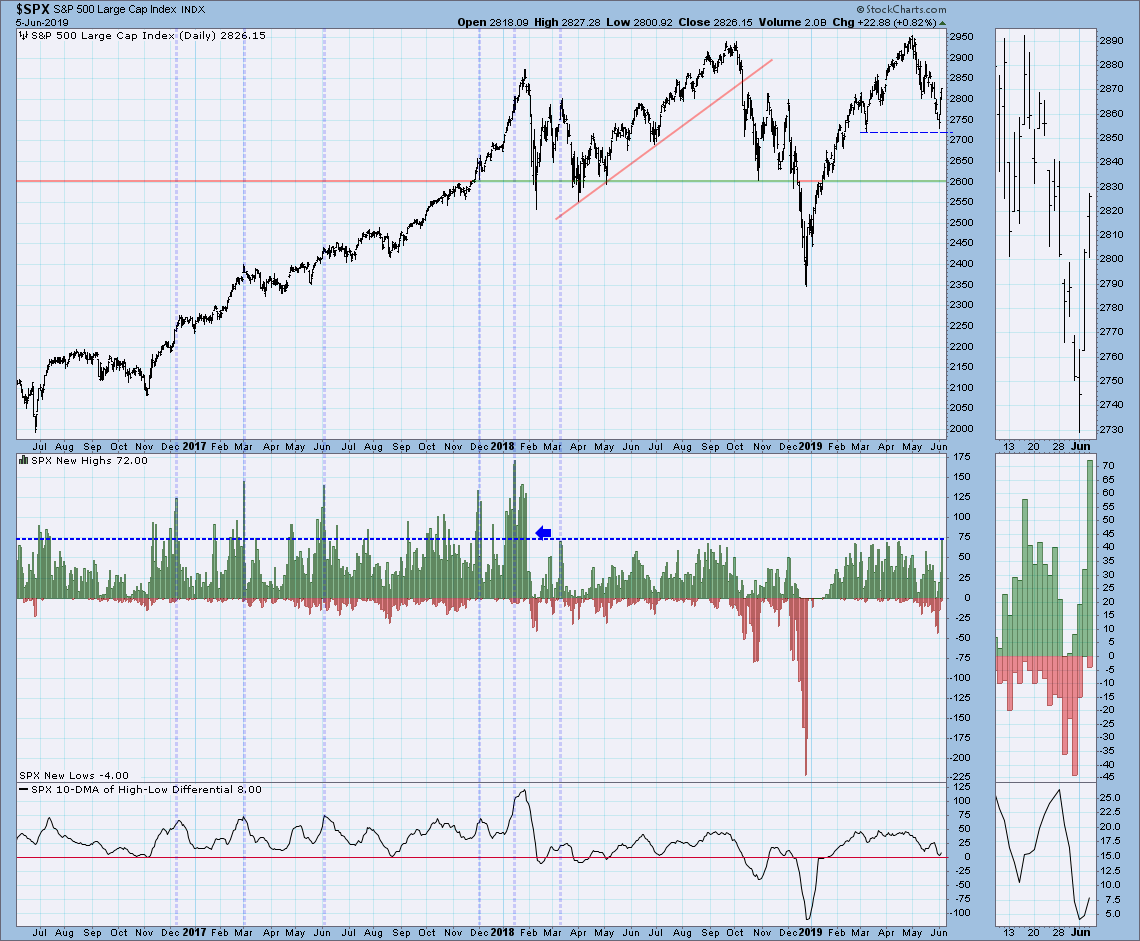
Climactic Market Indicators: As noted, we saw a record number of new highs for the year. However... this was not accompanied by record (or even somewhat climactic) breadth readings on Net Advances-Declines and A-D Volume. The VIX is nearing the upper Bollinger Band, which generally precipitates a decline. I believe this is a buying exhaustion. Notice that volume dropped on a strong continuation rally today.
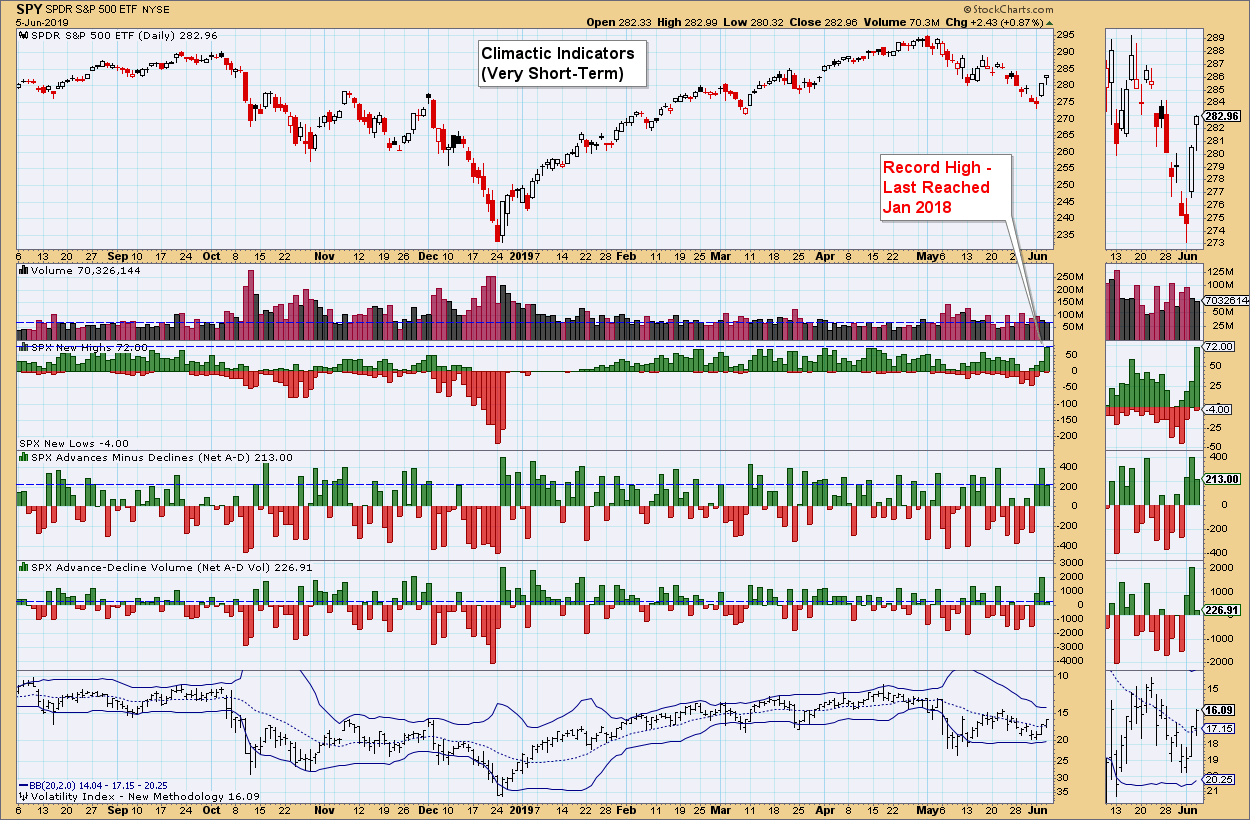
While today's record New Highs is impressive, we can see that, in reality, these aren't particularly climactic on a multi-year chart. I would note that when we do see highly climactic readings, they tend to precede declines.
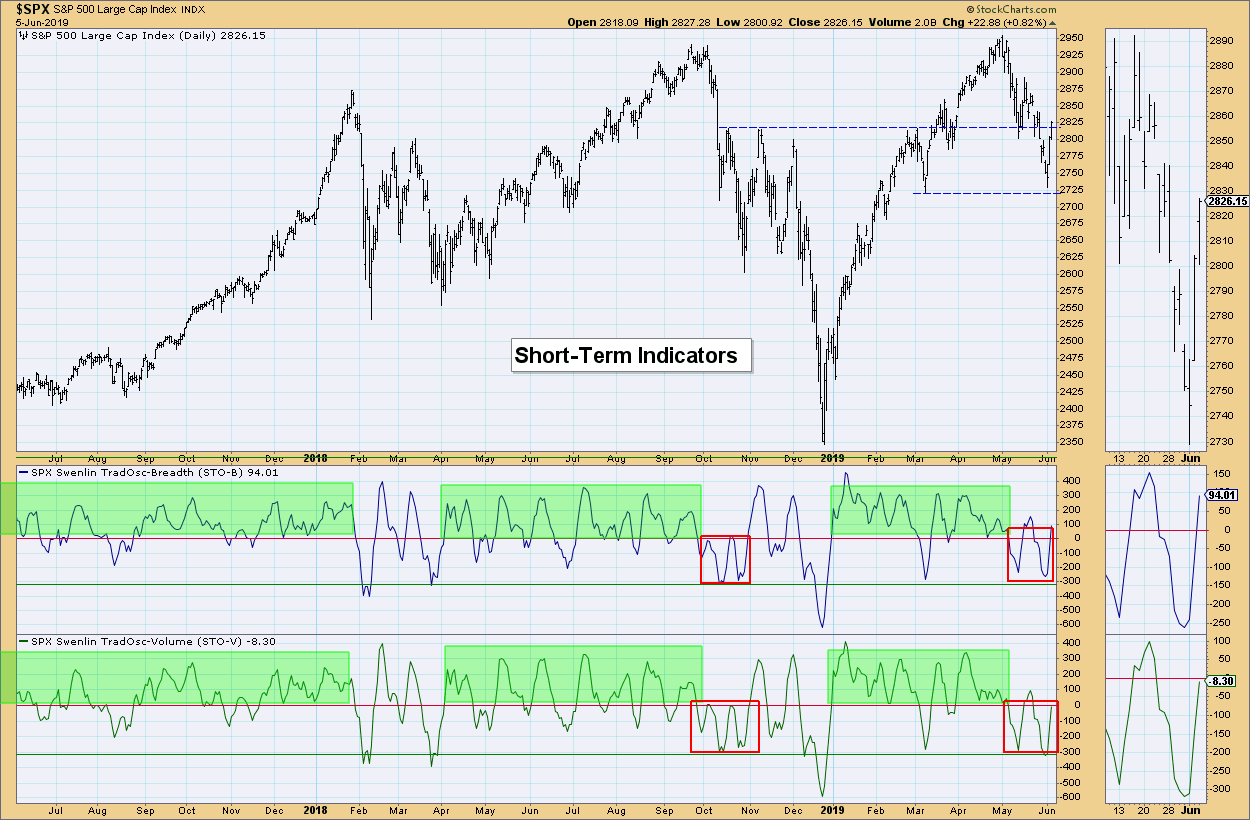
Short-Term Market Indicators: The STO-B has reached positive territory and the STO-V is close behind. I've marked the oscillation seen during strong rallies in green. I've also boxed the double-bottoms on these indicators, as the current configuration and movement of these two indicators is reminiscent of last October.
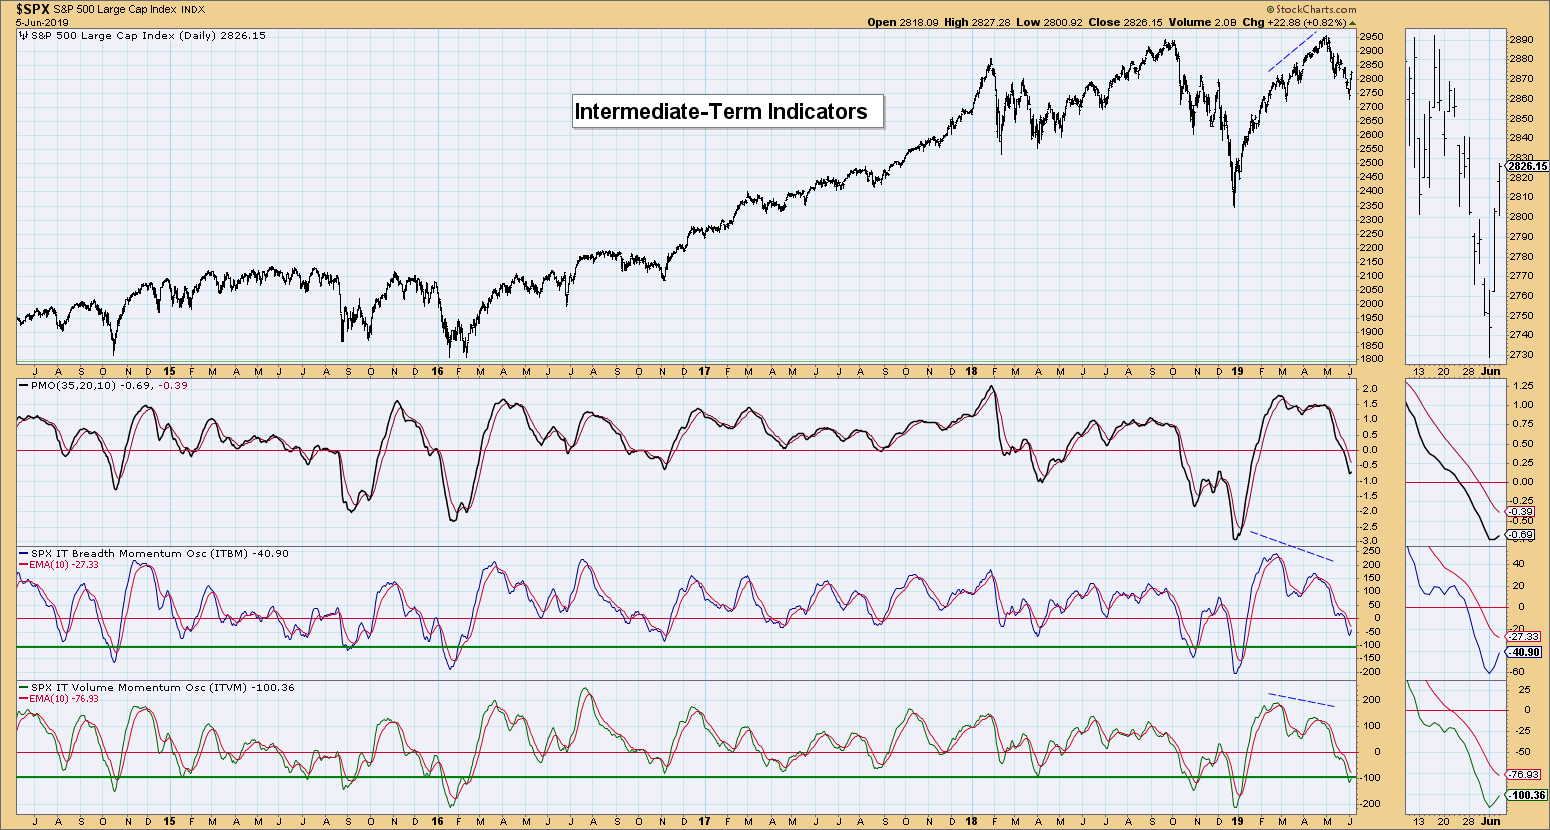
Intermediate-Term Market Indicators: These have turned up in oversold territory, but, on two very strong rally days, I would like to see more than a "tick" upward.
Conclusion: For today, the market rally was led by defensive areas of the market (Utilities and Real Estate, with Consumer Staples not far behind). Given the lack of strong volume on this continuation, along with the weak technicals, I am questioning the staying power of today's rally.
DOLLAR (UUP)
IT Trend Model: BUY as of 2/7/2019
LT Trend Model: BUY as of 5/25/2018
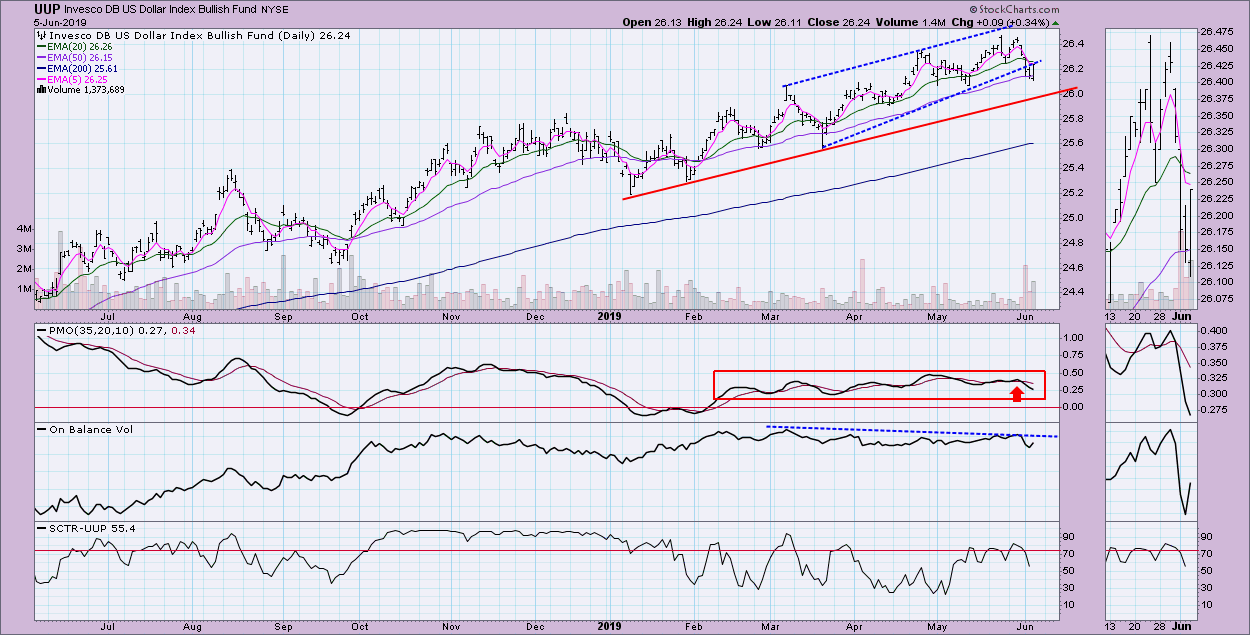
UUP Daily Chart: The rising wedge on the Dollar is executing, but the rising bottoms trend line could provide a pivot point. The flat PMO is due to very steady price acceleration. There is a negative divergence between OBV and price. Price opened below the 50-EMA, but managed to close above it. I would look for $26.
GOLD
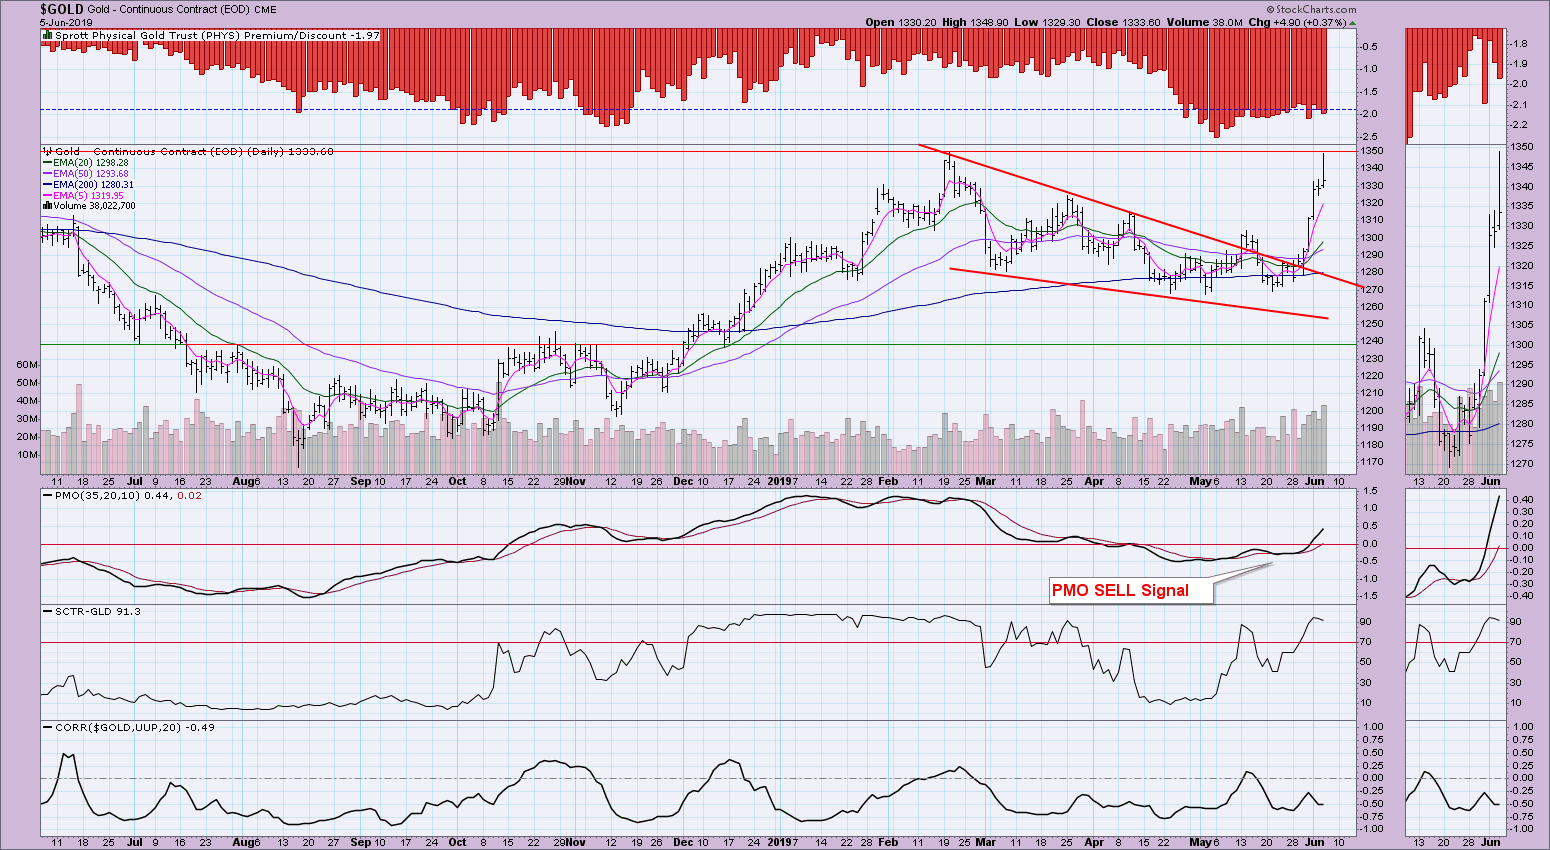
IT Trend Model: Neutral as of 4/16/2019
LT Trend Model: BUY as of 1/8/2019
GOLD Daily Chart: Dave Keller and I are going to have a "Round Table" on Thursday's MarketWatchers LIVE show regarding Gold and bitcoin, so tune in! Gold rallied this week in impressive fashion. After consolidating the move from Monday, Gold popped higher once again. It didn't close above 1340, but it likely will soon. The PMO looks healthy. Discounts are still very high, which implies bearish participation in the gold market. Bearish sentiment is good for gold.
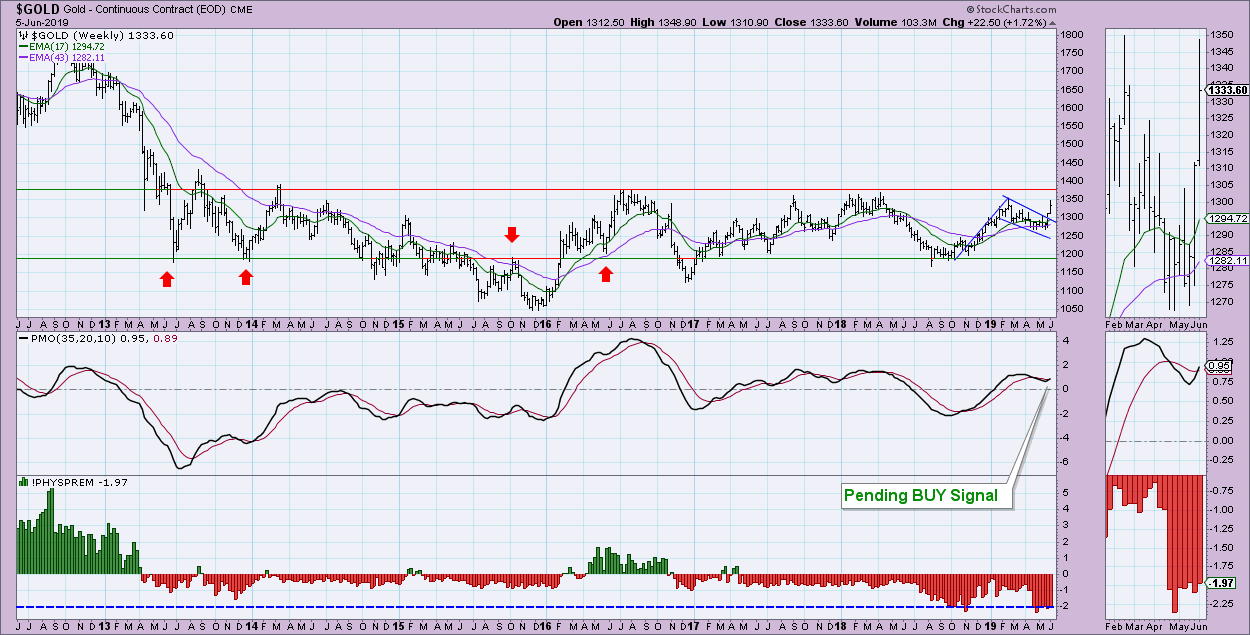
The weekly chart paints a positive picture with a flag formation executing. $1375 seems like a more accurate area of overhead resistance. The weekly PMO could trigger a BUY signal tomorrow when this chart goes "final."
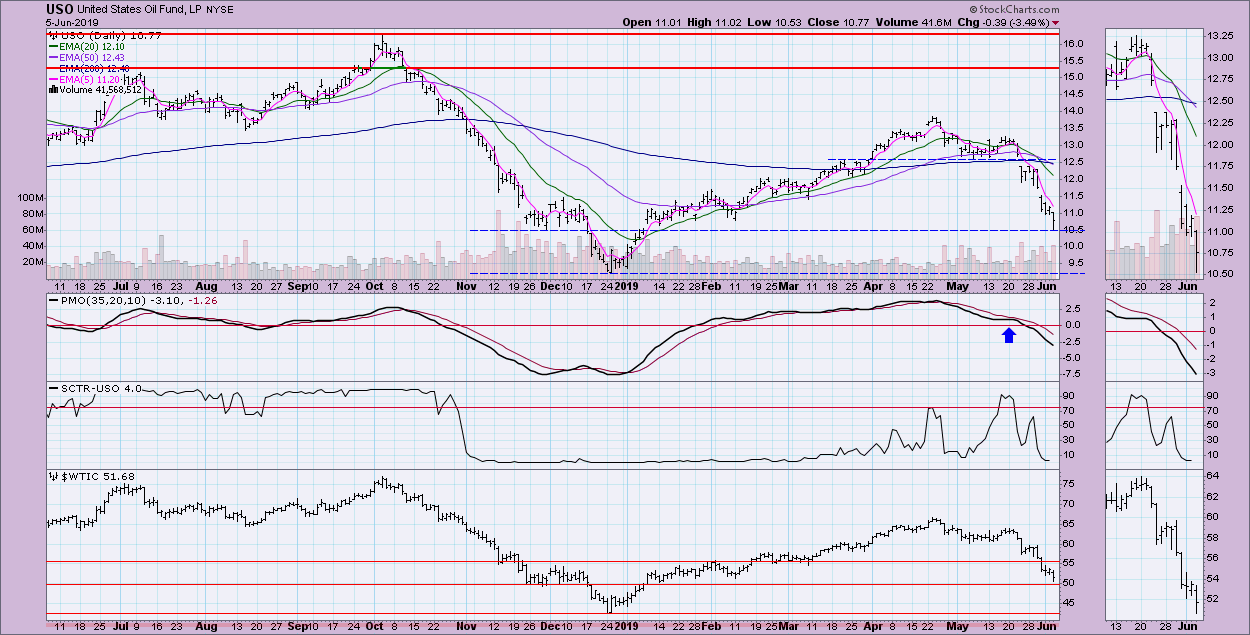
CRUDE OIL (USO)
IT Trend Model: BUY as of 2/19/2019
LT Trend Model: SELL as of 11/23/2018
USO Daily Chart: Support has been reached at the November low. Unfortunately, I don't think it is done rolling over; I suspect we will see November lows before we see April highs.
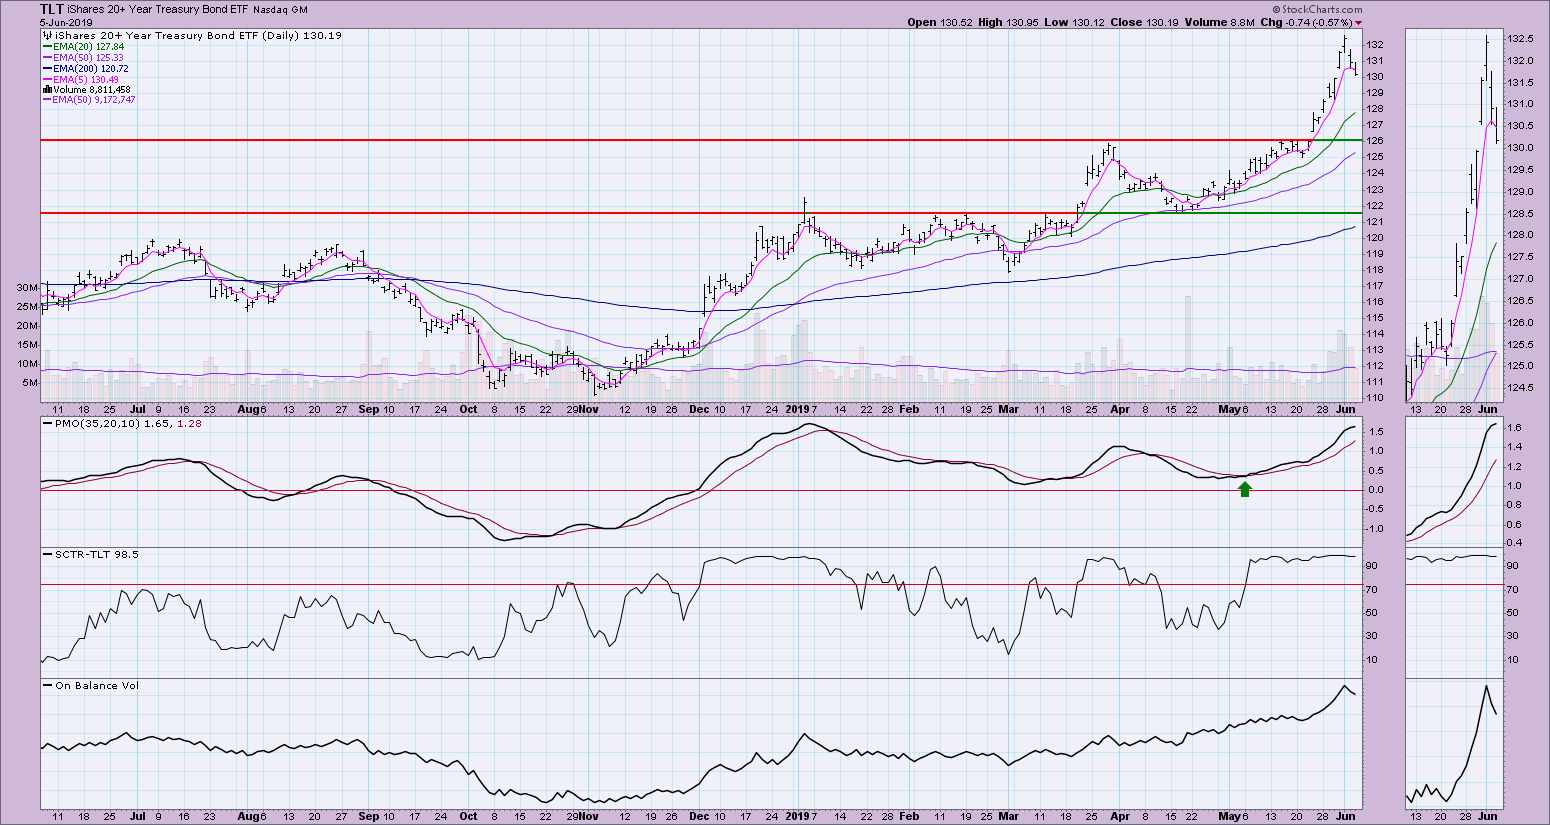
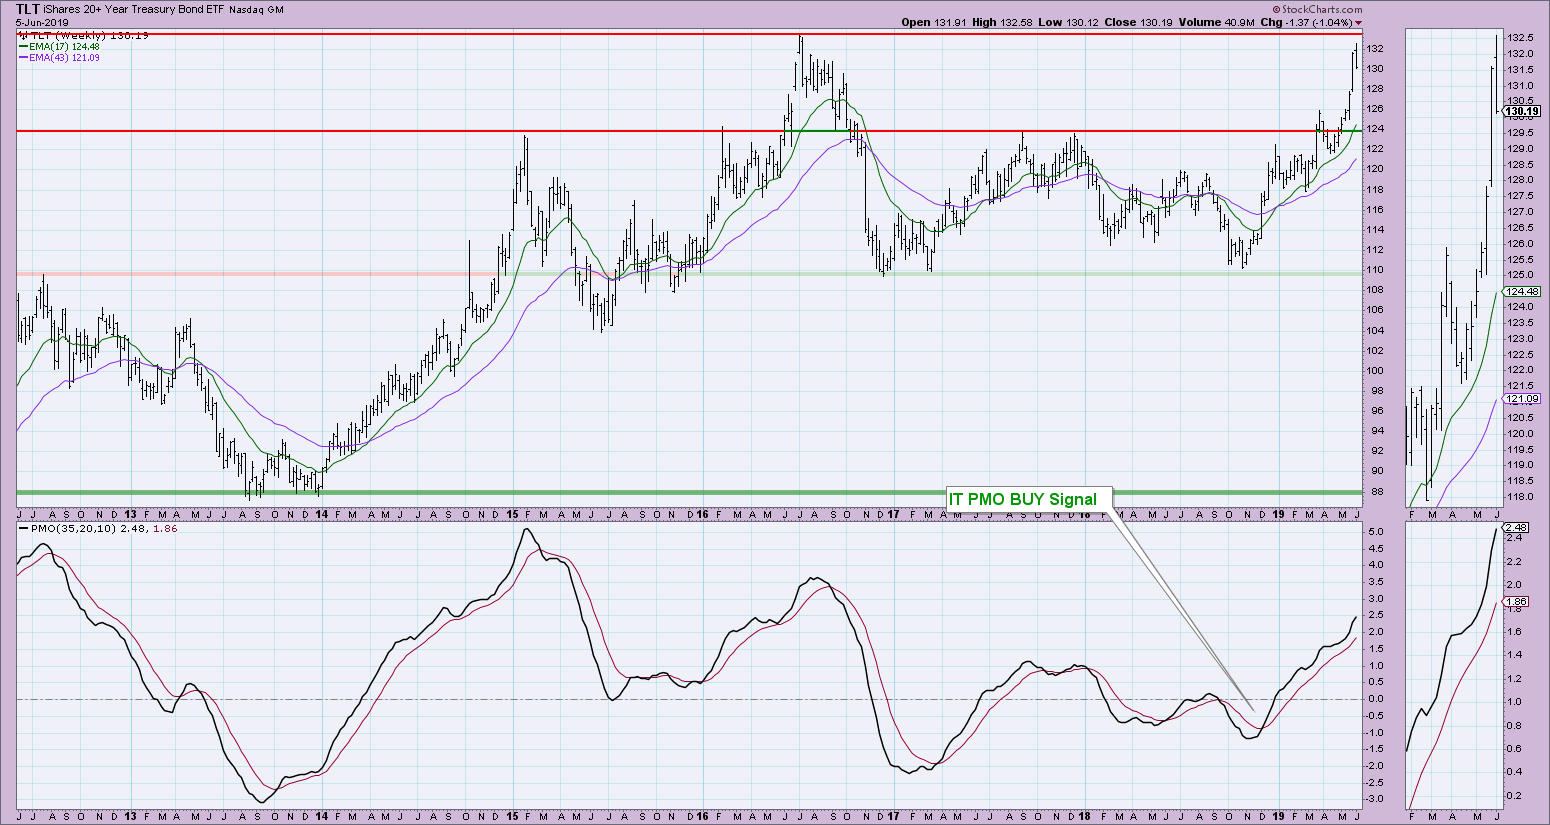
BONDS (TLT)
IT Trend Model: BUY as of 12/6/2018
LT Trend Model: BUY as of 1/2/2019
TLT Daily Chart: We have a parabolic frenzy going on with Bonds, but, over the last two days, price has been pulling back. The PMO is overbought, but the SCTR is still high and the OBV is rising.
Here is a weekly chart, where you can see how close TLT is to its all-time high.
Technical Analysis is a windsock, not a crystal ball.
Happy Charting!
- Erin
Email: erinh@stockcharts.com
**Don't miss any of the DecisionPoint commentaries! Go to the "Notify Me" box toward the end of this blog page to be notified as soon as they are published.**
NOTE: The signal status reported herein is based upon mechanical trading model signals, specifically, the DecisionPoint Trend Model. They define the implied bias of the price index based upon moving average relationships, but they do not necessarily call for a specific action. They are information flags that should prompt chart review. Further, they do not call for continuous buying or selling during the life of the signal. For example, a BUY signal will probably (but not necessarily) return the best results if action is taken soon after the signal is generated. Additional opportunities for buying may be found as price zigzags higher, but the trader must look for optimum entry points. Conversely, exit points to preserve gains (or minimize losses) may be evident before the model mechanically closes the signal.
Helpful DecisionPoint Links:
DecisionPoint Shared ChartList and DecisionPoint Chart Gallery
Price Momentum Oscillator (PMO)
Swenlin Trading Oscillators (STO-B and STO-V)


