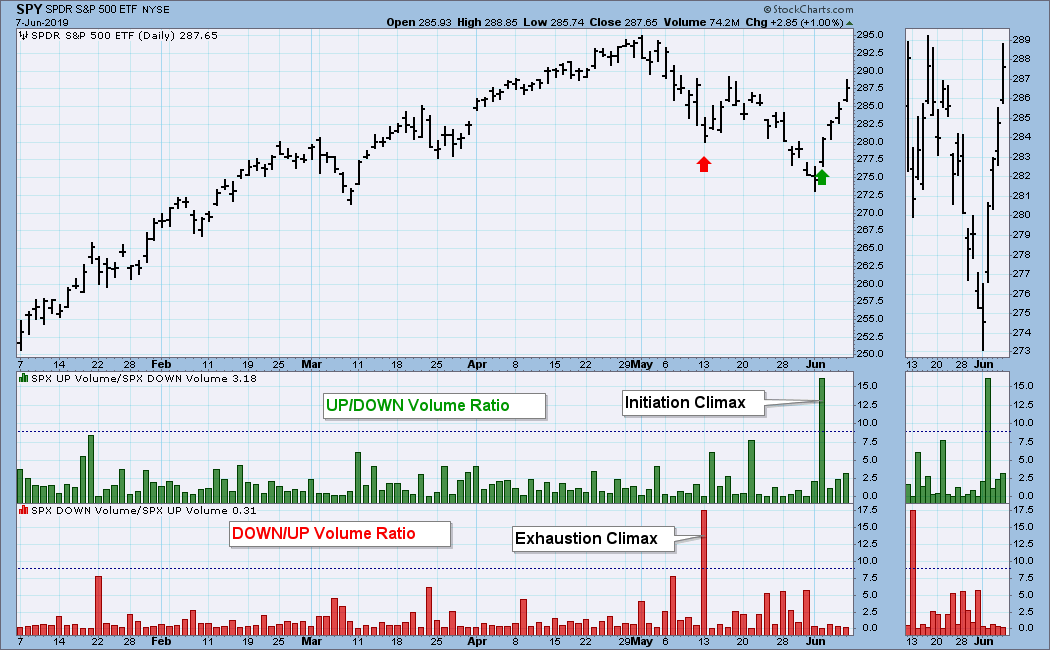
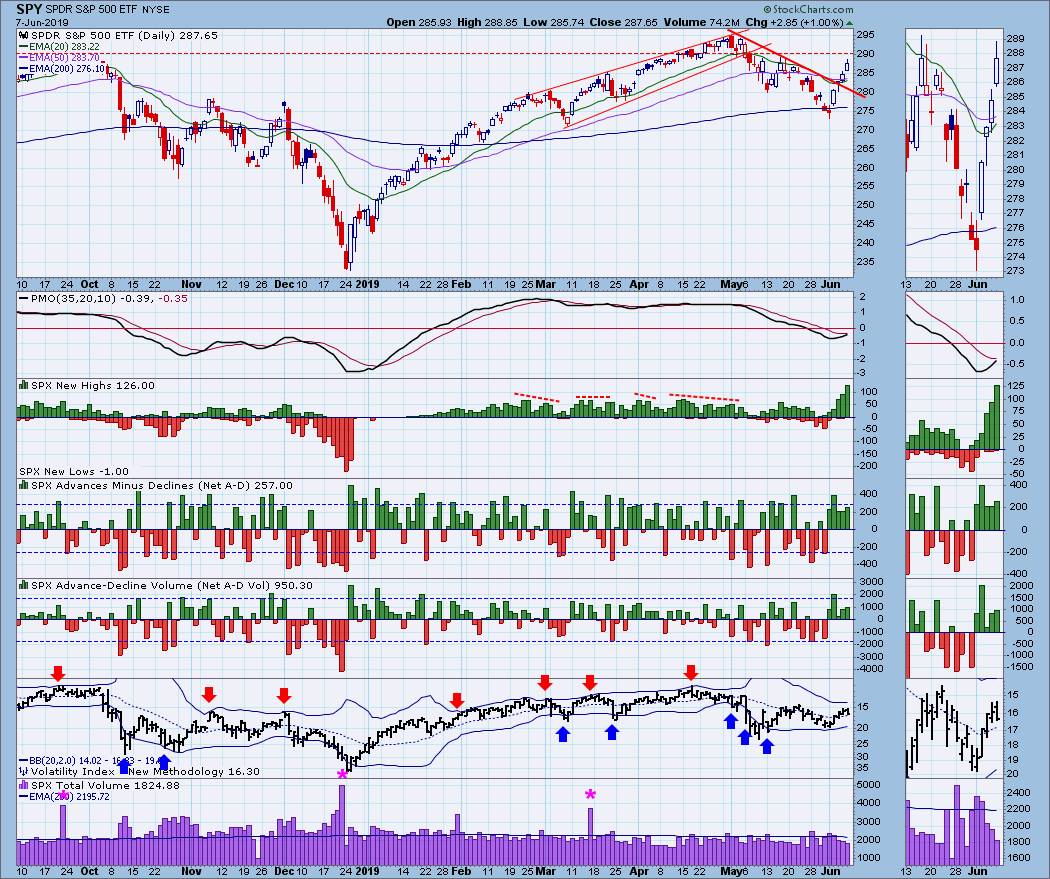
Some time ago on StockCharts TV I discussed volume ratios and how higher than normal ratios help identify climactic events and possible turning points. This week on Tuesday we had such an event when the SPX up volume divided by down volume produced a ratio of over 15. I have identified it as an initiation climax because price action on that day broke a down trend and initiated a move to the upside. On the chart below in May we can also see a down volume divided by up volume ratio of over 17, which I tagged as an exhaustion climax -- price reversed the next day. However, as often happens with downside exhaustion climaxes, the exhaustion was only momentary, resulting in only a small bounce before the decline resumed. The question, which we will address below, is whether the current rally will persist.
The DecisionPoint Weekly Wrap presents an end-of-week assessment of the trend and condition of the stock market (S&P 500), the U.S. Dollar, Gold, Crude Oil, and Bonds.
Watch the latest episode of DecisionPoint on StockCharts TV's YouTube channel here!
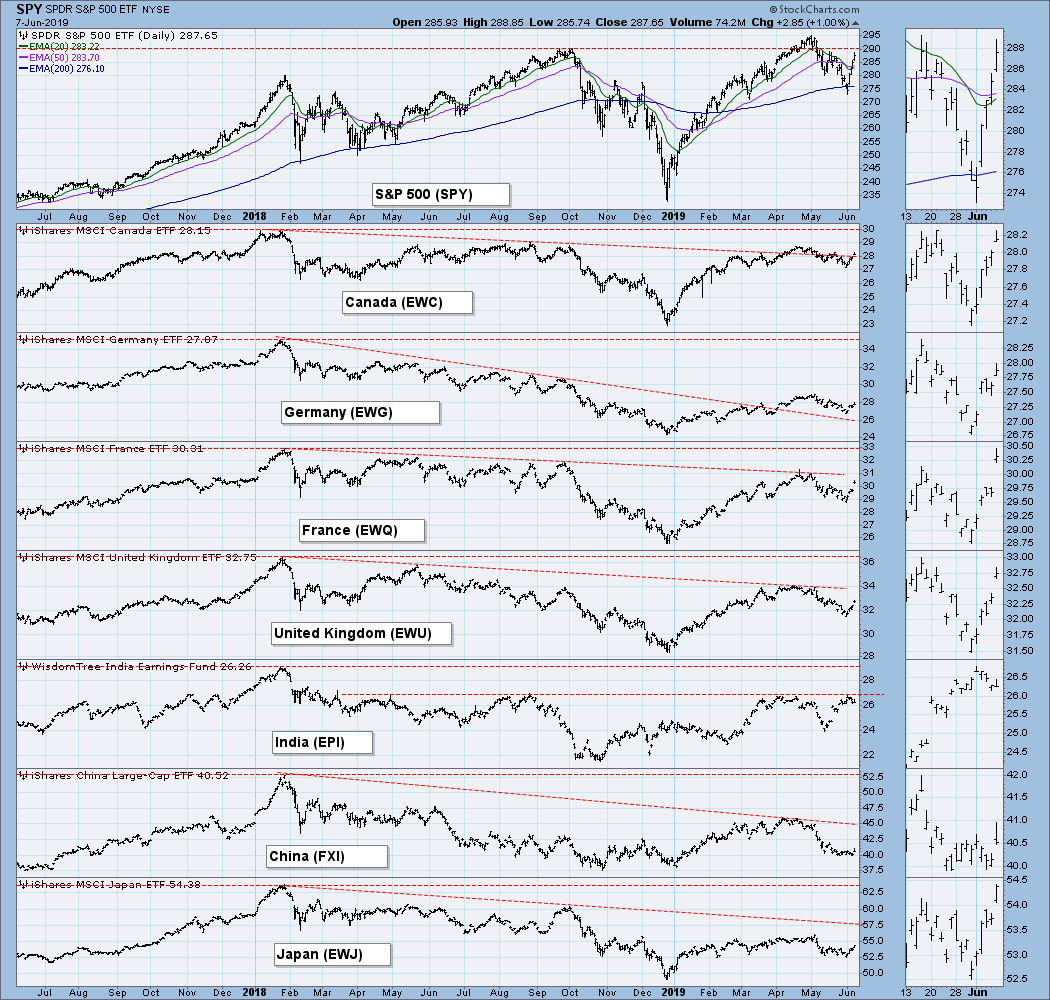
GLOBAL MARKETS
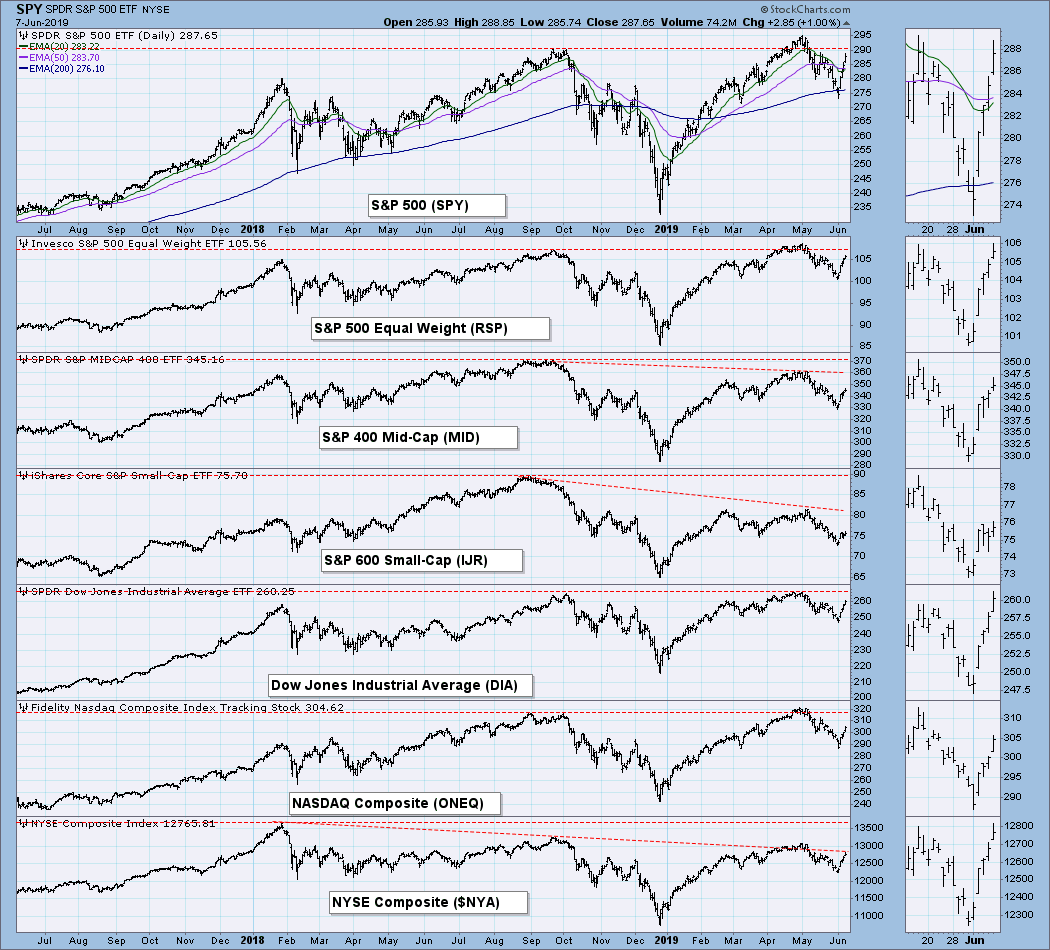
BROAD MARKET INDEXES
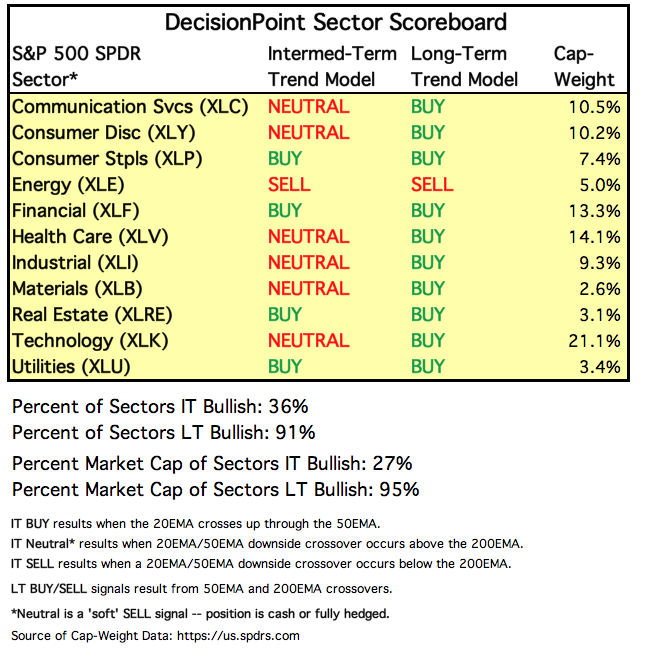
SECTORS
Each S&P 500 Index component stock is assigned to one, and only one, of 11 major sectors. This is a snapshot of the Intermediate-Term and Long-Term Trend Model signal status for those sectors.
STOCKS
IT Trend Model: NEUTRAL as of 5/31/2019
LT Trend Model: BUY as of 2/26/2019
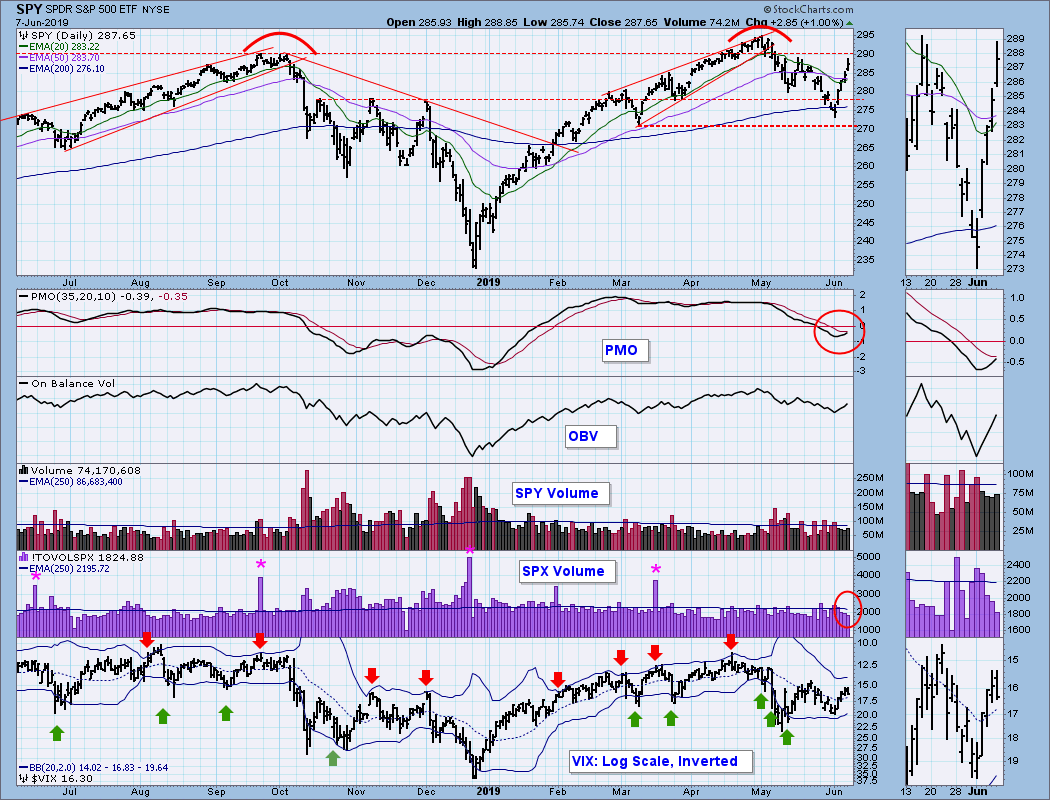
SPY Daily Chart: My double top scenario is in jeopardy, but still valid. The daily PMO bottom is picture perfect, with no hesitation in the forming of the bottom; although, it would be better if it had gone deeper. SPX volume has been pretty weak for such a vigorous rally.
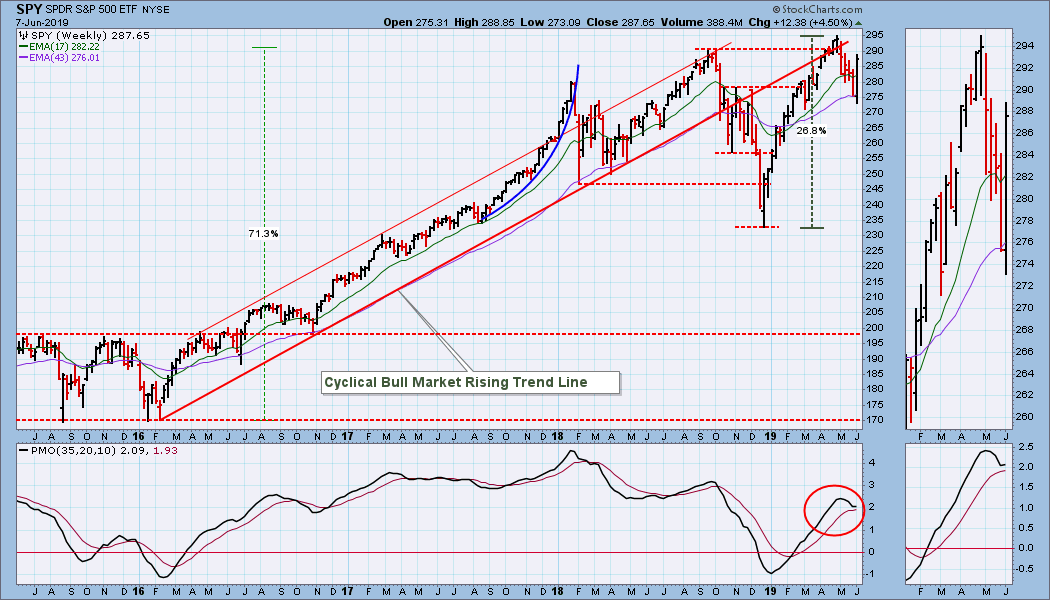
SPY Weekly Chart: There is a lot to like about this chart -- a +4.5% advance which turned the weekly PMO up.
Climactic Market Indicators: On Friday new 52-week highs for the S&P 500 were about double what they were in April, but for other major indexes (NYSE Comp, S&P 400, S&P 600, Nasdaq 100) they were only equal or lower. This shows that participation is narrowing with large-cap stocks in the lead -- not ideal.
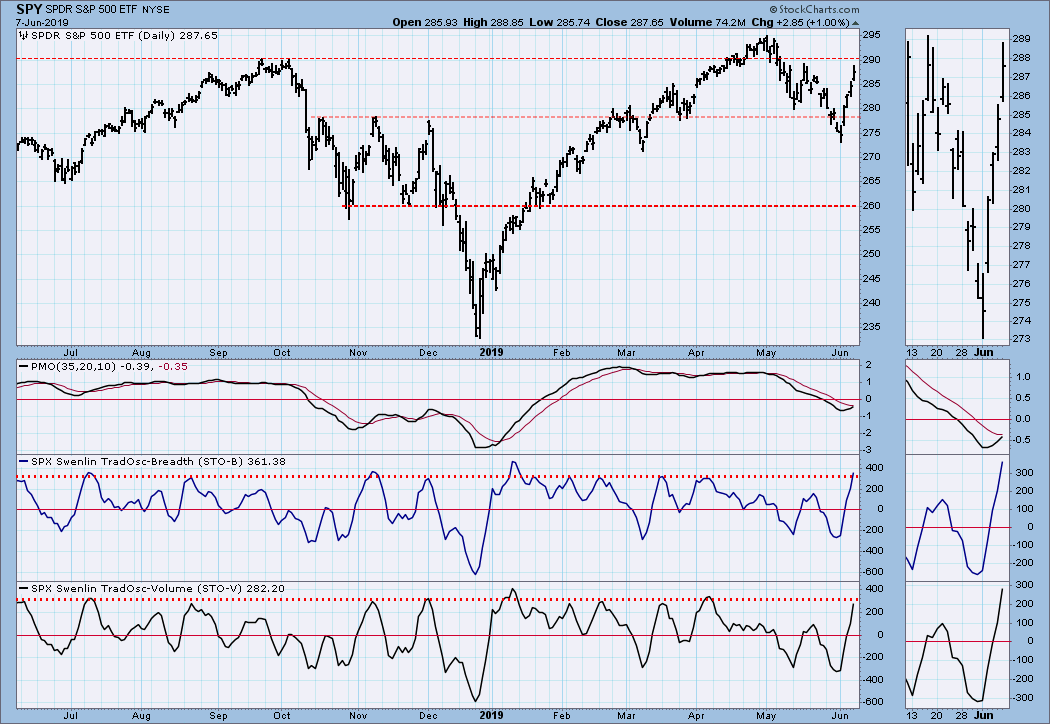
 Short-Term Market Indicators: The STO-B and STO-V are clearly overbought.
Intermediate-Term Market Indicators: Everything has turned up, and there is plenty of room for the indicators to move higher if the market does so.
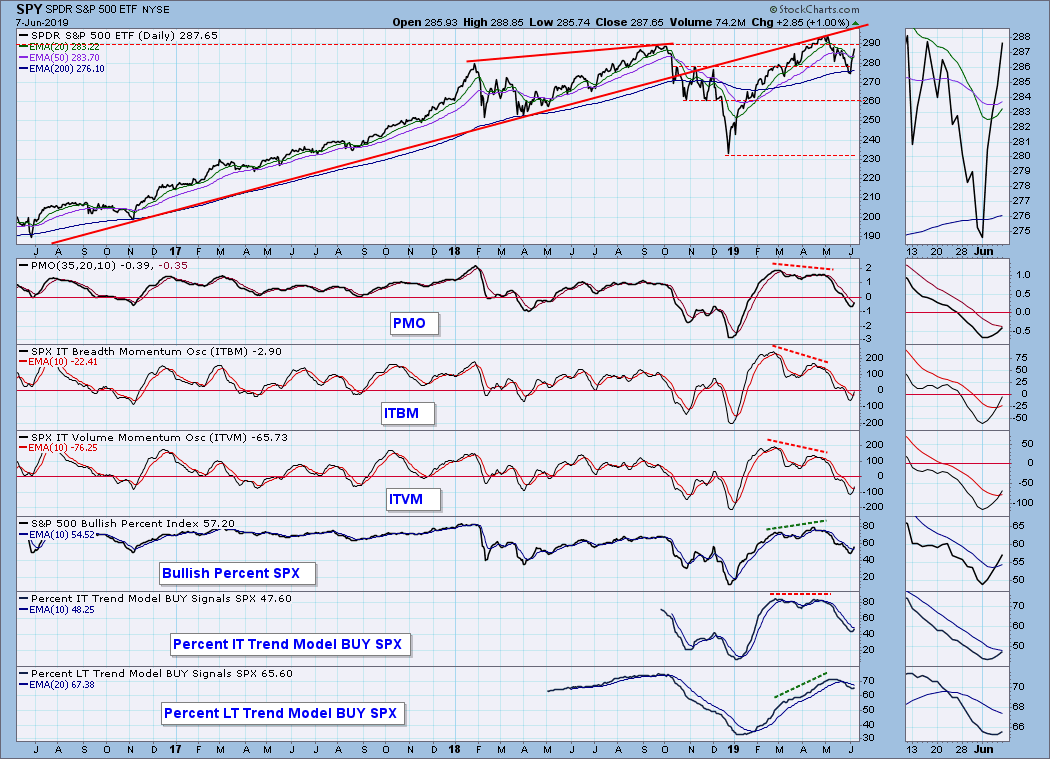
CONCLUSION: The Fed chief's dovish comments this week sparked the rally and added to speculation that the Fed will cut interest rates at the June 19 announcement. What do you suppose will happen to the market if the Fed doesn't cut rates? There are seven trading days until the Fed announcement, but in the meantime the market is well within reach of making new, all-time highs before then. The problem I have with the rally is that volume dried up the last three days, and participation has narrowed sharply, as demonstrated by the S&P 500 doubling new highs from what they were at the April top; whereas, other major indexes were not even close to that. While the intermediate-term chart immediately above is very bullish, the short-term indicators are overbought, and a short pullback is likely.
DOLLAR (UUP)
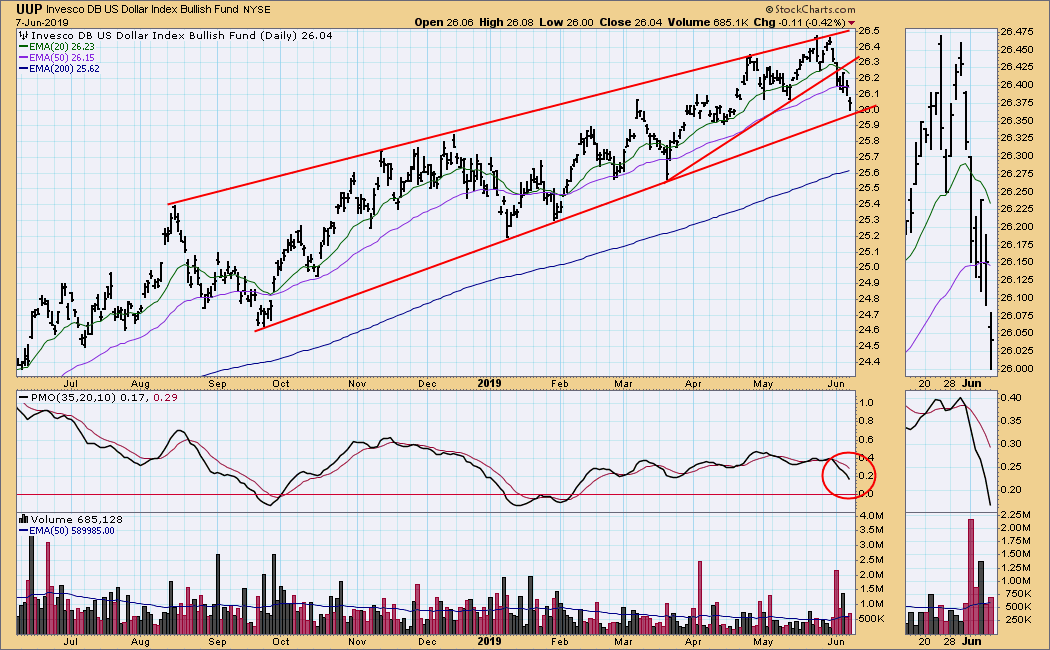
IT Trend Model: BUY as of 2/7/2019
LT Trend Model: BUY as of 5/25/2018
UUP Daily Chart: The short-term rising wedge resolved nicely to the downside, and the bottom of the larger rising wedge may be tested next week.
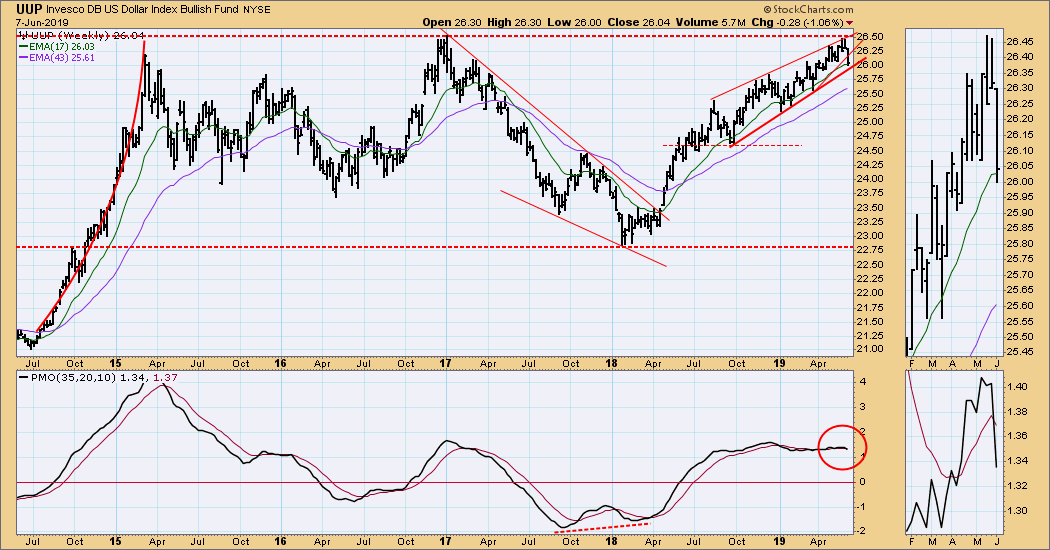
UUP Weekly Chart: The long-term resistance line turned UUP back down this week, but the weekly PMO tells us that internal strength may still be strong enough to push up for another challenge of the long-term resistance.
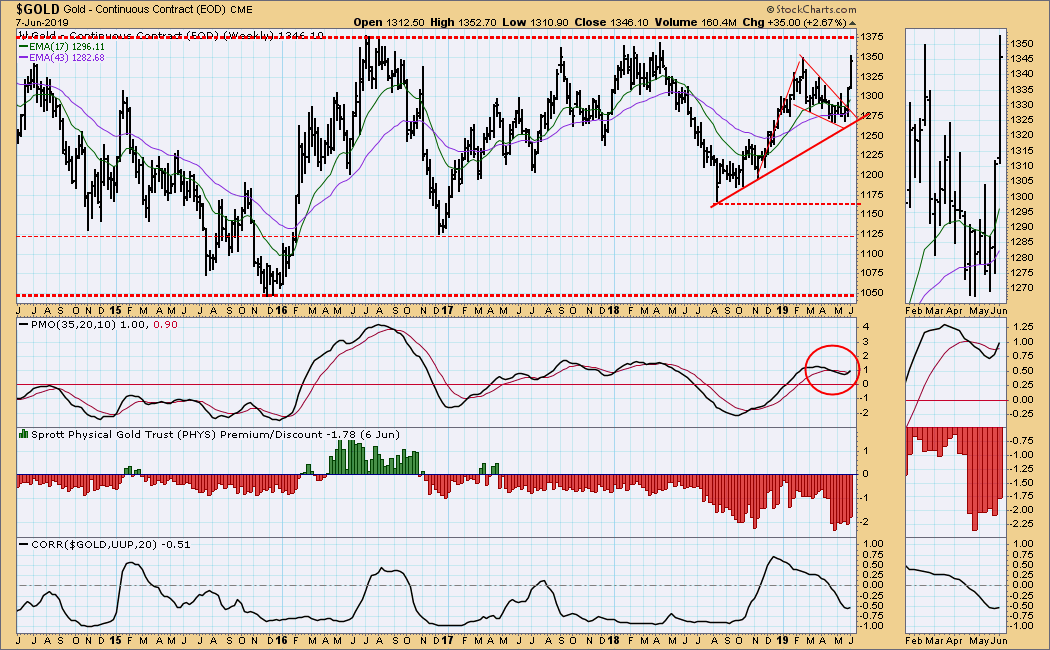
GOLD
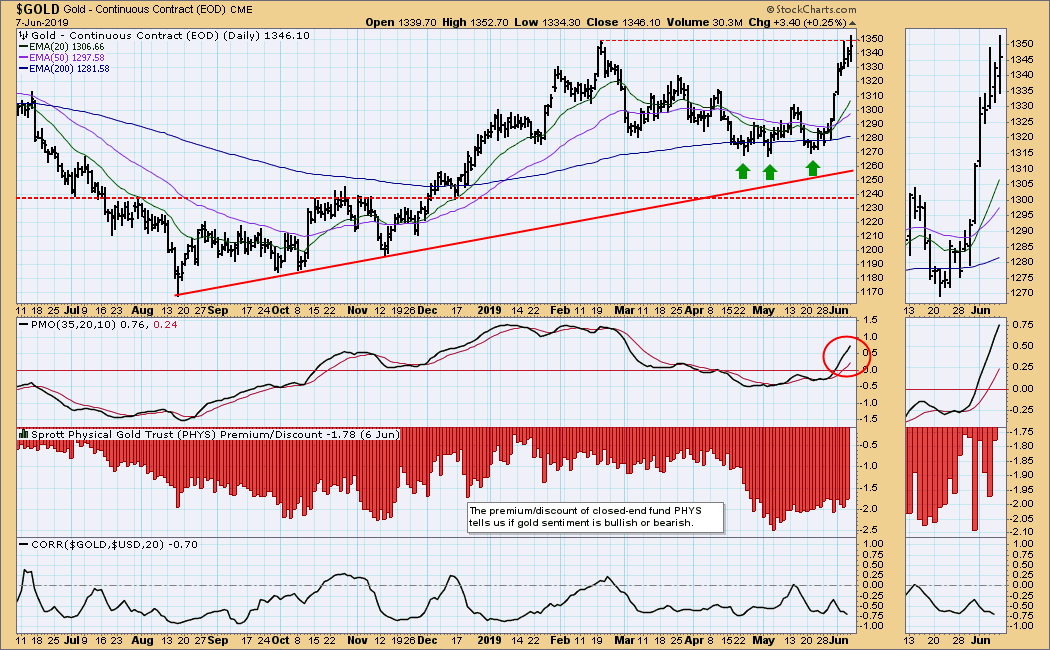
IT Trend Model: BUY as of 6/3/2019
LT Trend Model: BUY as of 1/8/2019
GOLD Daily Chart: This week gold hit the resistance line drawn across the February top, but before it did it added on a nice extension to last week's breakout. The PMO reflects strength, but sentiment remains bearish. (Sentiment needs to turn bullish before we can have confidence in any price advance.
GOLD Weekly Chart: The resistance on the daily chart doesn't amount to much compared to the long-term resistance on this weekly chart. But the weekly PMO is positive, and the dollar has been weak.
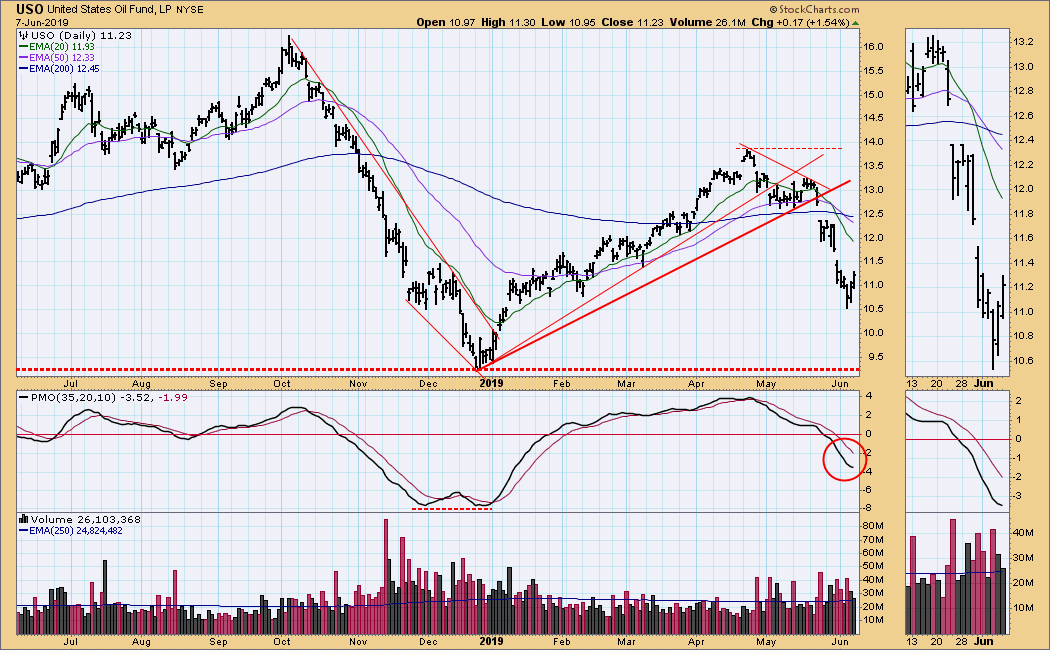
CRUDE OIL (USO)
IT Trend Model: NEUTRAL as of 5/30/2019
LT Trend Model: SELL as of 6/4/2019
USO Daily Chart: On Tuesday the USO 50EMA crossed down through the 200EMA causing the LT Trend Model to change from BUY to SELL.
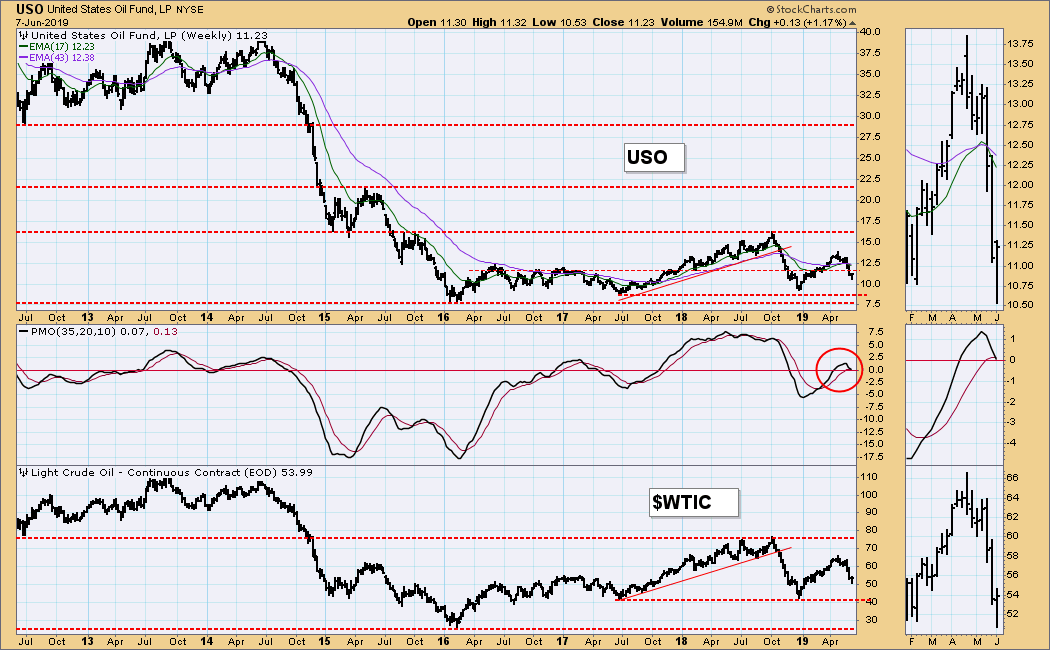
USO Weekly Chart: In spite of a deep dive this week, USO managed to close up; however, the weekly PMO crossed down through the signal line. Notice that WTIC is in the lower half of its trading range, and a decline to about $42 is not out of the question.
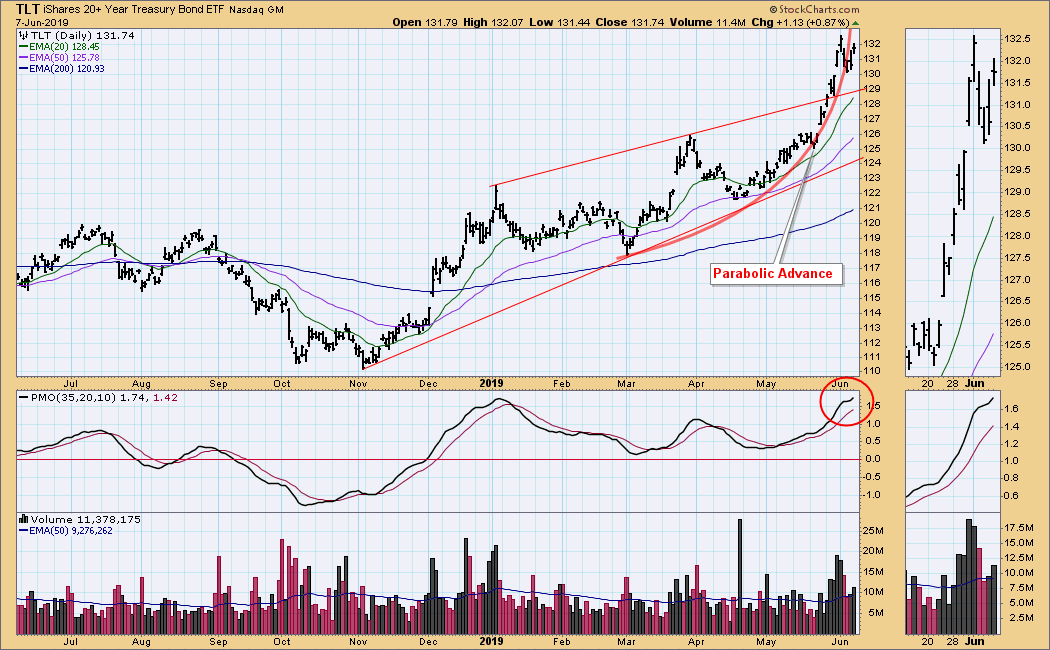
BONDS (TLT)
IT Trend Model: BUY as of 12/6/2018
LT Trend Model: BUY as of 1/2/2019
TLT Daily Chart: Last week I pointed out the parabolic advance that really accelerated last month. It is a sign that bond buying is getting a bit frenzied, and it is a warning that a sharp pullback is likely. Long-term parabolic collapses can be catastrophic, but this parabolic is short-term and I would expect no more than short-term damage -- maybe a move back to the rising trend line.
TLT Weekly Chart: In this time frame we can see that all-time high resistance is just ahead, so the parabolic resolution could movement down to the top of the recently vacated trading range.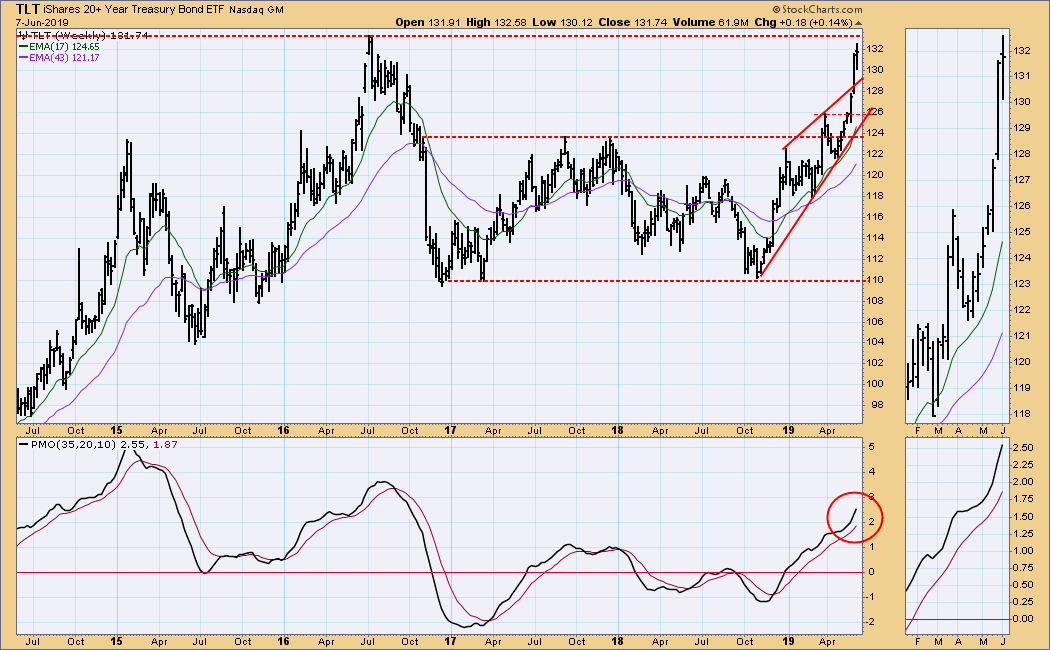
**Don't miss any of the DecisionPoint commentaries! Go to the "Notify Me" box toward the end of this blog page to be notified as soon as they are published.**
Technical Analysis is a windsock, not a crystal ball.
Happy Charting!
- Carl
NOTE: The signal status reported herein is based upon mechanical trading model signals, specifically, the DecisionPoint Trend Model. They define the implied bias of the price index based upon moving average relationships, but they do not necessarily call for a specific action. They are information flags that should prompt chart review. Further, they do not call for continuous buying or selling during the life of the signal. For example, a BUY signal will probably (but not necessarily) return the best results if action is taken soon after the signal is generated. Additional opportunities for buying may be found as price zigzags higher, but the trader must look for optimum entry points. Conversely, exit points to preserve gains (or minimize losses) may be evident before the model mechanically closes the signal.
Helpful DecisionPoint Links:
DecisionPoint Shared ChartList and DecisionPoint Chart Gallery
Price Momentum Oscillator (PMO)
Swenlin Trading Oscillators (STO-B and STO-V)


