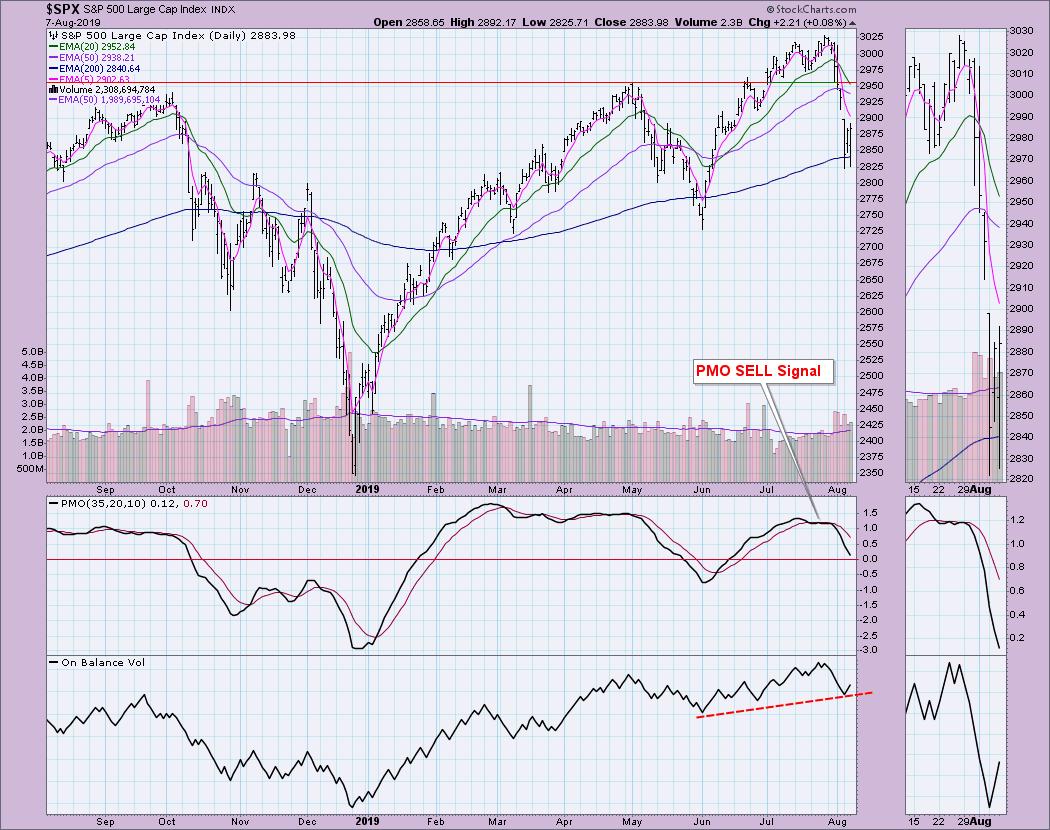
 It's been a difficult week for the markets since the last publication of the Mid-Week Alert and the knife is falling fast. However, I'm putting my hands out there right now to catch it based on signs of life on our short-term indicators. The market is very oversold and the recovery going into the close today was quite encouraging. The DecisionPoint Scoreboards show the signs of deterioration that were popping up at the end of July with the PMO SELL signals. Since then, the price trends have turned neutral. The 5-EMAs have crossed below their 20-EMAs while above the 50-EMA. Had the cross occurred below the 50-EMA, then we would have seen SELL signals.
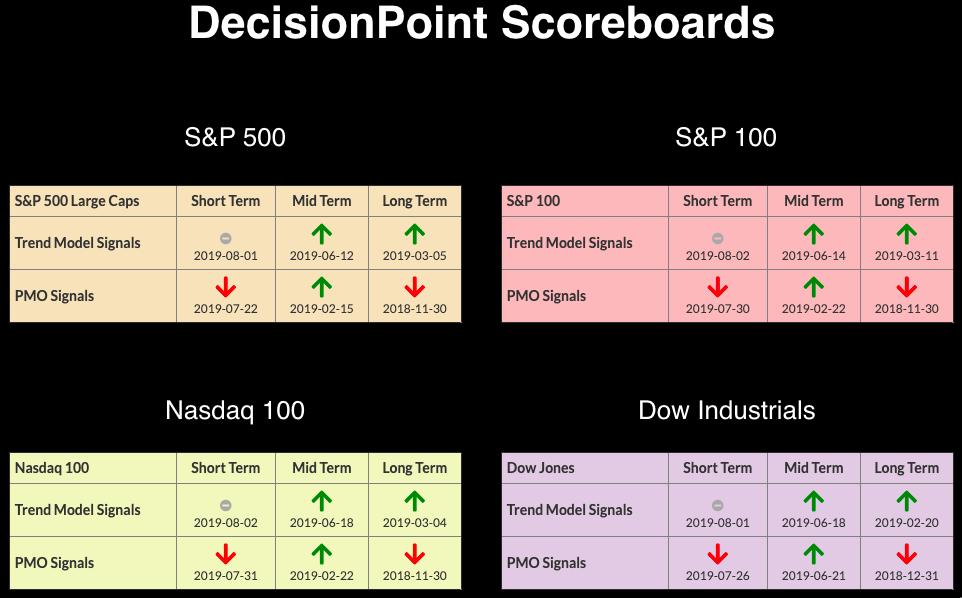
The DecisionPoint Alert presents a mid-week assessment of the trend and condition of the stock market (S&P 500), the U.S. Dollar, Gold, Crude Oil and Bonds.
Watch the latest episode of DecisionPoint on StockCharts TV's YouTube channel here!
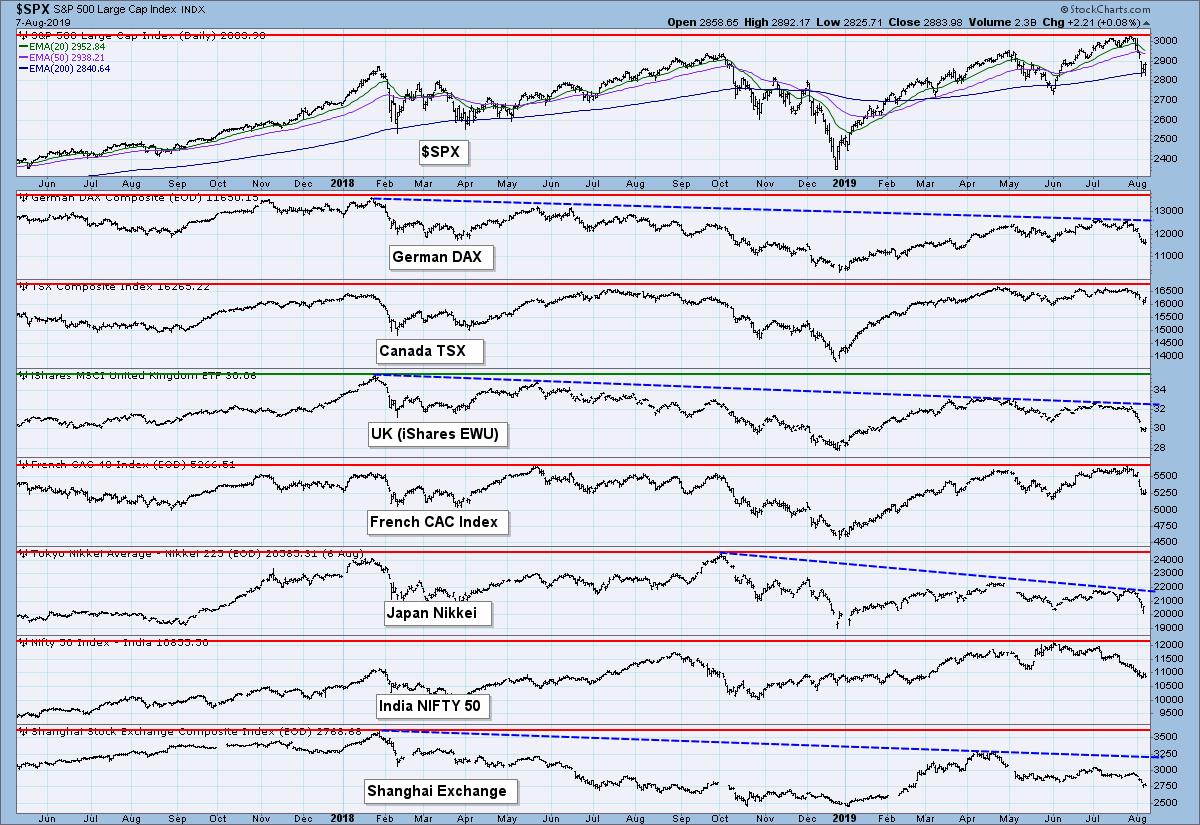
GLOBAL MARKETS
The Canadian market and India's Nifty 50 are the only global markets currently making new all-time highs alongside the SPX.
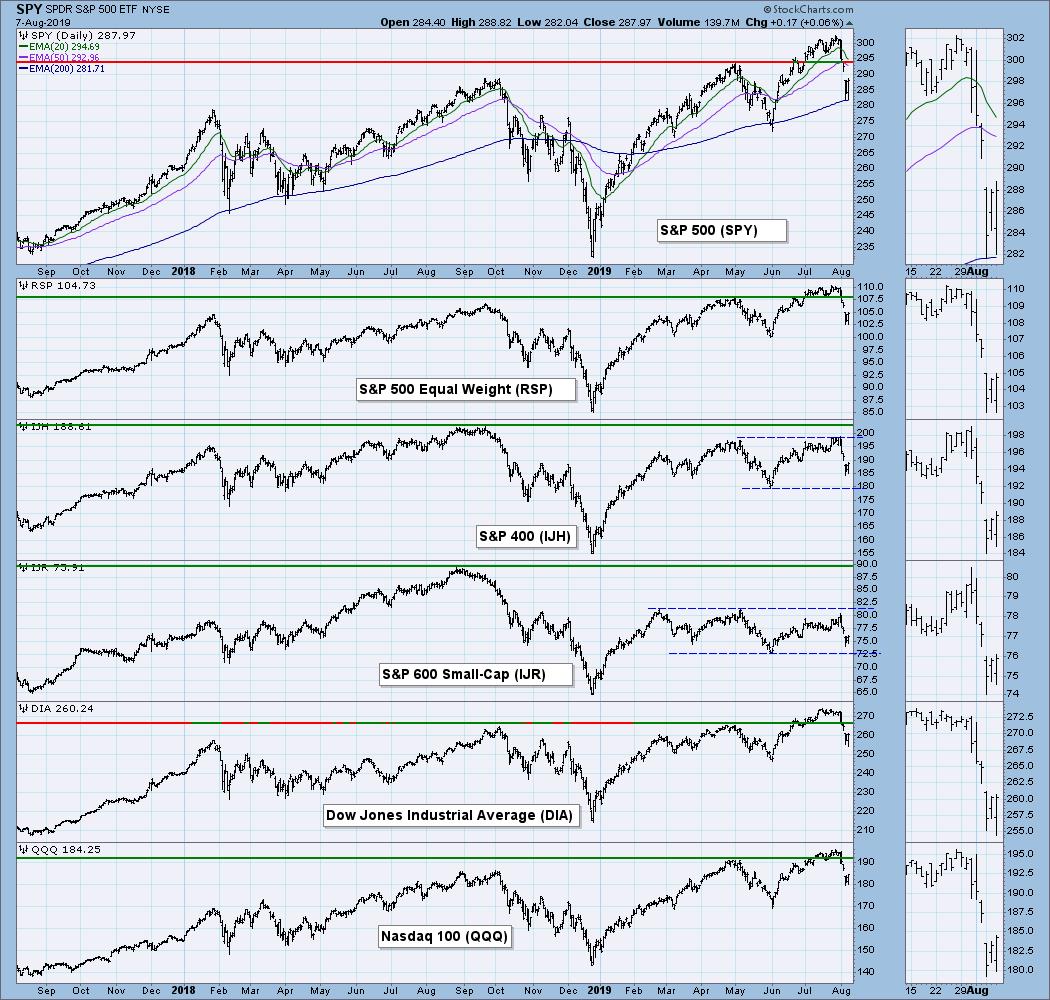
BROAD MARKET INDEXES
I'm still looking for small- and mid-caps to break out and at least begin to challenge the 2018 all-time highs.
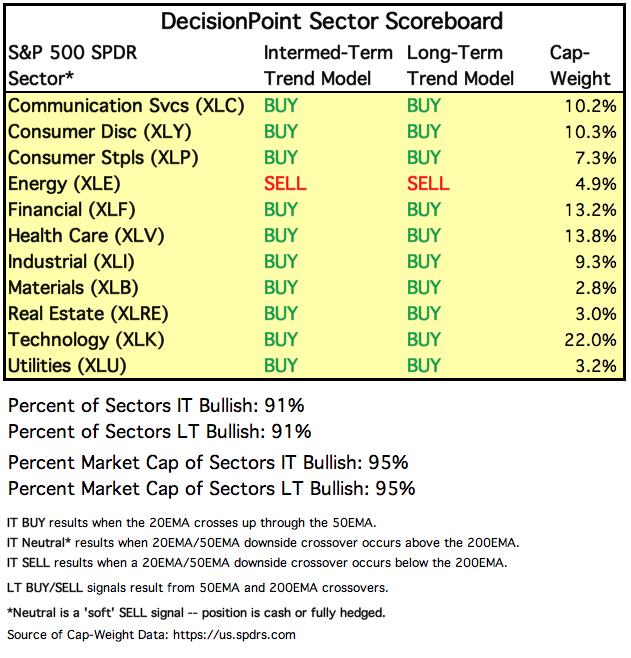
SECTORS
Each S&P 500 Index component stock is assigned to one, and only one, of eleven major sectors. This is a snapshot of the Intermediate-Term and Long-Term Trend Model signal status for those sectors.
STOCKS
IT Trend Model: BUY as of 6/11/2019
LT Trend Model: BUY (SPY) as of 2/26/2019
SPY Daily Chart: Price has managed to cling just above the 200-EMA. The PMO, although in decline, remains above zero. This is a good place to find support. If the 200-EMA is lost, I would look for price to hold 2800; if not, of course, there is the fateful 2725 level. Good to see that the OBV logged a bottom above the previous two.
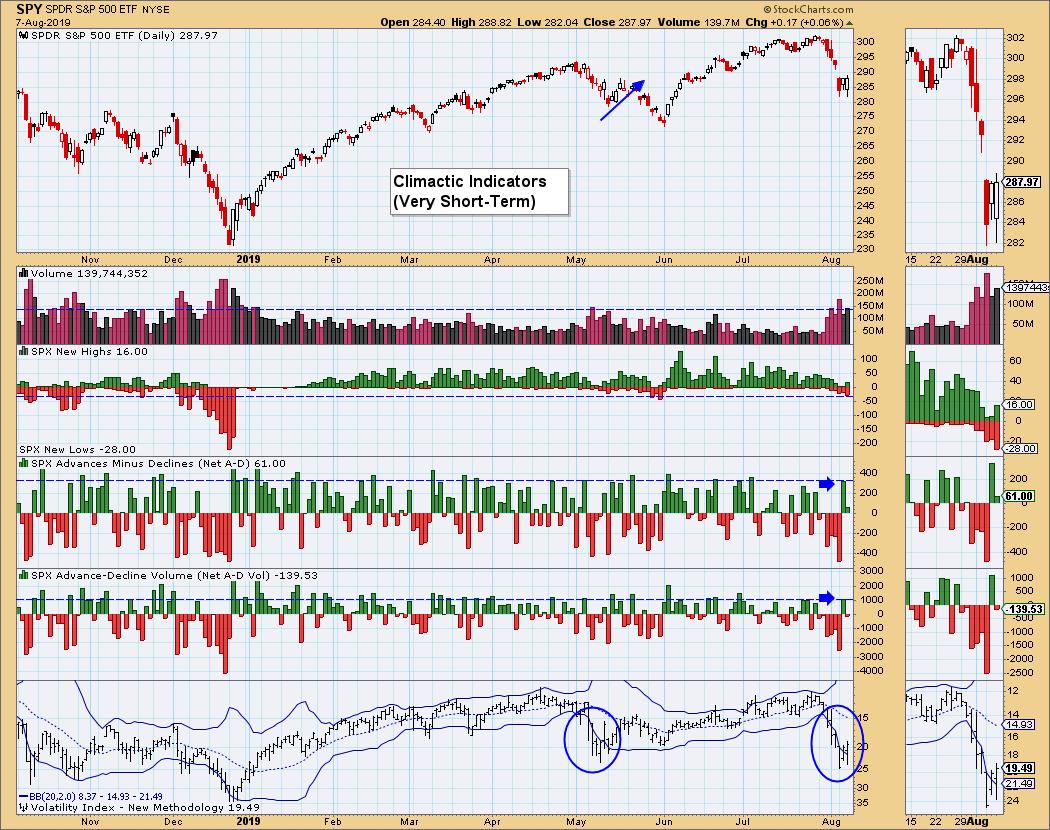
Climactic Market Indicators: This is where I'm seeing some signs of a selling exhaustion or, better said, a buying initiation. Yesterday, we saw a great deal of positive breadth that accompanied a VIX close within the Bollinger Bands. I saw that as a likely buying initiation. Today's price action during the day had me a bit worried, but the SPX managed to eke out a positive close. The VIX, while puncturing the lower Bollinger Band, still managed to close within it, as it did yesterday. This is a sign of a short-term bottom. However, don't get too excited; we saw the same activity back in May and it resulted in a mild rally followed by more decline.
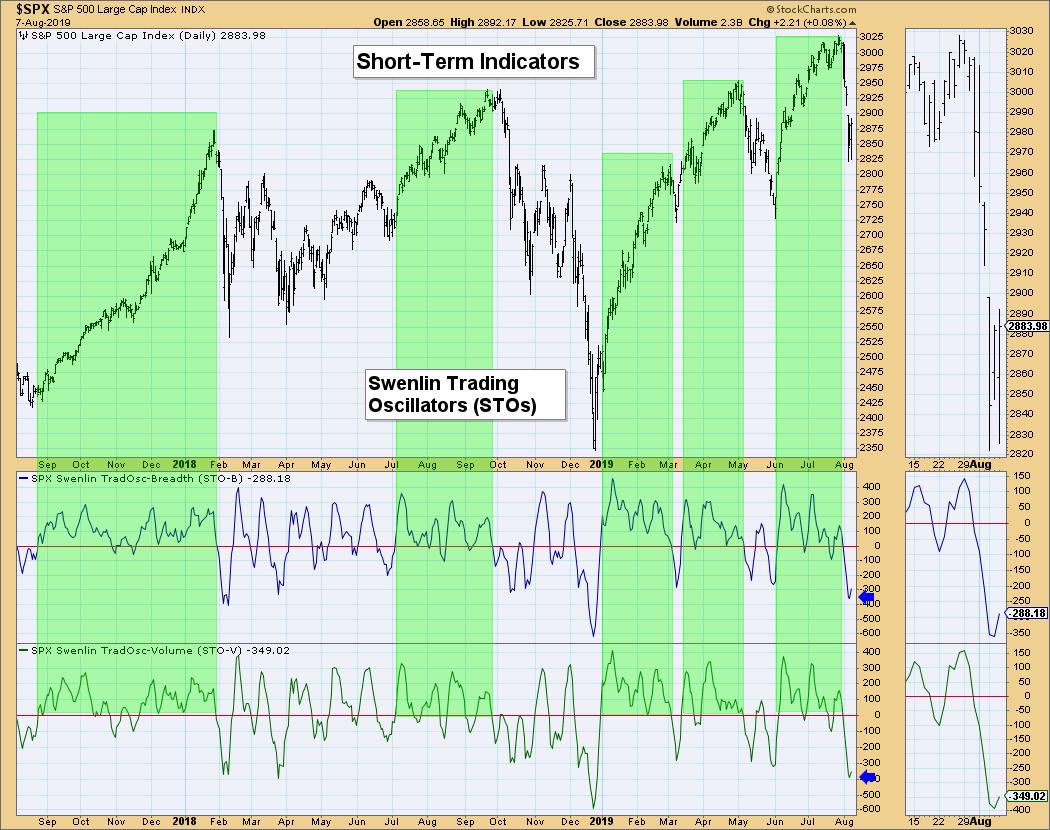
Short-Term Market Indicators: Yesterday, the Swenlin Trading Oscillators (STOs) began to decelerate. Today both have turned higher, albeit a tiny move to the upside. I think this is another sign that we are at a short-term bottom.
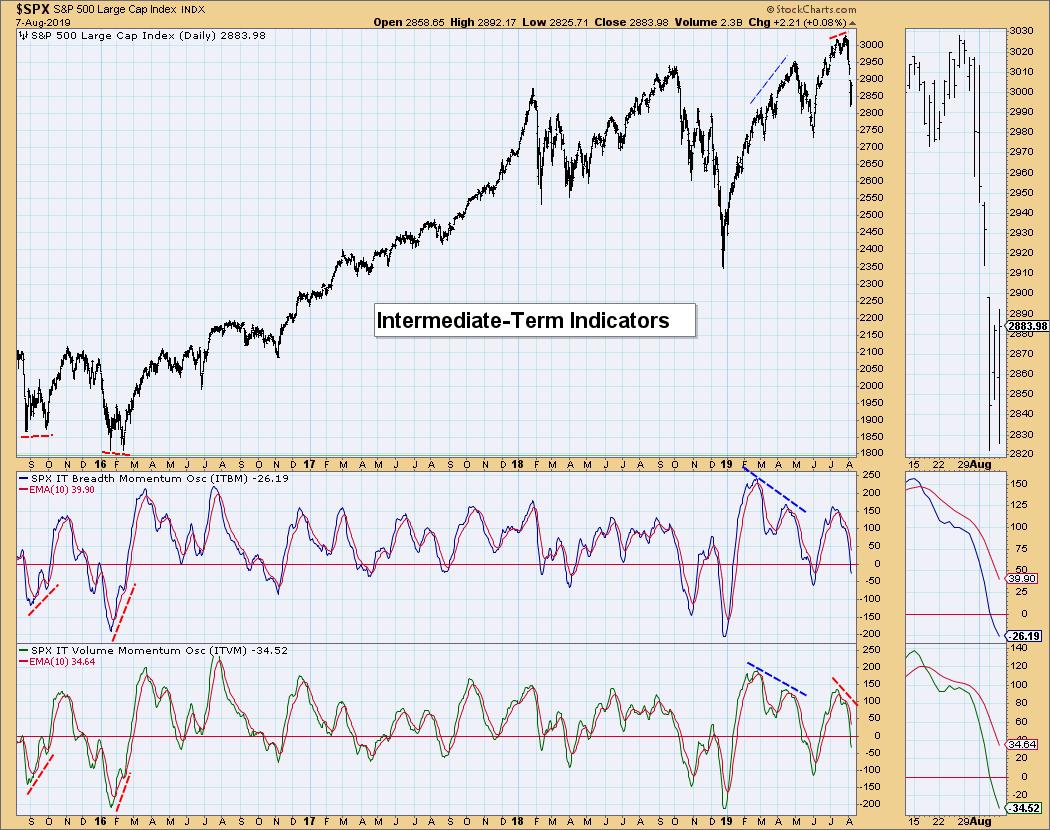
Intermediate-Term Market Indicators: Intermediate-term doesn't look quite that rosy. I think this speaks to the possibility of a small rally off this bottom followed by a resumption of the correction. Again, look at May.
Conclusion: I am hoping my hands don't end up bloodied, but it looks like a short-term bottom is in or arriving based on the climactic activity on breadth and improvement in the VIX. Unfortunately, I don't think it is going to result in another move to all-time highs. Intermediate-term indicators are too gloomy right now.
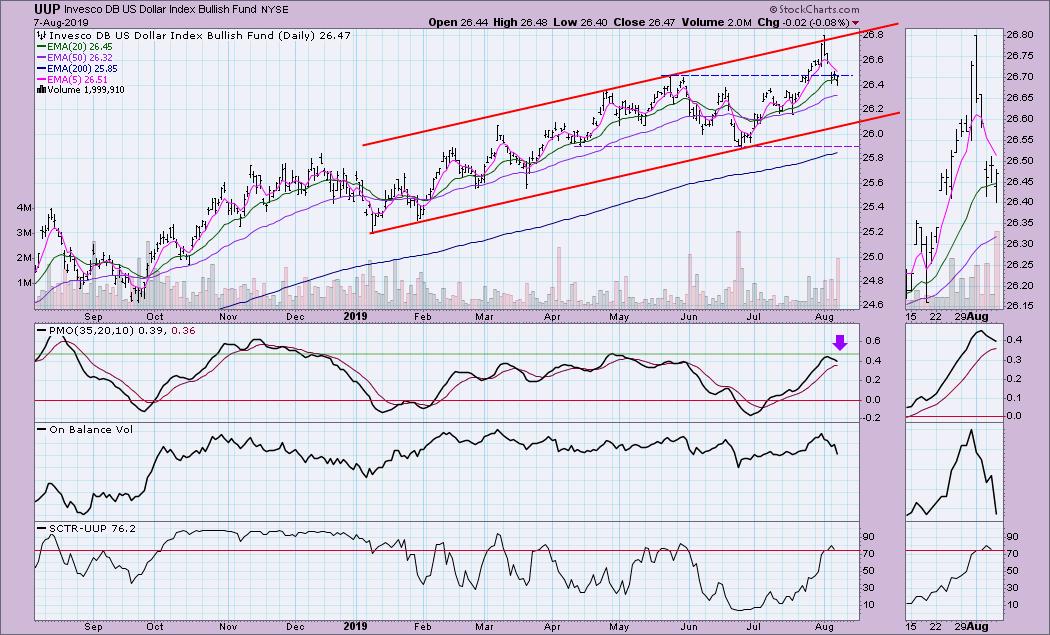
DOLLAR (UUP)
IT Trend Model: BUY as of 2/7/2019
LT Trend Model: BUY as of 5/25/2018
UUP Daily Chart: Overall, UUP and the Dollar have been in a rising trend. Maybe not a perfect trend channel, but close enough. Price hit the top of the channel and immediately headed back down. The gap will close at about $26.35, which is close to the 50-EMA. That could hold as support, but I am more inclined to look for a decline that will test the bottom of this channel. The PMO is overbought and headed lower, which confirms that supposition.
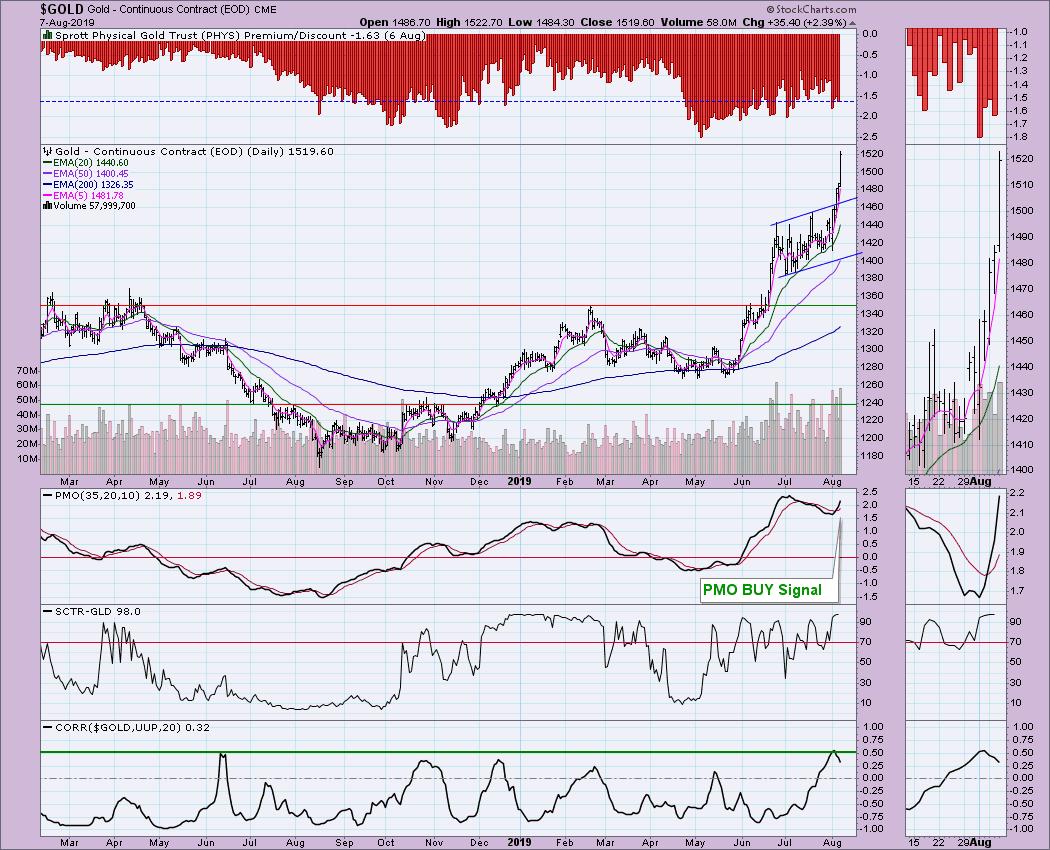
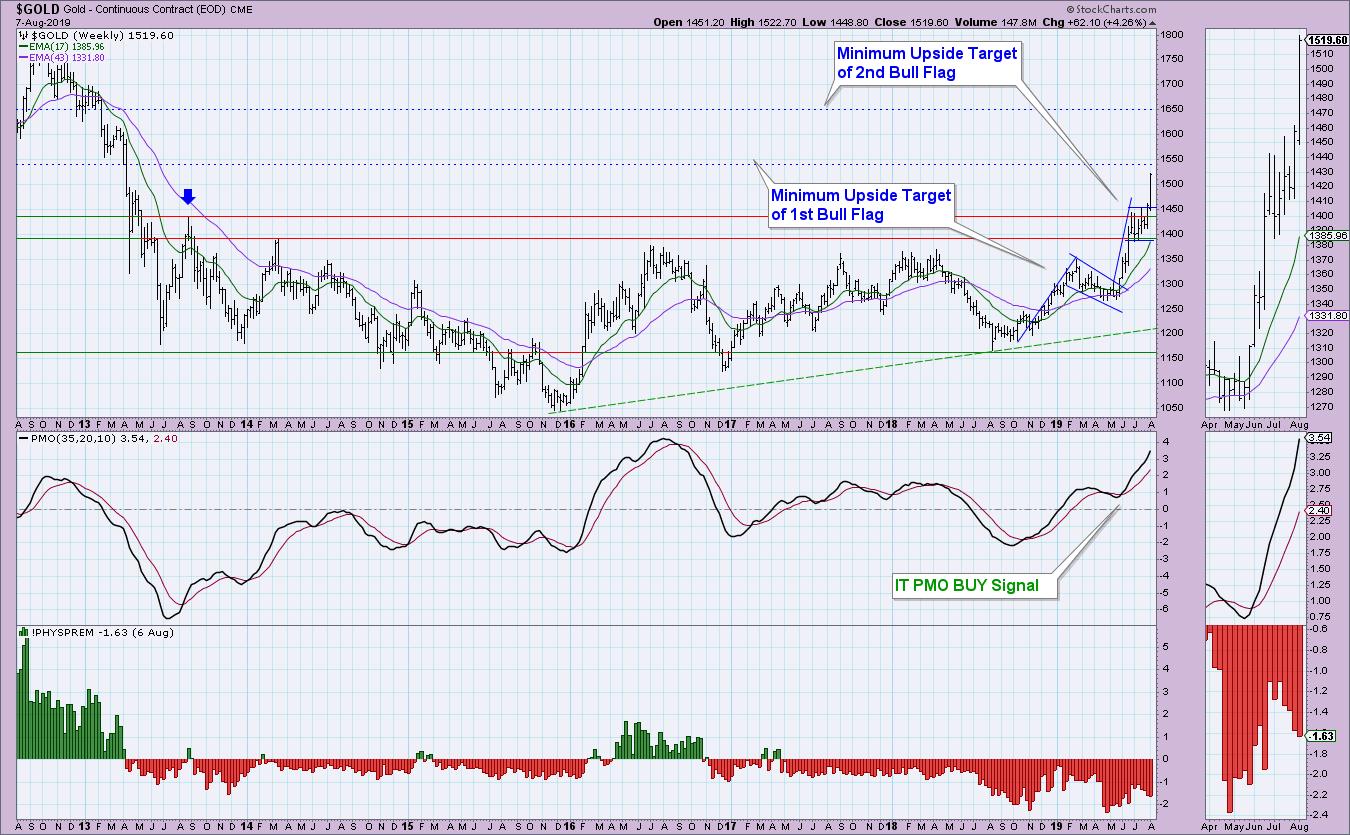
GOLD
IT Trend Model: BUY as of 6/3/2019
LT Trend Model: BUY as of 1/8/2019
GOLD Daily Chart: Gold continues to shine brightly! The move the daily chart is impressive, but I don't think you can really have perspective until you look at the weekly chart. I have marked the new minimum upside target for Gold based on the execution of this flag on the daily chart.
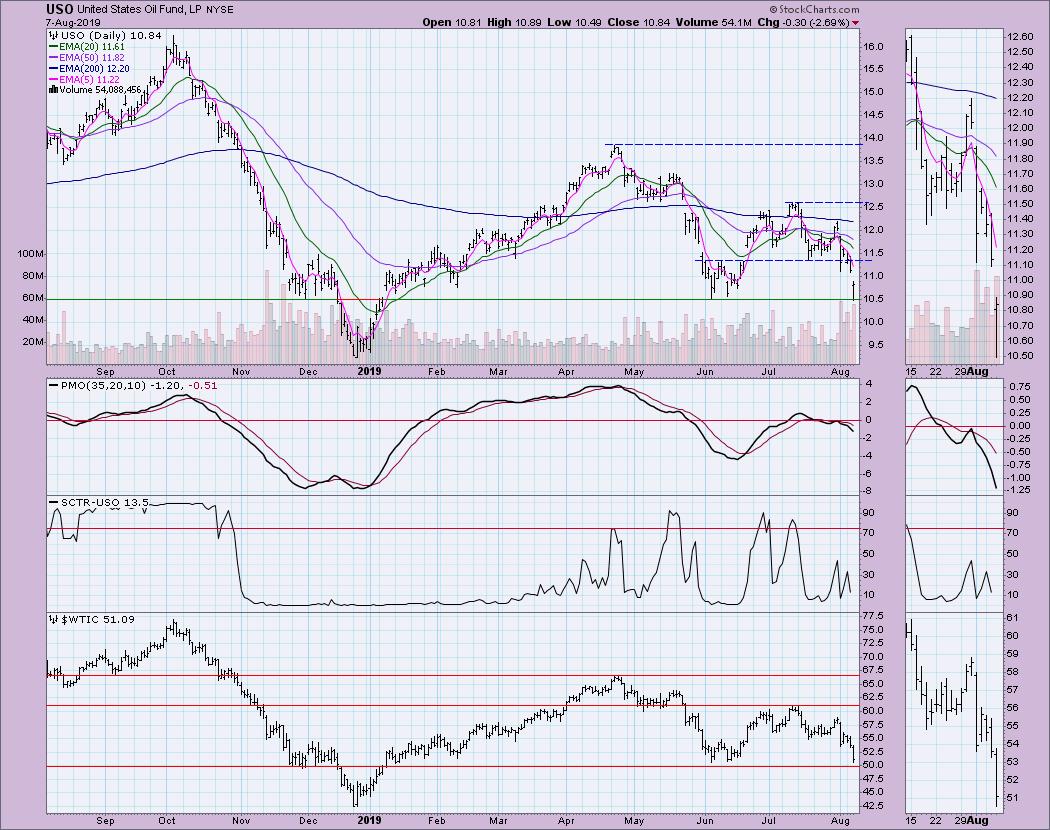
CRUDE OIL (USO)
IT Trend Model: Neutral as of 5/30/2019
LT Trend Model: SELL as of 6/4/2019
USO Daily Chart: Today, USO tested important support at $10.50. The negative PMO suggests this will not hold, as does the very high negative volume on USO this past week. If it's going to turn, this is the place to do it and quickly.
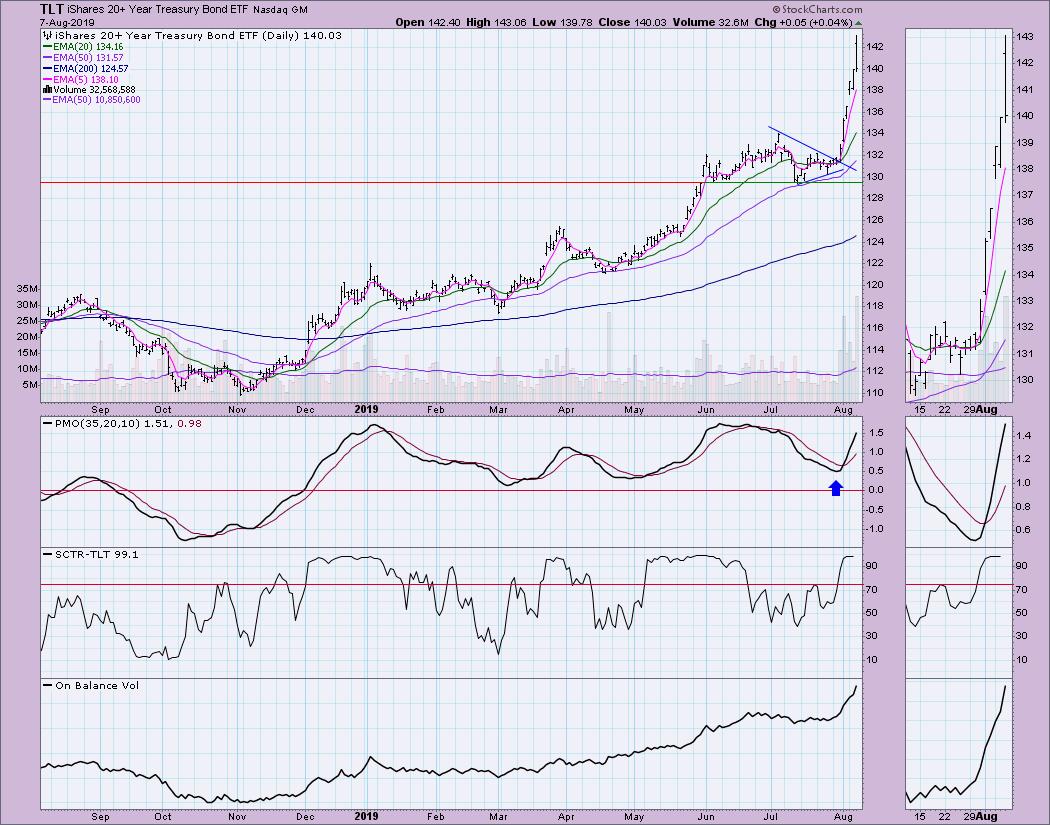
BONDS (TLT)
IT Trend Model: BUY as of 12/6/2018
LT Trend Model: BUY as of 1/2/2019
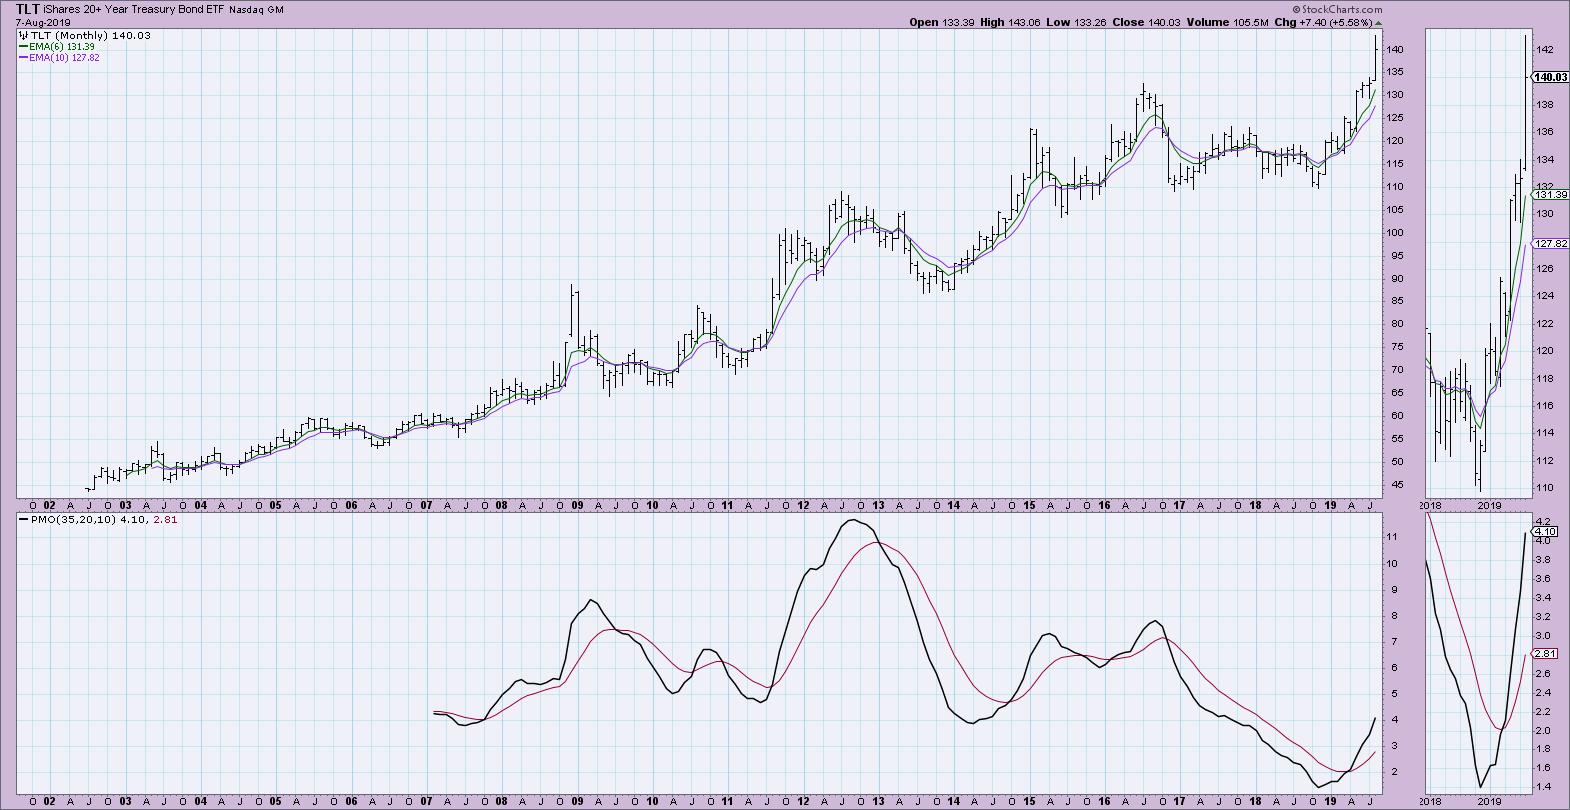
TLT Daily Chart: Like Gold, Bonds are enjoying another crazy push to the upside. Also like Gold, I don't think you have the right perspective of this move until you look at the monthly chart. The PMO is rising strongly and is not overbought. TLT continues to log new all-time highs and, given the plummeting of treasury yields, I would expect this to continue. The PMO on the daily chart is overbought, but still looks hearty and ready to move even higher.
Technical Analysis is a windsock, not a crystal ball.
Happy Charting! - Erin
Email: erinh@stockcharts.com
**Don't miss any of the DecisionPoint commentaries! Go to the "Notify Me" box toward the end of this blog page to be notified as soon as they are published.**
NOTE: The signal status reported herein is based upon mechanical trading model signals, specifically, the DecisionPoint Trend Model. They define the implied bias of the price index based upon moving average relationships, but they do not necessarily call for a specific action. They are information flags that should prompt chart review. Further, they do not call for continuous buying or selling during the life of the signal. For example, a BUY signal will probably (but not necessarily) return the best results if action is taken soon after the signal is generated. Additional opportunities for buying may be found as price zigzags higher, but the trader must look for optimum entry points. Conversely, exit points to preserve gains (or minimize losses) may be evident before the model mechanically closes the signal.
Helpful DecisionPoint Links:
DecisionPoint Shared ChartList and DecisionPoint Chart Gallery
Price Momentum Oscillator (PMO)
Swenlin Trading Oscillators (STO-B and STO-V)


