While I work, I watch a business news channel with the sound turned down. It's not really a necessary activity, it's just what I do. One of the things I notice is that the commentators try to attribute news items to every market twitch, and most of the time it is laughable; however, once in a while there are news events that clearly move the market, this week giving us some good examples. On Wednesday the much anticipated Fed announcement delivered the expected quarter percentage point rate cut, but the hope was for a half point cut, and the market tanked. On Thursday the market rebounded strongly until the president threatened another 10% tariff on Chinese goods, and the market tanked again. On Friday the market seemed to stabilize at the open, but the Chinese threatened retaliatory tariffs, resulting in further selling. Through it all, I thought how it provided a fine opportunity to show how technical analysis helped to traverse the hazards, if indeed it was helpful at all.
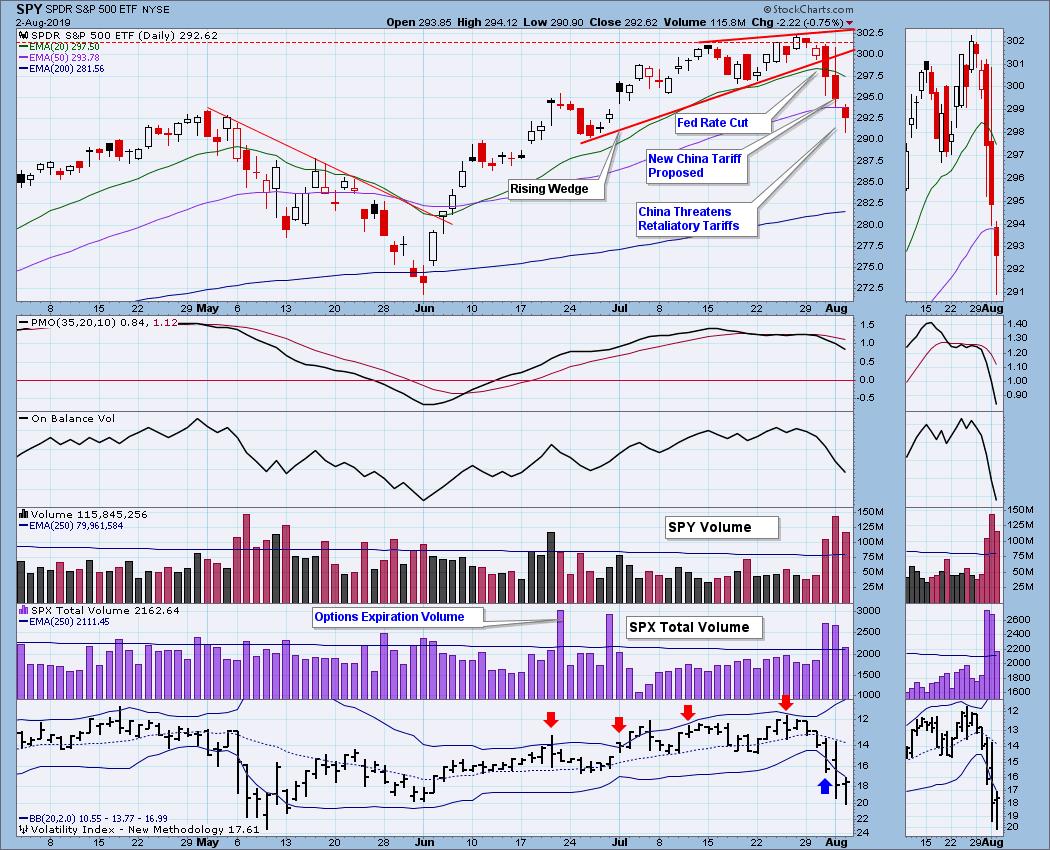
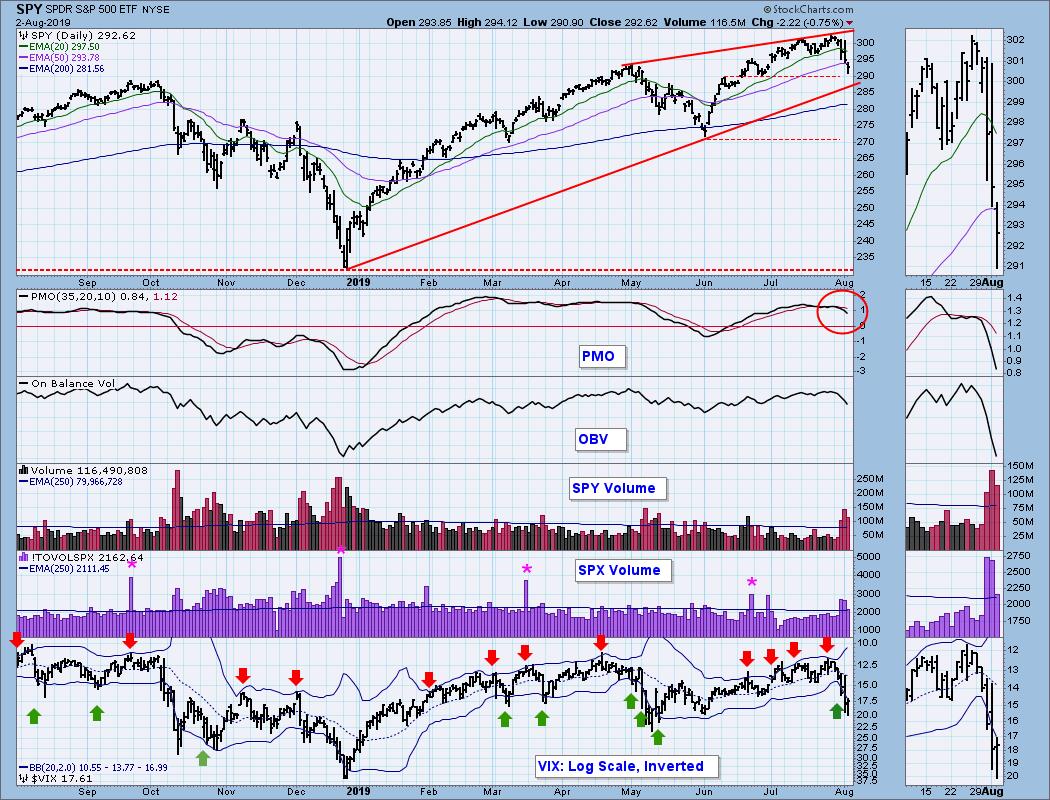
In some cases technical analysis can help us anticipate reactions to scheduled events. For example, the Fed announcement was long-anticipated, and you'll note on the chart above that a rising wedge formation appeared in advance of that event -- the final top forming on Monday. A rising wedge is a bearish formation, so we could anticipate that the reaction to the announcement would probably be negative, but there was no clue as to the magnitude of the reaction.
There was no advance warning of the president's proposal of new tariffs on Chinese, so there was no way to anticipate Thursday's decline, even though in hindsight the decline was not a surprise, given the news.
The last item of news I cited is more ambiguous regarding its effect on the market. The Chinese threat for retaliatory tariffs was also accompanied by the threat by the Chinese to impose martial law in Hong Kong. Was it one or the other, or both? Let's stay out of that rabbit hole and look in the rest of this report for other technical items that may have influenced our market stance.
The DecisionPoint Weekly Wrap presents an end-of-week assessment of the trend and condition of the stock market (S&P 500), the U.S. Dollar, Gold, Crude Oil, and Bonds.
Watch the latest episode of DecisionPoint on StockCharts TV's YouTube channel here!
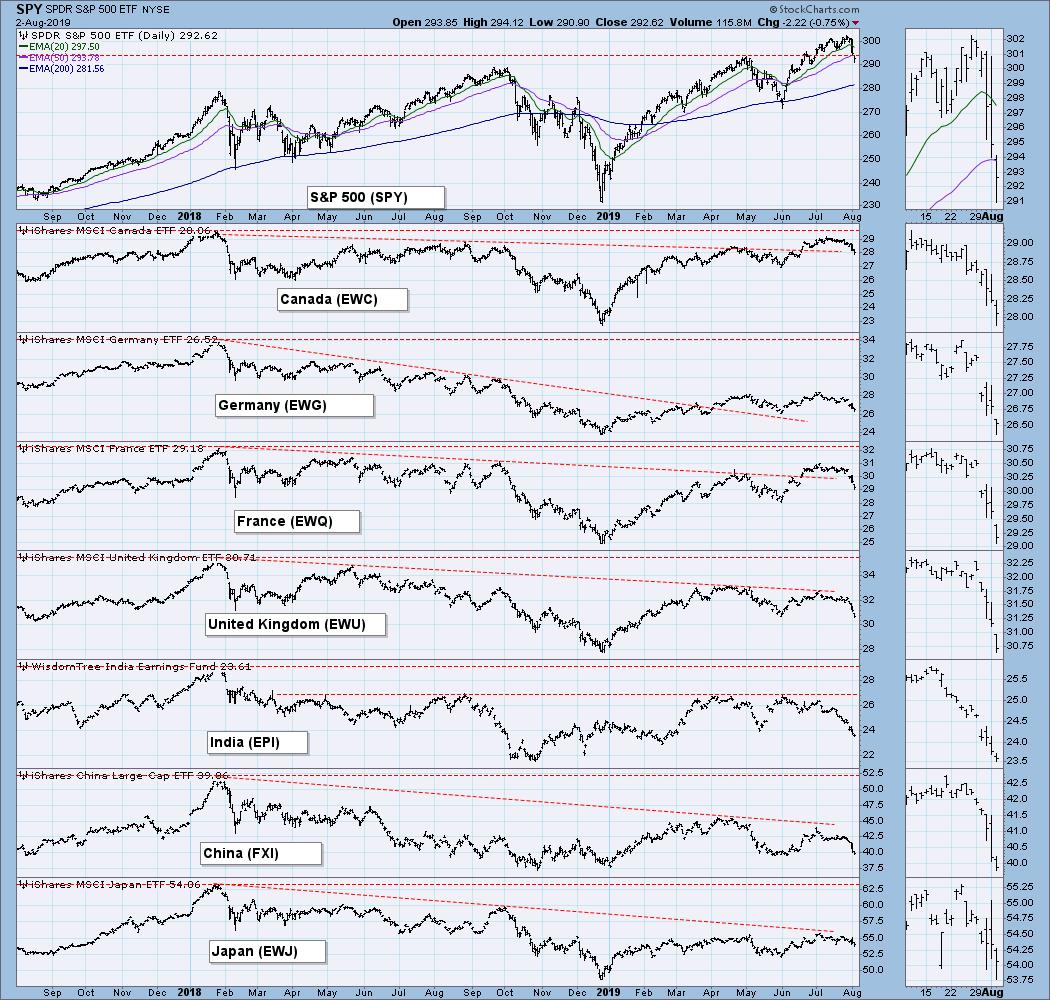
GLOBAL MARKETS
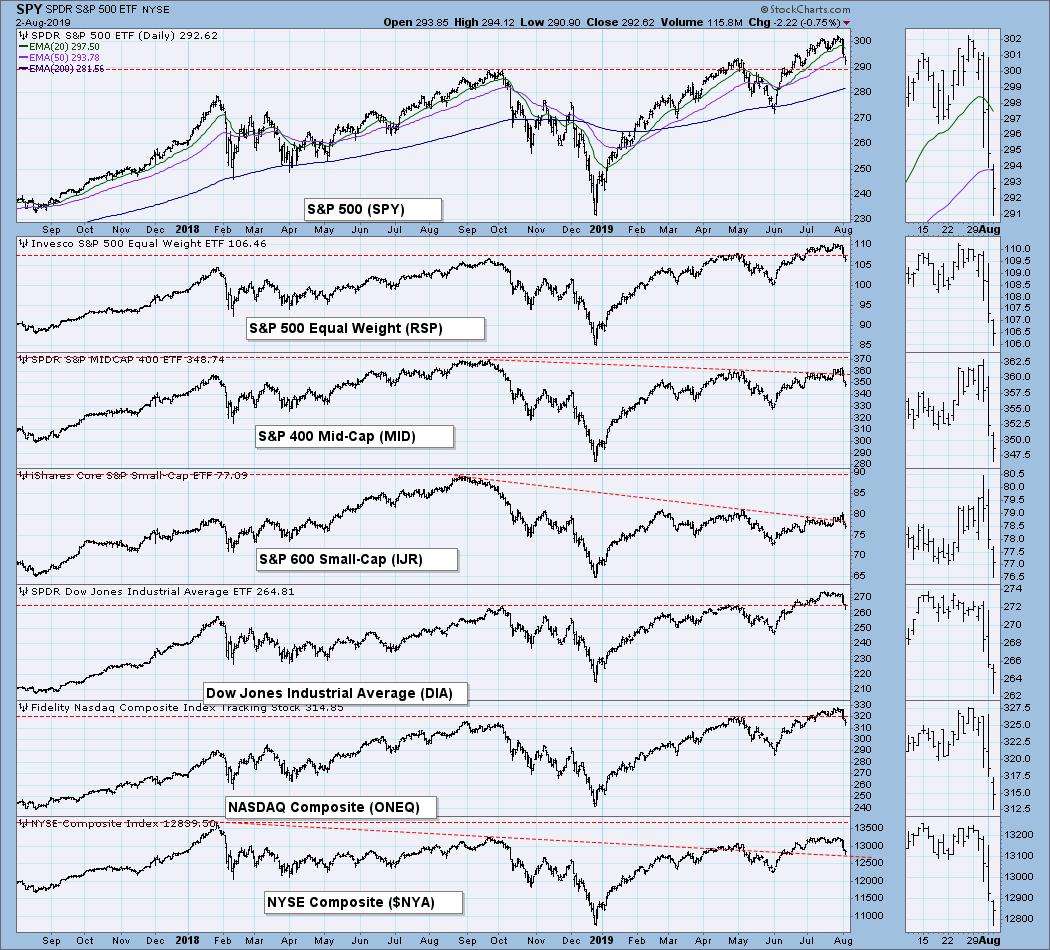
BROAD MARKET INDEXES
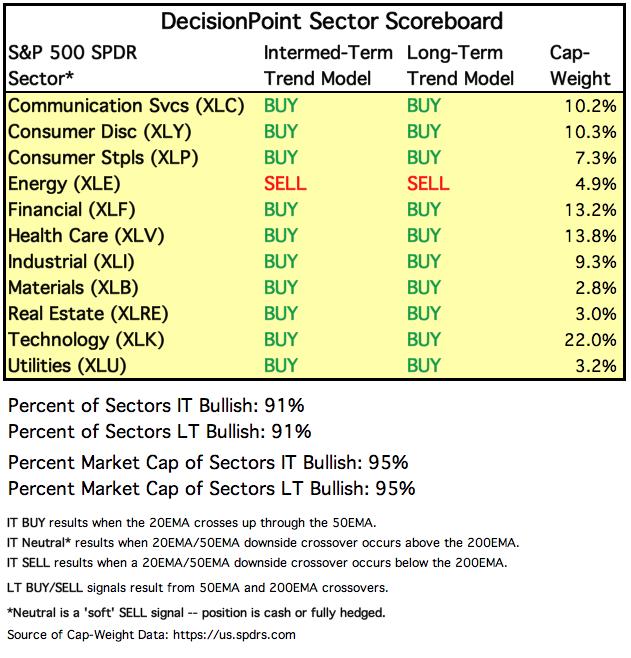
SECTORS
Each S&P 500 Index component stock is assigned to one, and only one, of 11 major sectors. This is a snapshot of the Intermediate-Term and Long-Term Trend Model signal status for those sectors.
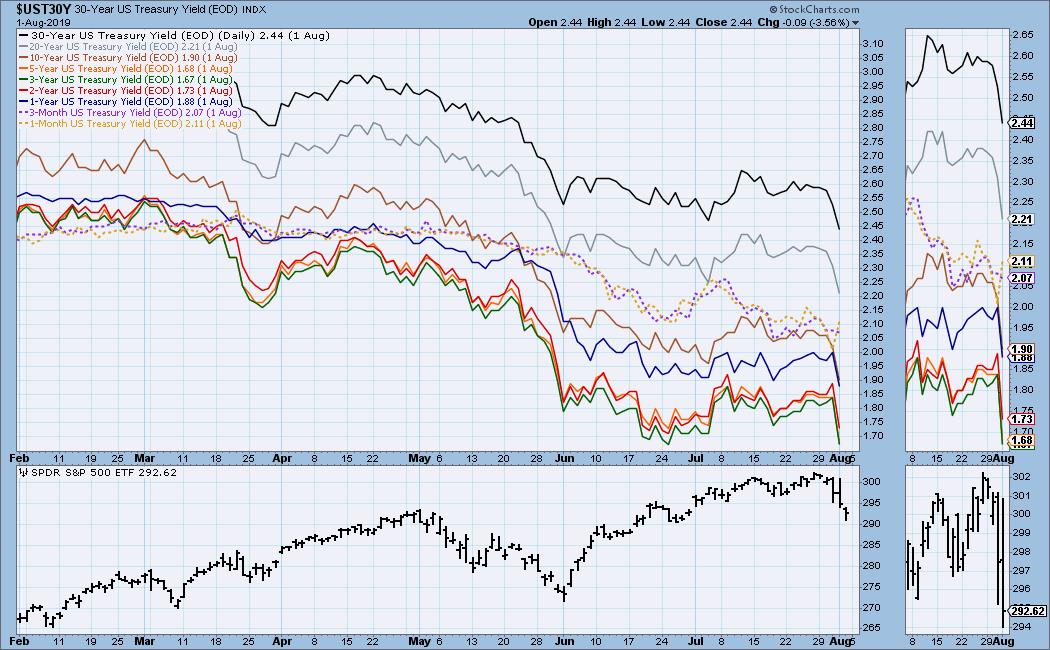
INTEREST RATES
STOCKS
IT Trend Model: BUY as of 6/11/2019
LT Trend Model: BUY as of 2/26/2019
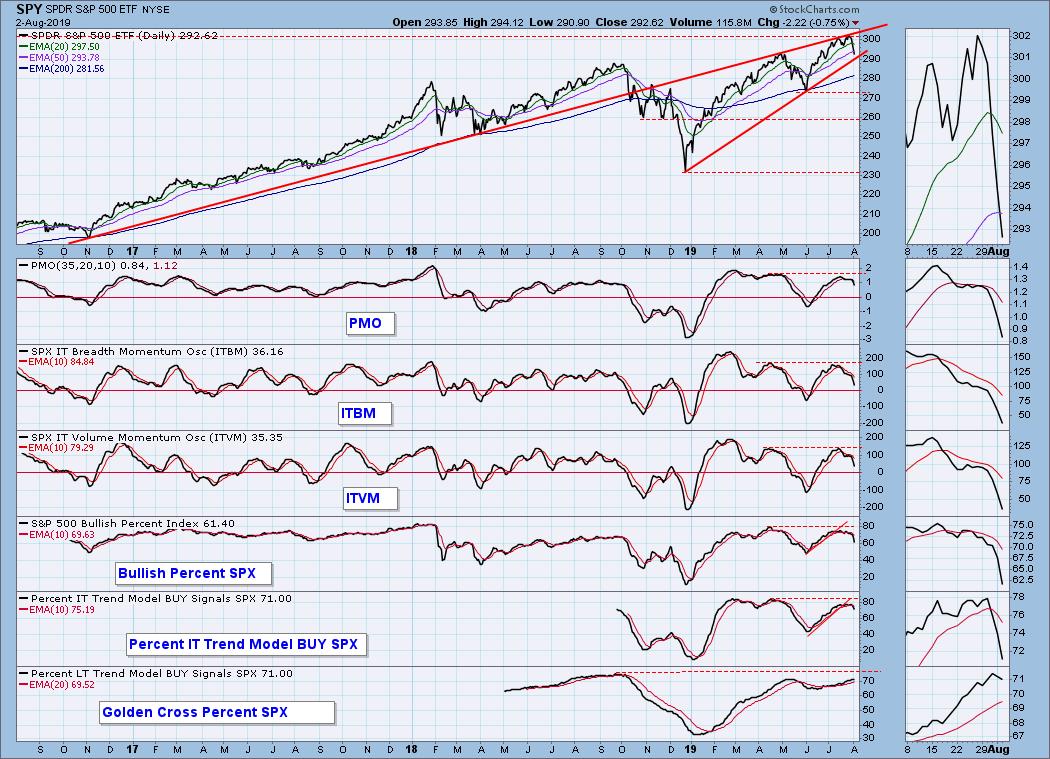
SPY Daily Chart: Note that there is a larger rising wedge on this chart.
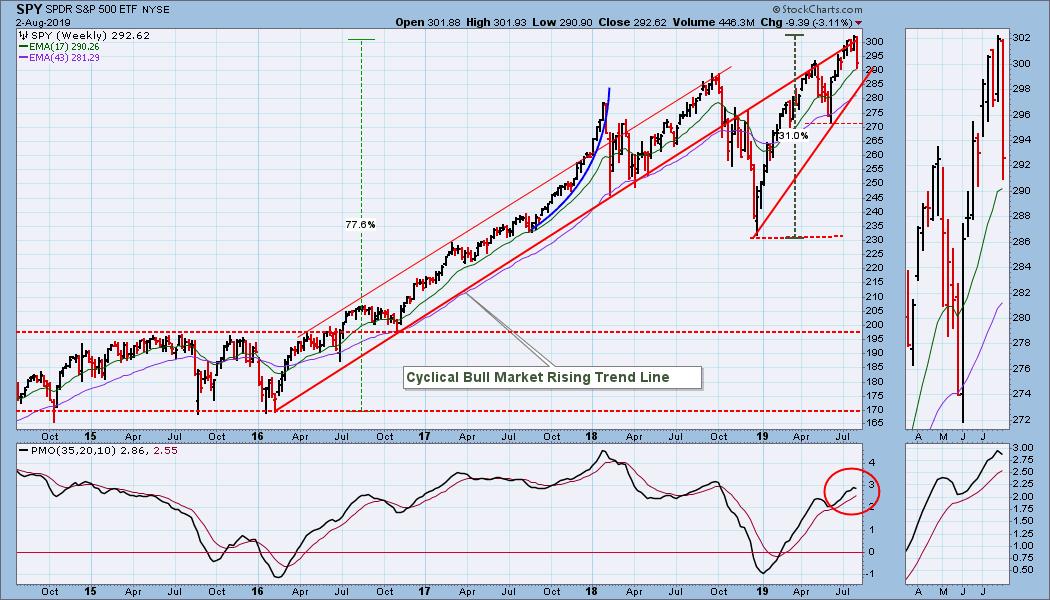
SPY Weekly Chart:
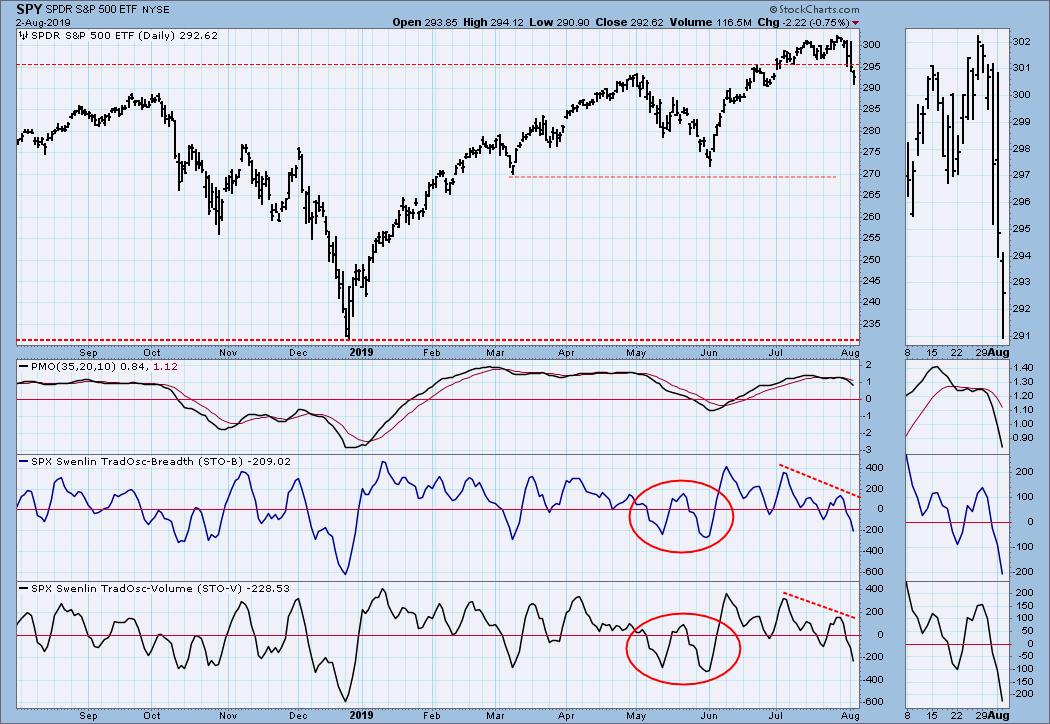
Climactic Market Indicators: There were three days with climactic downside volume, and Friday's candlestick looks like it could be a short-term bottom. I expect the current decline to resolve somewhat like the one in May, which means to look for a bounce next week, then another leg down.
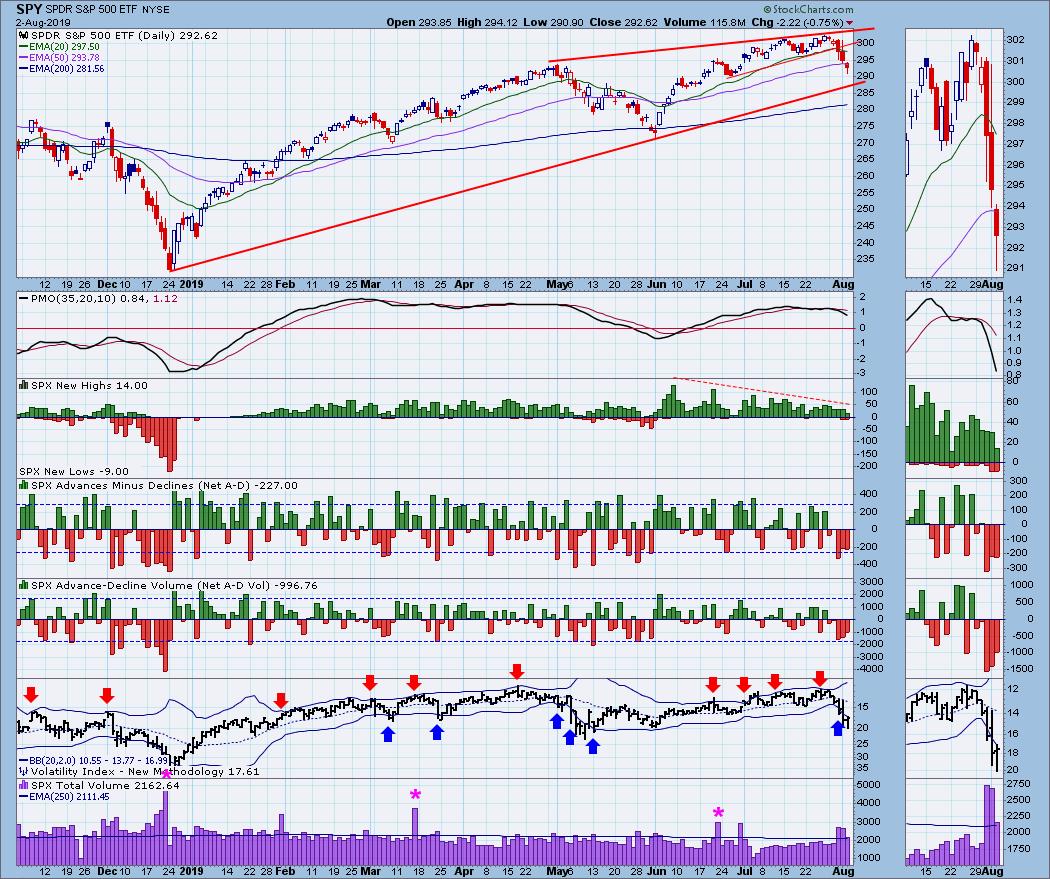
Short-Term Market Indicators: The STO-B and STO-V are oversold, and I'll be looking for something that looks like the double bottoms in May. Obviously, I can't predict what will happen, but this is an example of how the technicals can point us toward likely outcomes.
Intermediate-Term Market Indicators: The ITBM and ITVM have topped and are approximately neutral. The three signal indexes on the bottom have just topped and have a way to go before they are oversold.
CONCLUSION: There is no question that news played a big part in market action this week, but our technical indicators have been favoring a downside outcome for a while. They didn't predict it, but they were pointing in that direction. (Technical analysis is a windsock, not a crystal ball.) As I said, I am expecting a bounce next week, then another leg down.
DOLLAR (UUP)
IT Trend Model: BUY as of 7/5/2019
LT Trend Model: BUY as of 5/25/2018
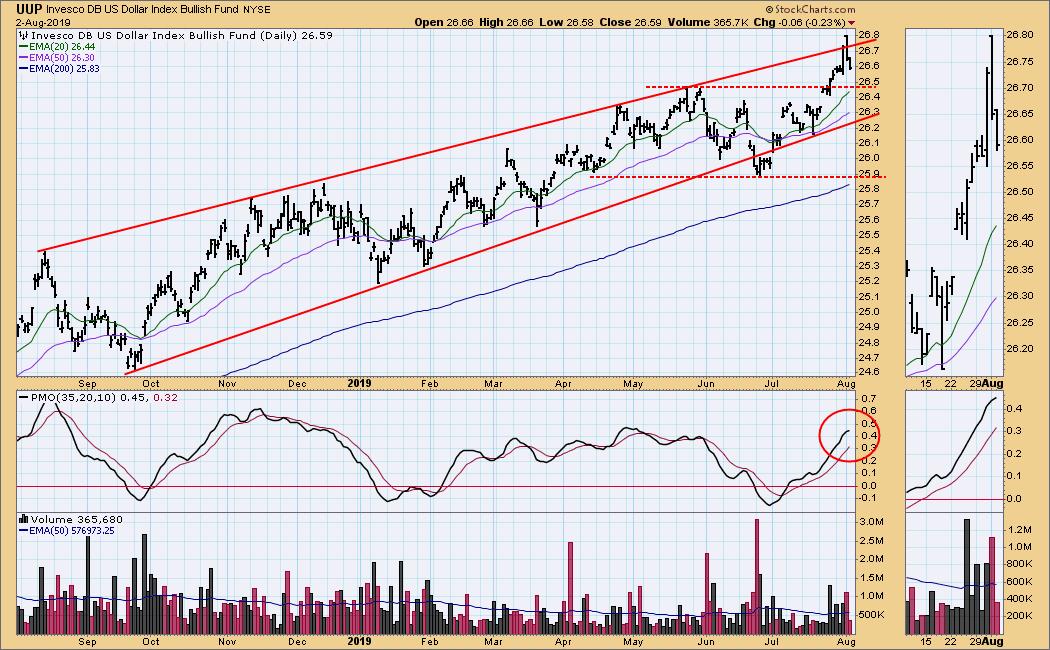
UUP Daily Chart: Price remains in a rising wedge formation. It broke out briefly on Thursday, but closed below the line. The daily PMO is overbought.
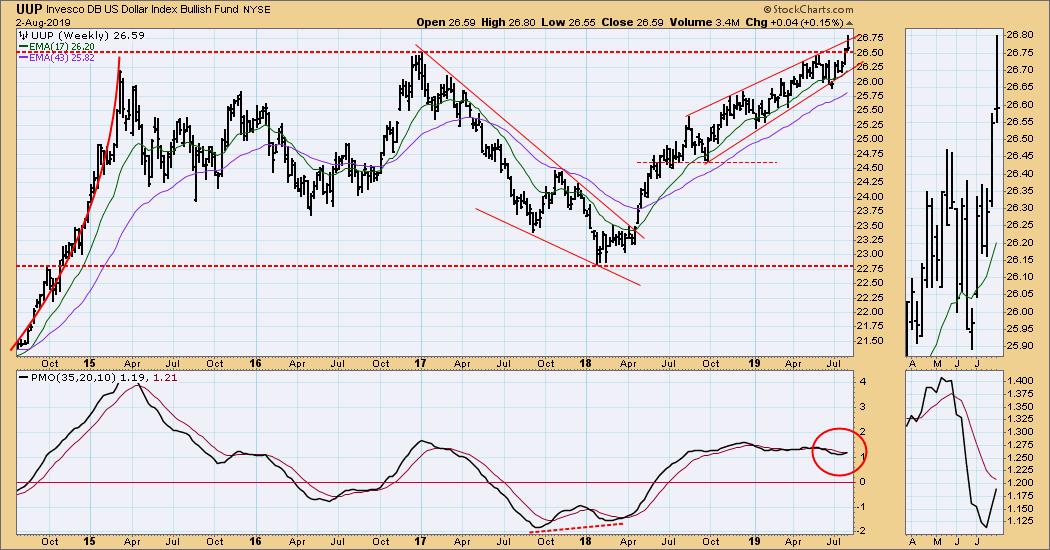
UUP Weekly Chart: The horizontal line of long-term resistance managed to stifle UUP's rally this week.
GOLD
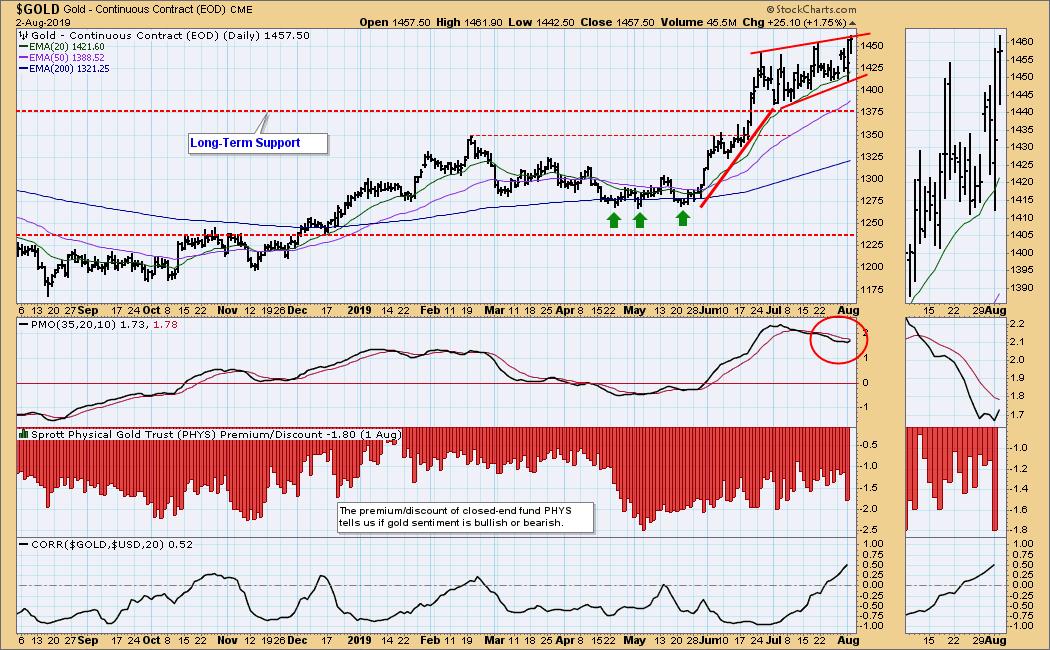
IT Trend Model: BUY as of 6/3/2019
LT Trend Model: BUY as of 1/8/2019
GOLD Daily Chart: Since its June breakout gold has been consolidating in a rising flag formation. I like the fact that it is consolidating, but a rising flag is is a weak formation.
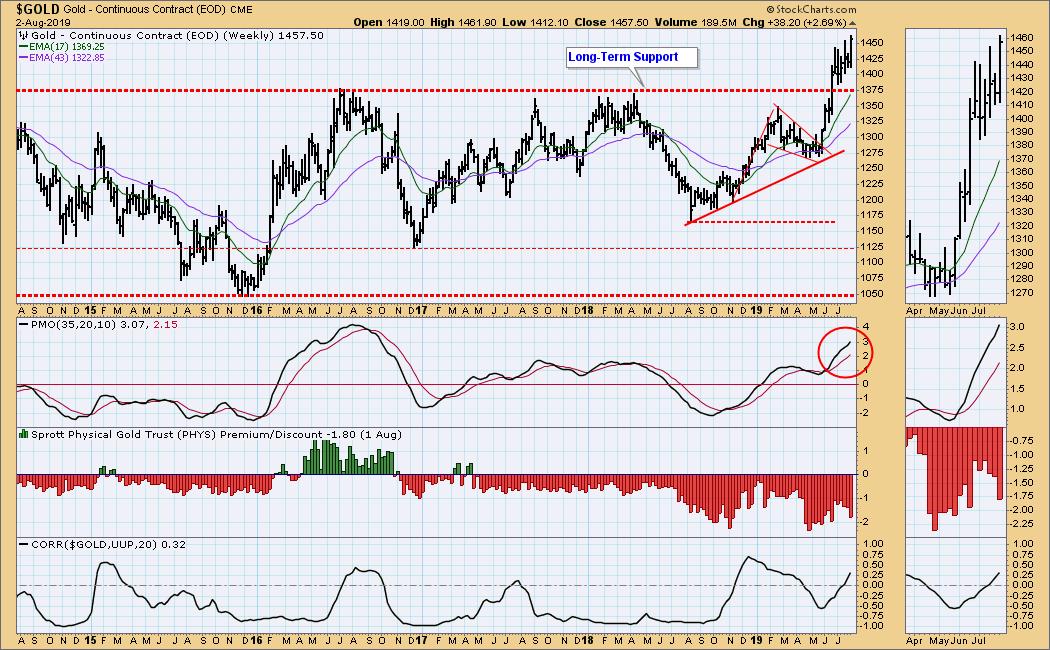
GOLD Weekly Chart: In this time frame we have a better picture of how the long-term resistance has been overcome and is now support.
CRUDE OIL (USO)
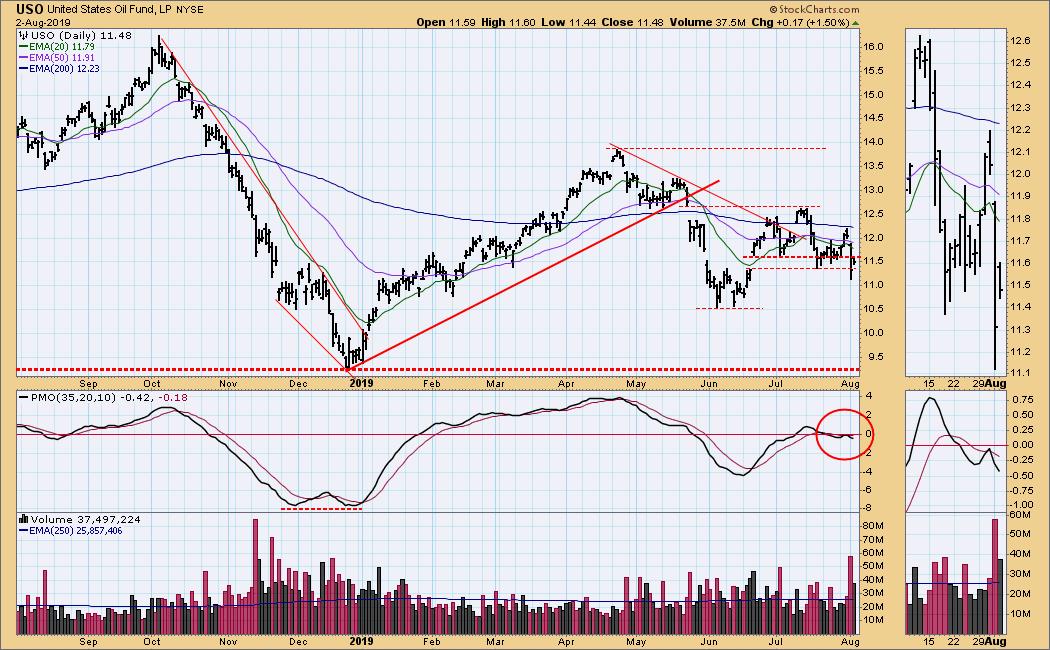
IT Trend Model: NEUTRAL as of 5/30/2019
LT Trend Model: SELL as of 6/4/2019
USO Daily Chart: The weakness in crude prices this week was in line with recent price action. The cause is supposedly expected lower demand because of the trade difficulties.
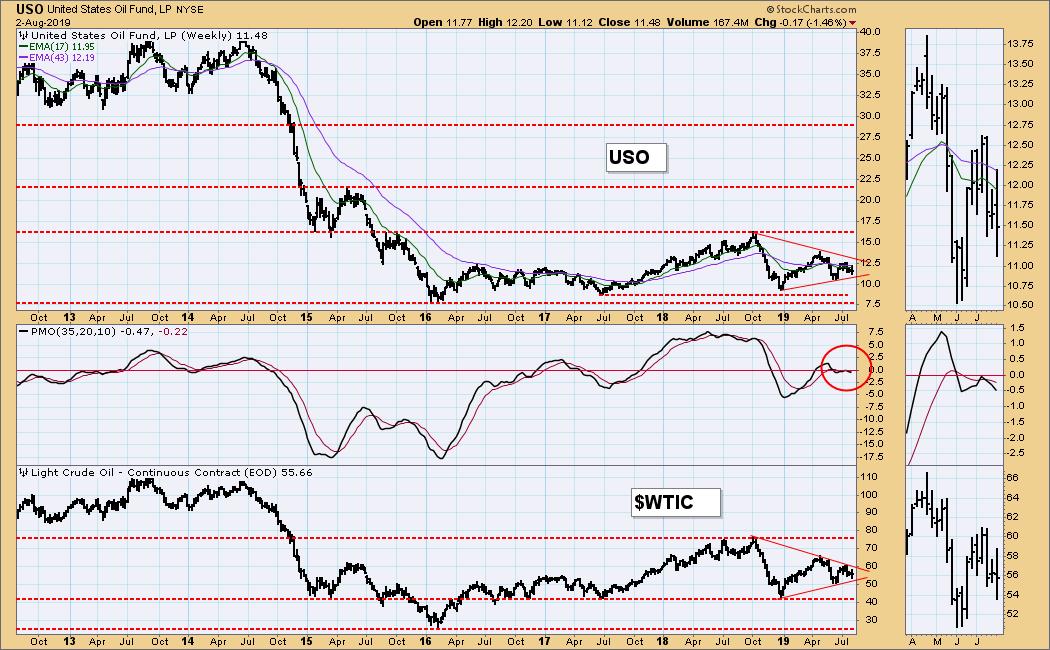
USO Weekly Chart: Prices remains in triangle formations and in the middle of trading ranges. My opinion is that the ranges will hold for some time.
BONDS (TLT)
IT Trend Model: BUY as of 12/6/2018
LT Trend Model: BUY as of 1/2/2019
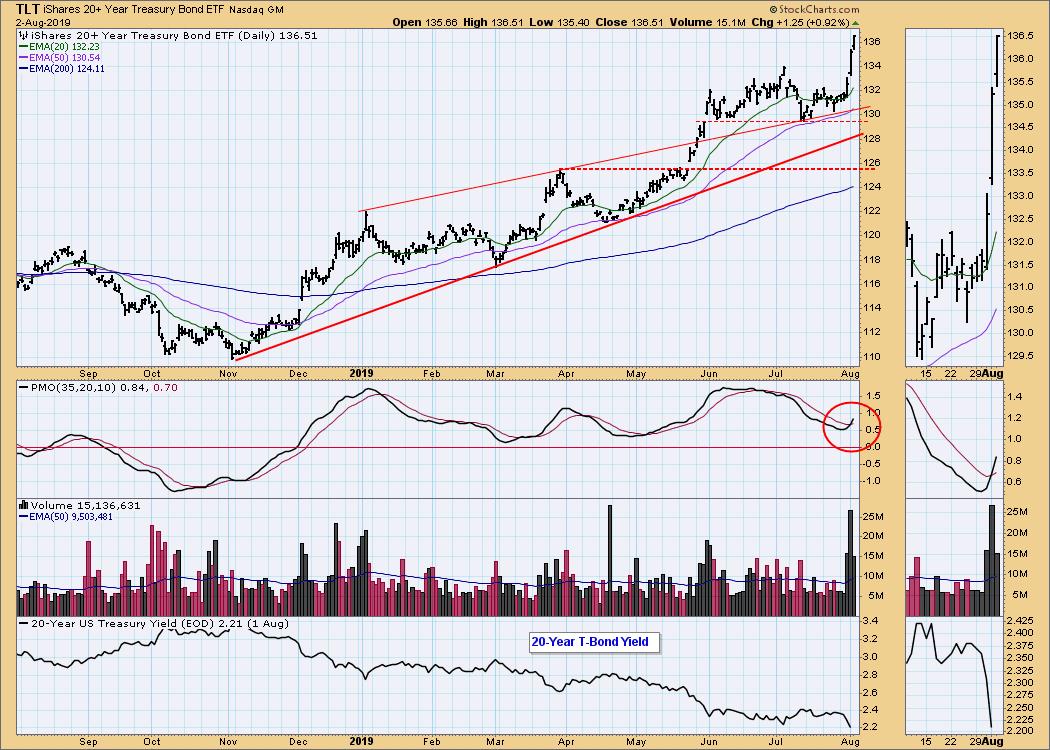
TLT Daily Chart: We have been expecting TLT to break upward, and the Fed triggered that event on Wednesday. Lower interest rates mean higher bond prices, and we can see how the Fed action initiated a rally.
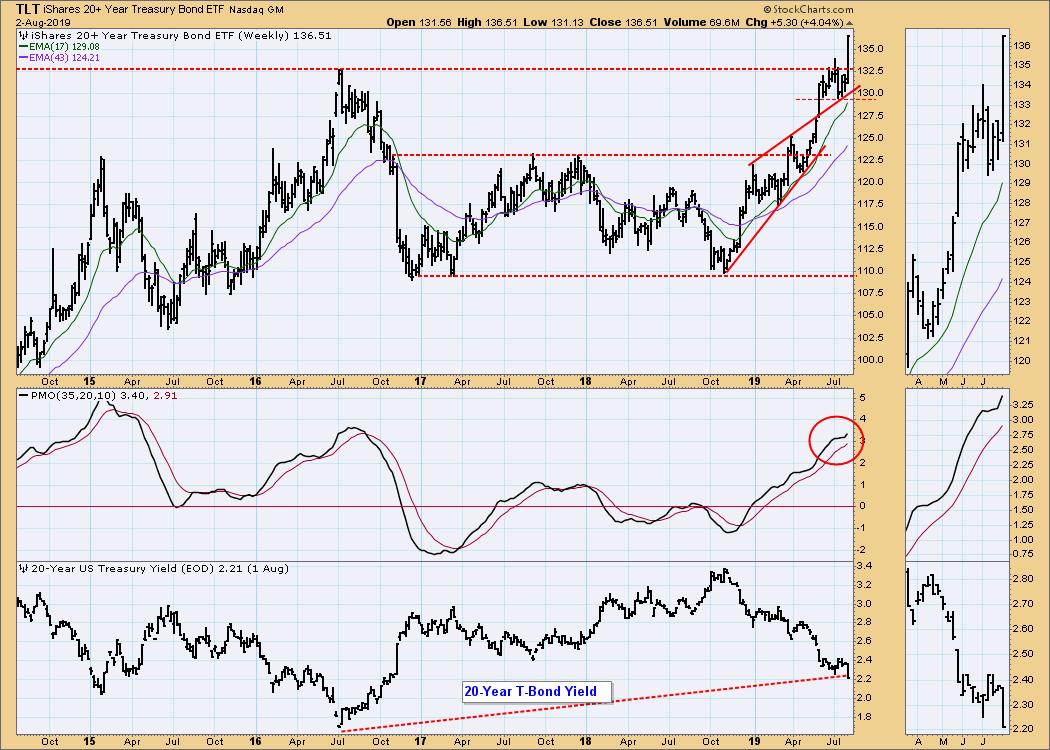
TLT Weekly Chart: The view in this time frame shows the importance of the breakout with price breaking above the long-term resistance line.
**Don't miss any of the DecisionPoint commentaries! Go to the "Notify Me" box toward the end of this blog page to be notified as soon as they are published.**
Technical Analysis is a windsock, not a crystal ball.
Happy Charting! - Carl
NOTE: The signal status reported herein is based upon mechanical trading model signals, specifically, the DecisionPoint Trend Model. They define the implied bias of the price index based upon moving average relationships, but they do not necessarily call for a specific action. They are information flags that should prompt chart review. Further, they do not call for continuous buying or selling during the life of the signal. For example, a BUY signal will probably (but not necessarily) return the best results if action is taken soon after the signal is generated. Additional opportunities for buying may be found as price zigzags higher, but the trader must look for optimum entry points. Conversely, exit points to preserve gains (or minimize losses) may be evident before the model mechanically closes the signal.
Helpful DecisionPoint Links:
DecisionPoint Shared ChartList and DecisionPoint Chart Gallery
Price Momentum Oscillator (PMO)
Swenlin Trading Oscillators (STO-B and STO-V)


