
Today, I ran the WealthWise Women "Pink Line" scan, which uses the 50-SMA and a Chandelier Exit to determine entries and exits. Many times, these stocks will have "popped" on the day I get the results for this scan, so these all did have big moves today and may require a pullback for entry depending on your analysis process.
Welcome to the "DecisionPoint Daily Diamonds", a newsletter in which we highlight five "diamonds in the rough," taken from the results of one of my DecisionPoint scans. Remember, these are not recommendations to buy or sell, but simply stocks that I found interesting. The objective is to save you the work of the initial, tedious culling process, but you need to apply your own analysis and to see if these stocks pique your interest. There are no guaranteed winners here.
Current Market Conditions:
Based on current DecisionPoint analysis, the market is in an uptrend going by the DP Trend Models. We are flirting with all-time highs now (in fact, the SPY logged an all-time intraday high today). The PMO is rising on a BUY signal and is not overbought. Conditions are bullish.
Here are the current percentages on the Silver and Golden Cross Indexes, which are continuing to rise nicely:
Silver Cross: 59.2% on ITTM Buy Signals
Golden Cross: 63% on LTTM Buy Signals
Of the 20 results I got today from the Pink Line scan, I narrowed it down to these five:
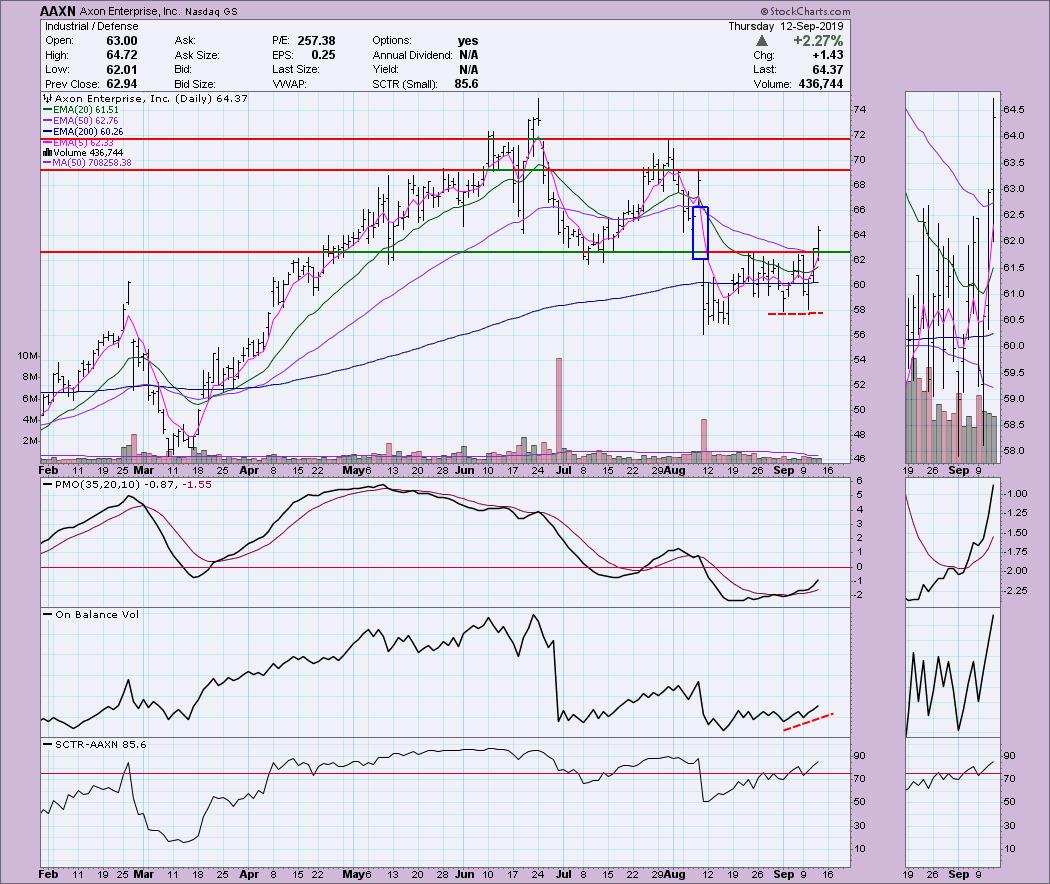
AAXN popped up over 2.27% today with a beautiful breakout and is now beginning to close the gap from earlier in August. Price has struggled against resistance since mid-August. I annotated a gap in blue. Price is on its way to close that gap. Typically, you will see price continue higher after filling a gap, so while this did have a spectacular move to the upside, it still has plenty of ground (gap) to cover. I've annotated two areas of overhead resistance to watch closely.
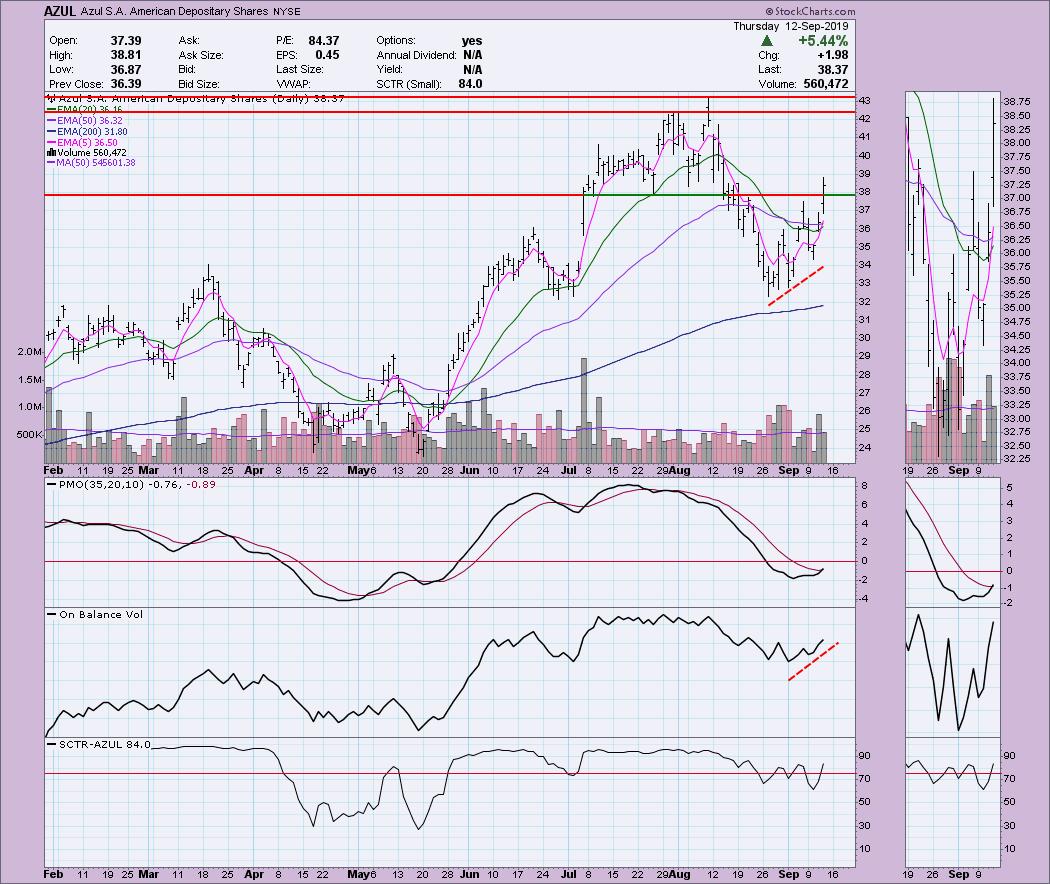
AZUL is an unusual pick given its meteoric rise today, but this looks like the precursor to more upside. The PMO is on a BUY signal. The 20-EMA is working on crossing the 50-EMA for a IT Trend Model BUY signal. Today, the 5-EMA crossed above the 20-EMA, giving us a ST Trend Model BUY signal.
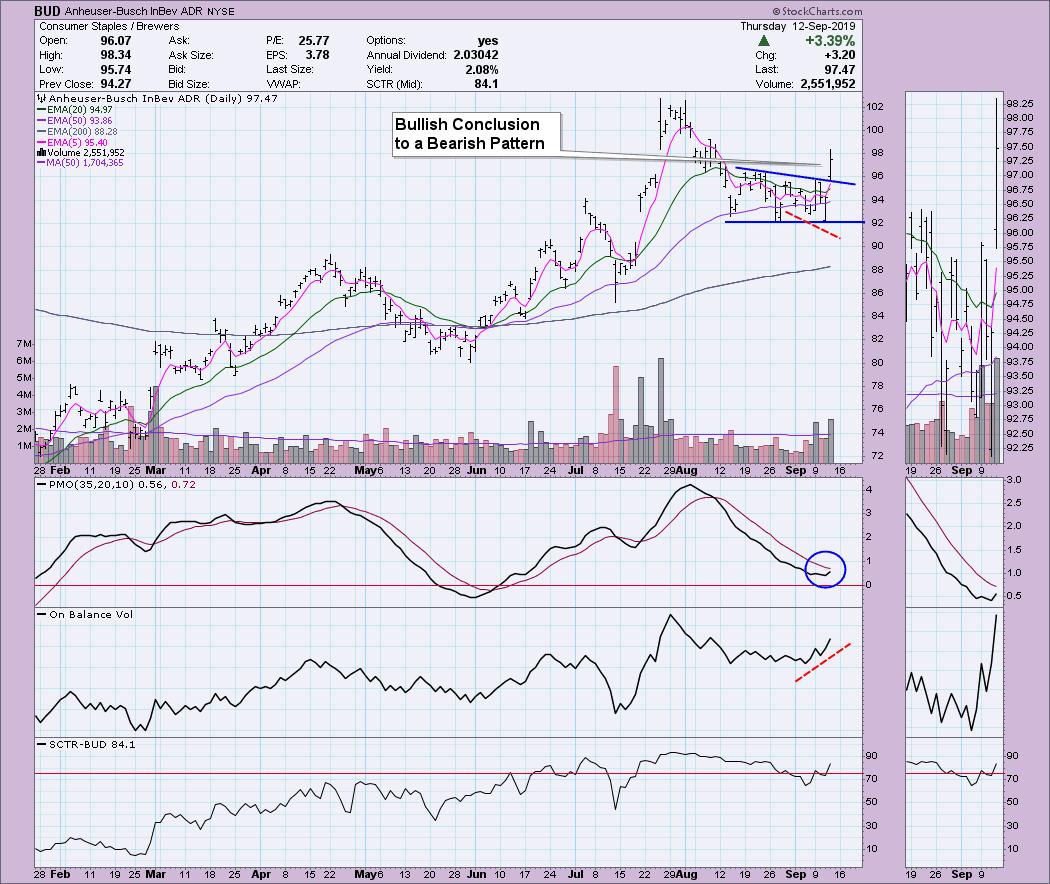
This BUD might be for you. I always like to see a bullish conclusion to a bearish chart pattern; in this case, it is a descending triangle. The break is supposed to happen below the support line. The 5-EMA crossed above the 20-EMA; there is upside potential to the highs back in late July/early August. The best part of this chart to me... the beautiful positive divergence between the OBV and price lows. The SCTR is back above the 75 line as well, which tells us it is relatively strong amongst its peers.
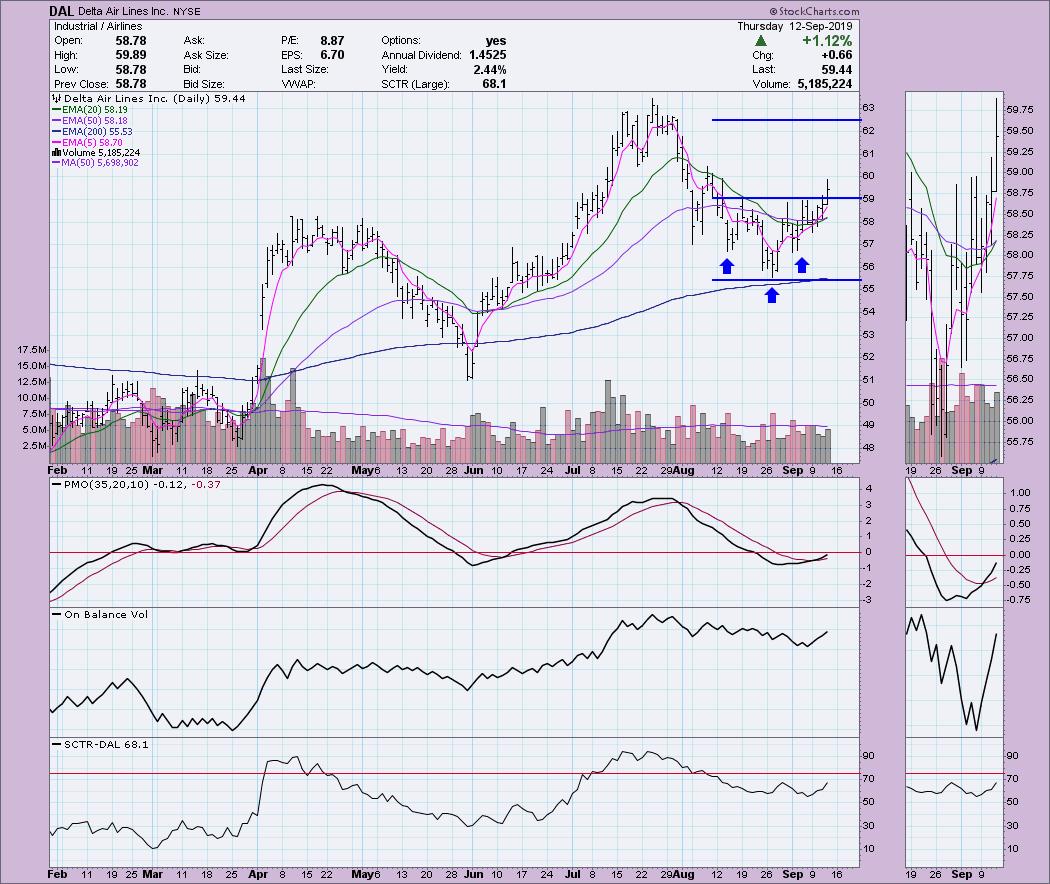
The DAL chart shows a reverse head-and-shoulders, which executed today with that breakout above the neckline. Upside potential looks great as overhead resistance is all the way up at $63. Interestingly, that level matches almost perfectly with the minimum upside target of the head-and-shoulders pattern. The length of the head to the neckline is the height of the pattern; it is added to the neckline to get the minimum upside target of the pattern.
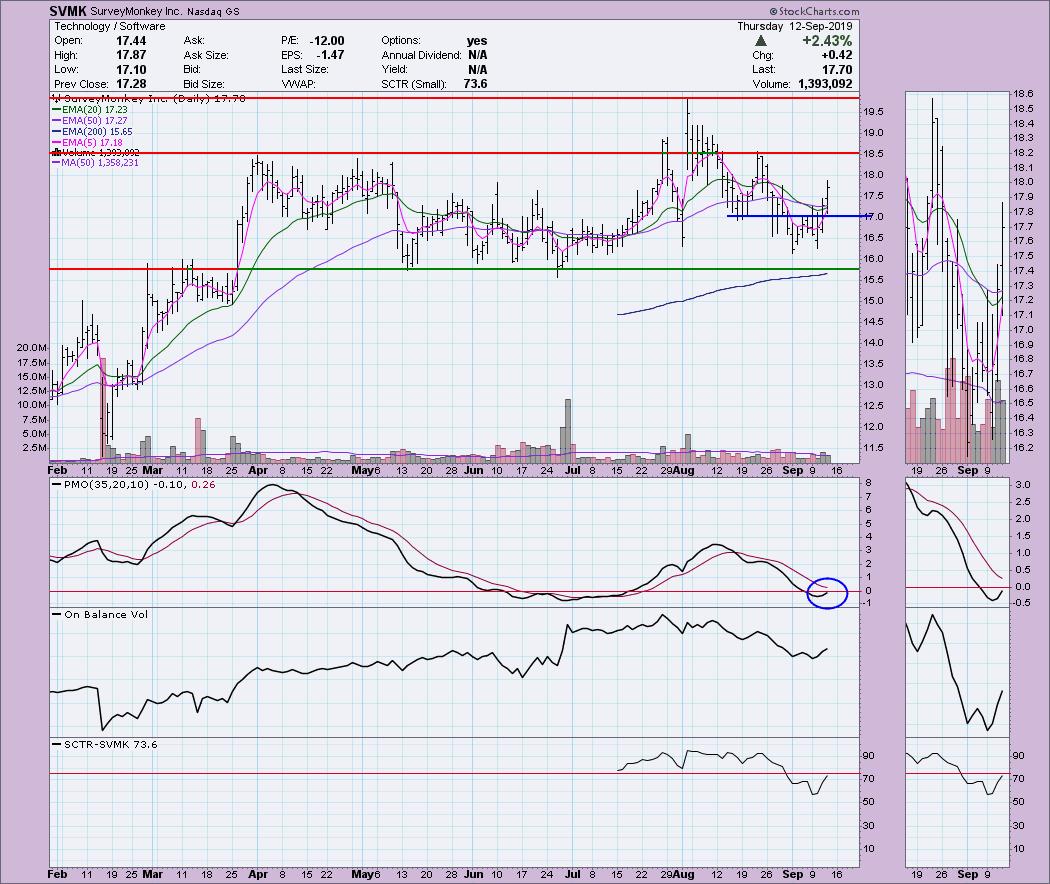
There have certainly been better performers in the software space than SVMK, but the 20-EMA is about to cross above the 50-EMA for an IT Trend Model BUY signal. The PMO has turned up and is nearly above the zero line. My caution on this one is that it is still near the top of the trading zone it has been in since March and could make a swing back down toward that support level. Currently, the breakout above short-term resistance at $17 and the breakout from the declining trend is what prompted me to add this one as a "diamond."
Full Disclosure: I do not own any of the stocks above and I am not planning on purchasing any at this time. I'm currently about 60% in cash, so I will be considering new longs depending on market trend and condition.
Watch the latest episode of DecisionPoint with Carl & Erin Swenlin LIVE on Mondays 5:00p EST or on the StockCharts TV YouTube channel here!
Technical Analysis is a windsock, not a crystal ball.
Happy Charting!
- Erin
erinh@stockcharts.com
NOTE: The stocks reported herein are from mechanical trading model scans that are based upon moving average relationships, momentum and volume. DecisionPoint analysis is then applied to get five selections from the scans. The selections given should prompt readers to do a chart review using their own analysis process. This letter is not a call for a specific action to buy, sell or short any of the stocks provided. There are NO sure things or guaranteed returns on the daily selection of "diamonds in the rough".
Helpful DecisionPoint Links:
DecisionPoint Shared ChartList and DecisionPoint Chart Gallery
Price Momentum Oscillator (PMO)
Swenlin Trading Oscillators (STO-B and STO-V)
**Don't miss DecisionPoint Commentary! Add your email below to be notified of new updates"**


