On Thursday SPY hit an all-time intraday high, but it was not confirmed by some of our internal indicators. In particular I am referring to the *Golden Cross and **Silver Cross Indexes, both of which are well below their levels when the market made its last all-time high in July. We can make allowances for the Golden Cross Index, because it is slow to respond to changes in the market trend; however, the Silver Cross Index responds fairly quickly, and should be a lot closer to confirming this week's market high than it is.
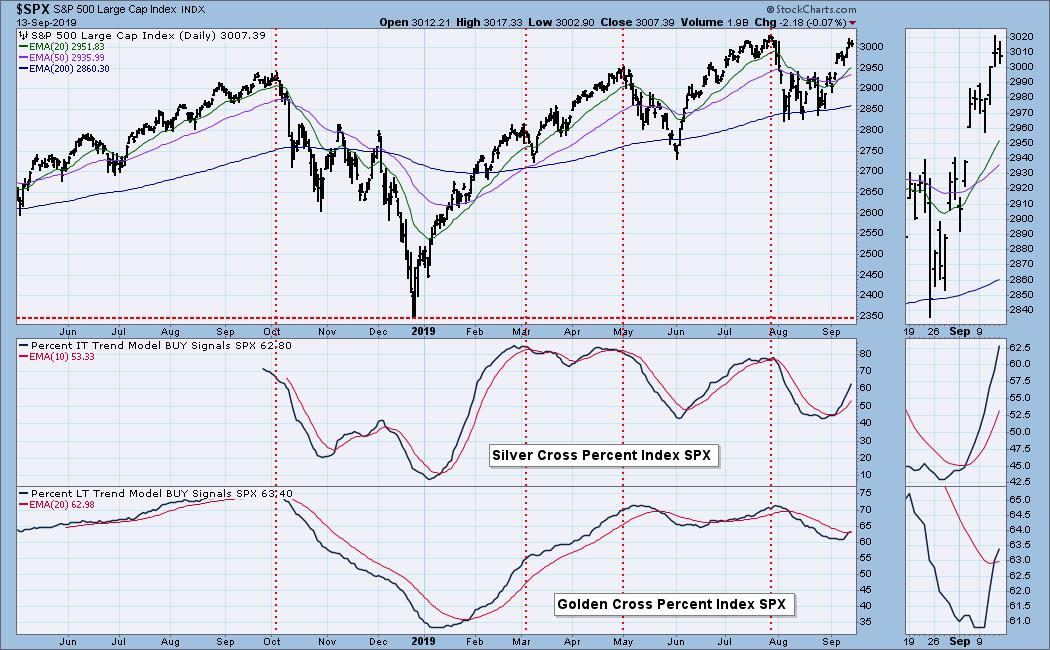
*Golden Cross Index SPX: The percentage of S&P 500 component stocks whose 50EMA has crossed above the 200EMA.
** Silver Cross Index SPX: The percentage of S&P 500 component stocks whose 20EMA has crossed above the 50EMA.
The DecisionPoint Weekly Wrap presents an end-of-week assessment of the trend and condition of the stock market (S&P 500), the U.S. Dollar, Gold, Crude Oil, and Bonds.
Watch the latest episode of DecisionPoint on StockCharts TV's YouTube channel here!
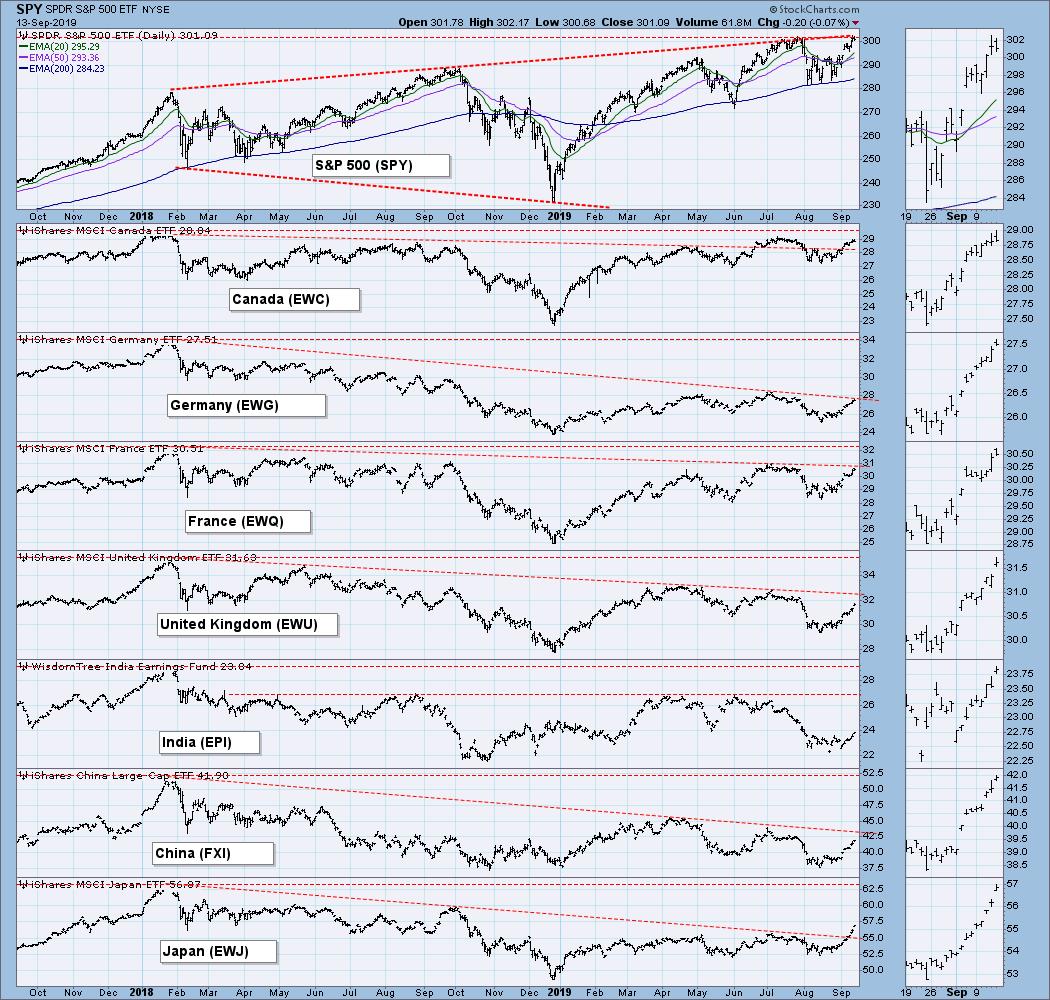
GLOBAL MARKETS
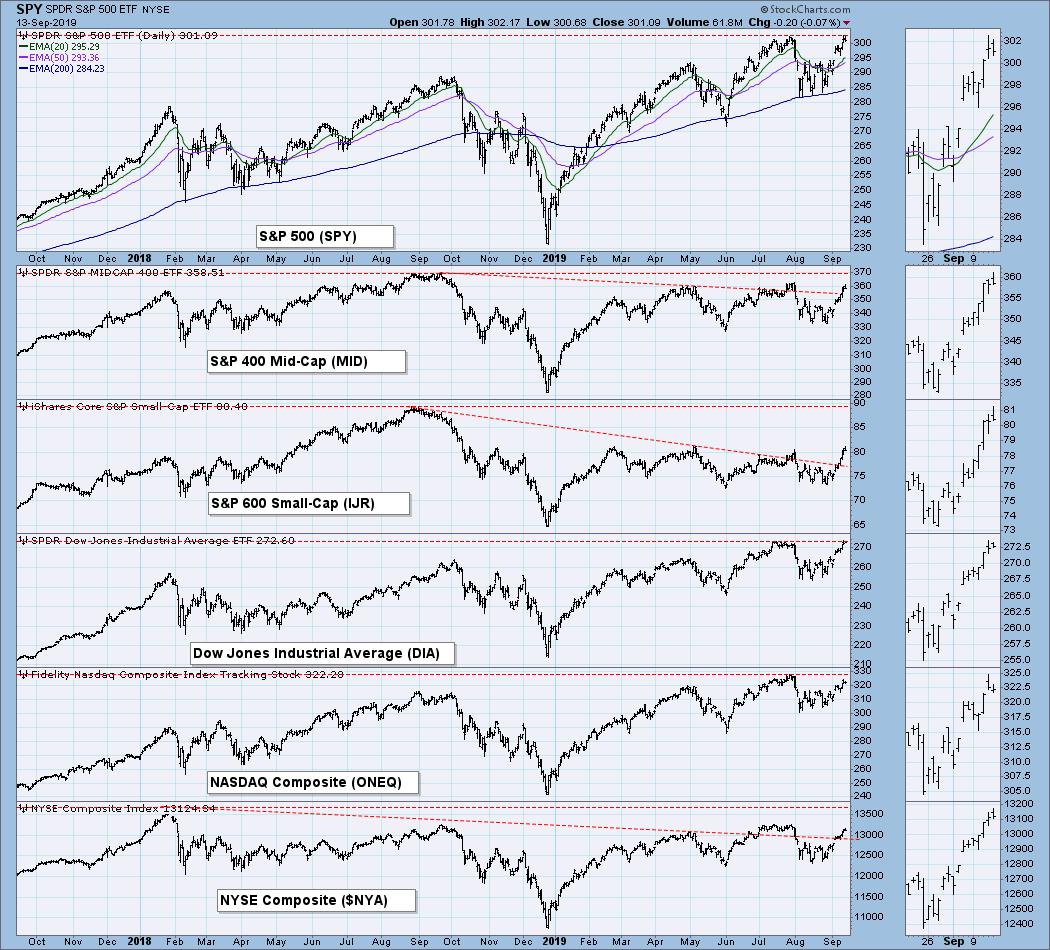
These charts and the Broad Market Indexes charts below are included in this report because I think, for background, we need to be generally aware of what these indexes are doing, but on a deeper level, I don't really care enough to get into a tedious analysis of them, unless something catches my eye. Look at the charts, get a general impression, and move on. A picture is worth a thousand words. Look at the picture and think.
BROAD MARKET INDEXES
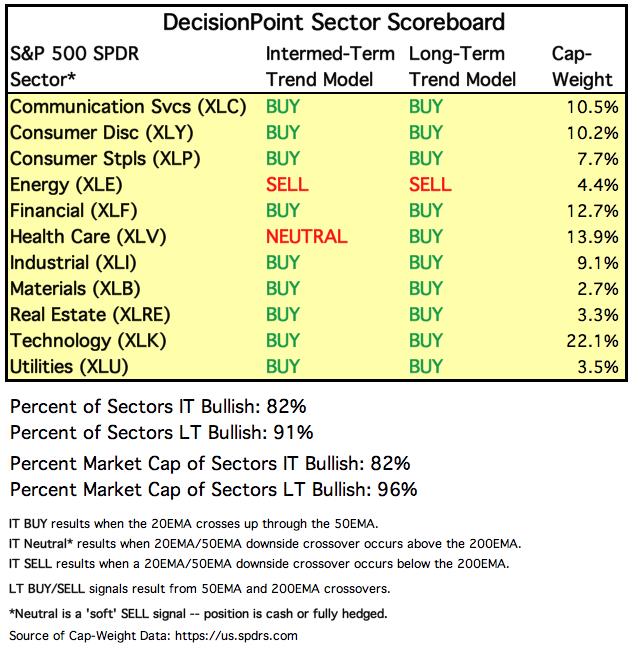
SECTORS
Each S&P 500 Index component stock is assigned to one, and only one, of 11 major sectors. This is a snapshot of the Intermediate-Term and Long-Term Trend Model signal status for those sectors.
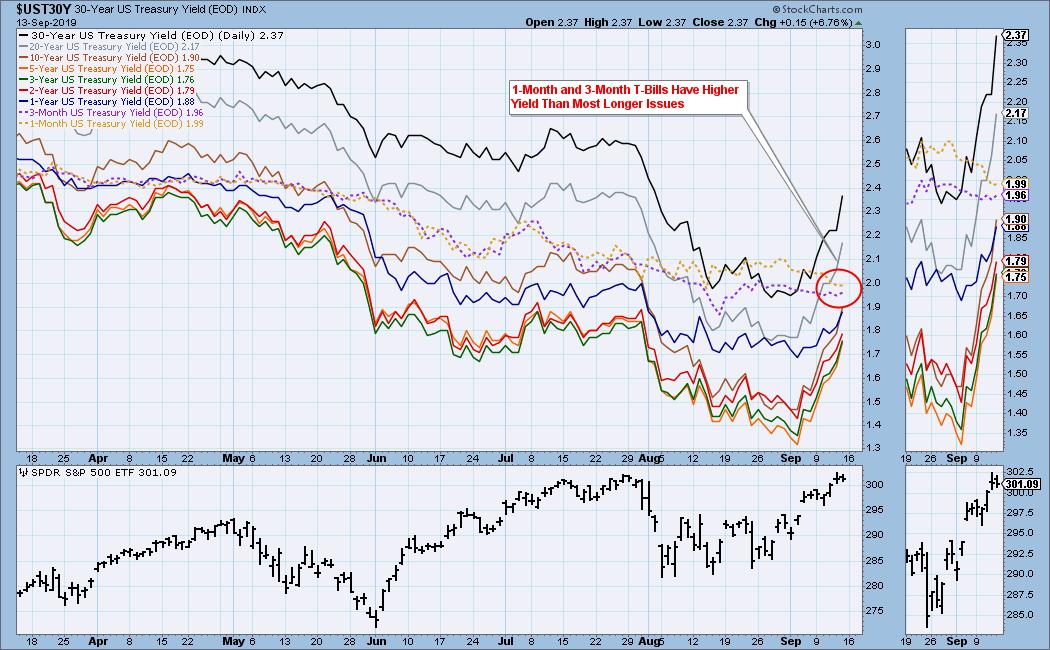
INTEREST RATES
Because some interest rates are currently inverted, I will be including a chart so we can monitor the situation. In normal circumstances the longer money is borrowed the higher the interest rate that must be paid. When rates are inverted, the reverse is true. It is generally believed that rate inversions result from "a flight to safety."
STOCKS
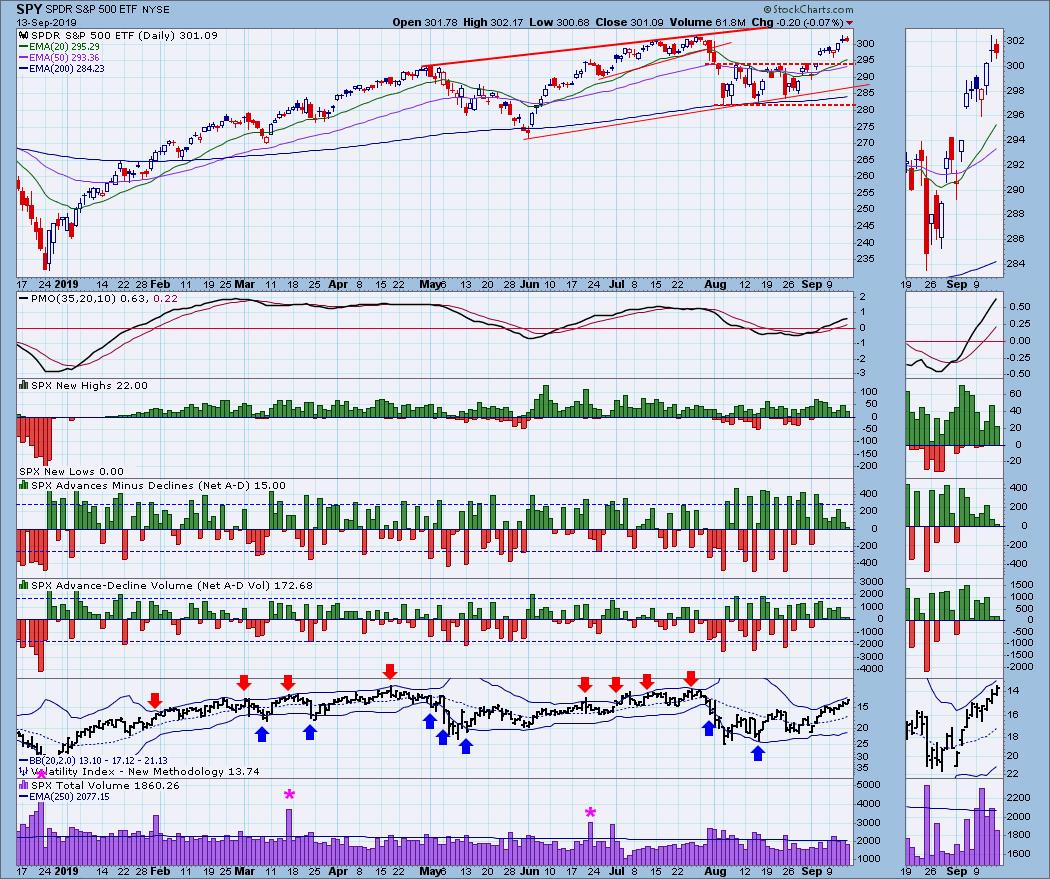
IT Trend Model: BUY as of 9/6/2019
LT Trend Model: BUY as of 2/26/2019
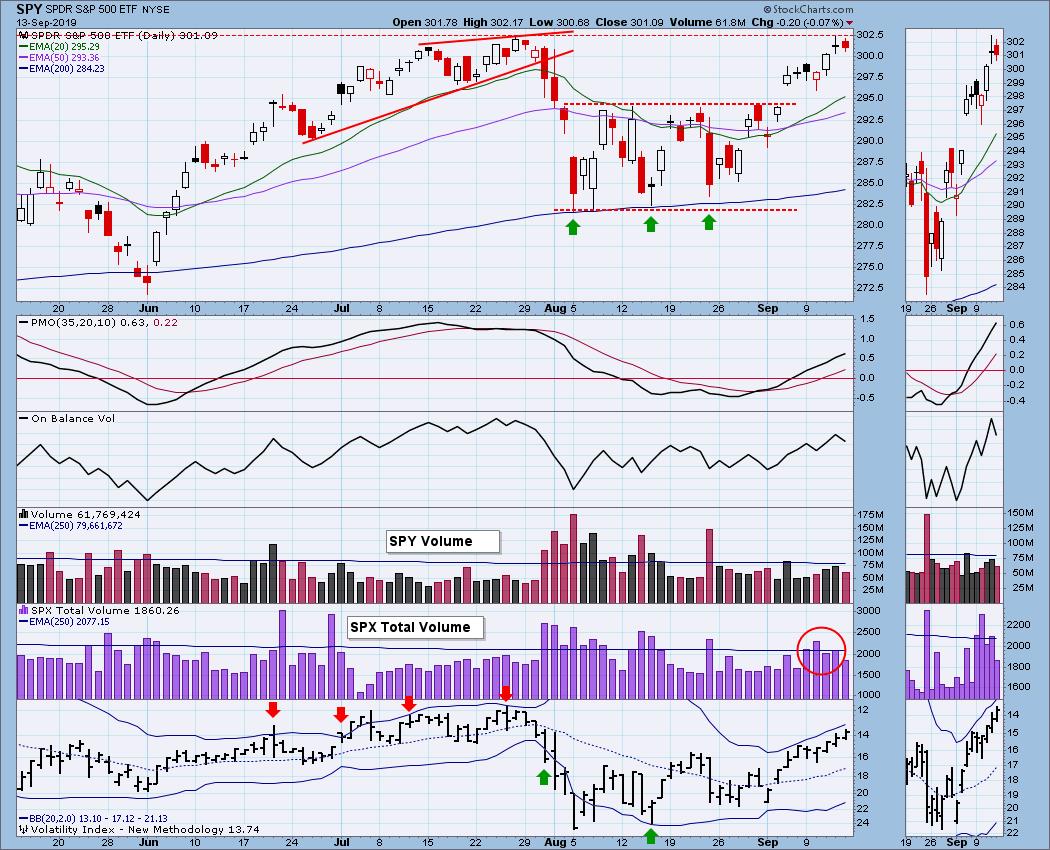
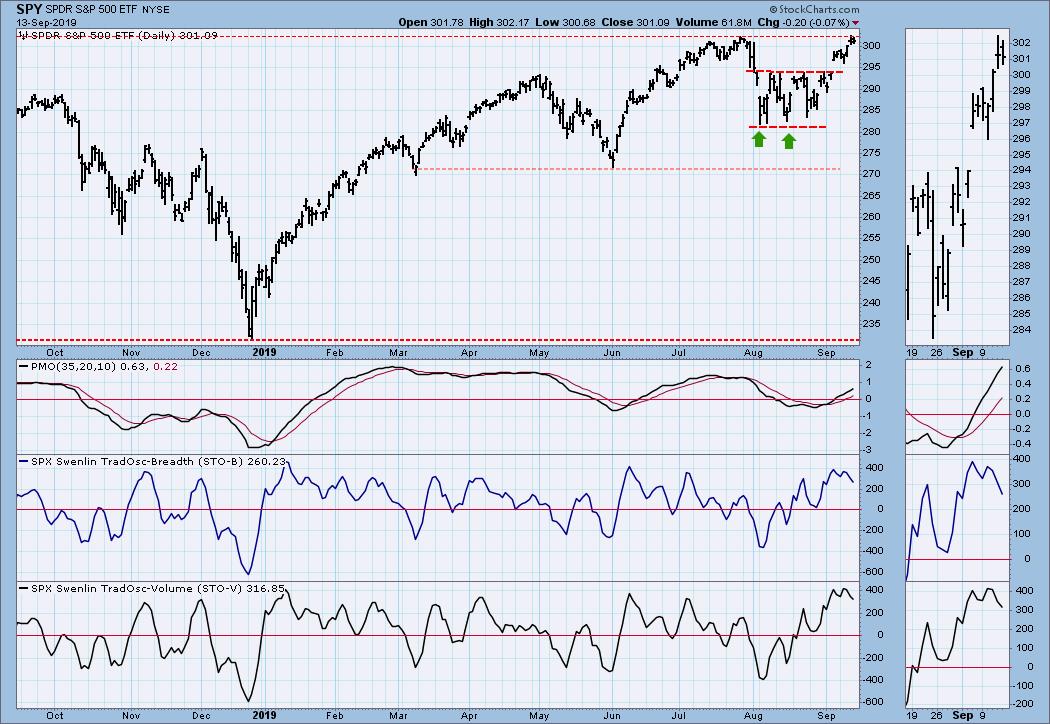
SPY Daily Chart: I note that SPX Total Volume was heavier than usual on this week's advance. No way to know for sure, but I'm thinking that may represent distribution.
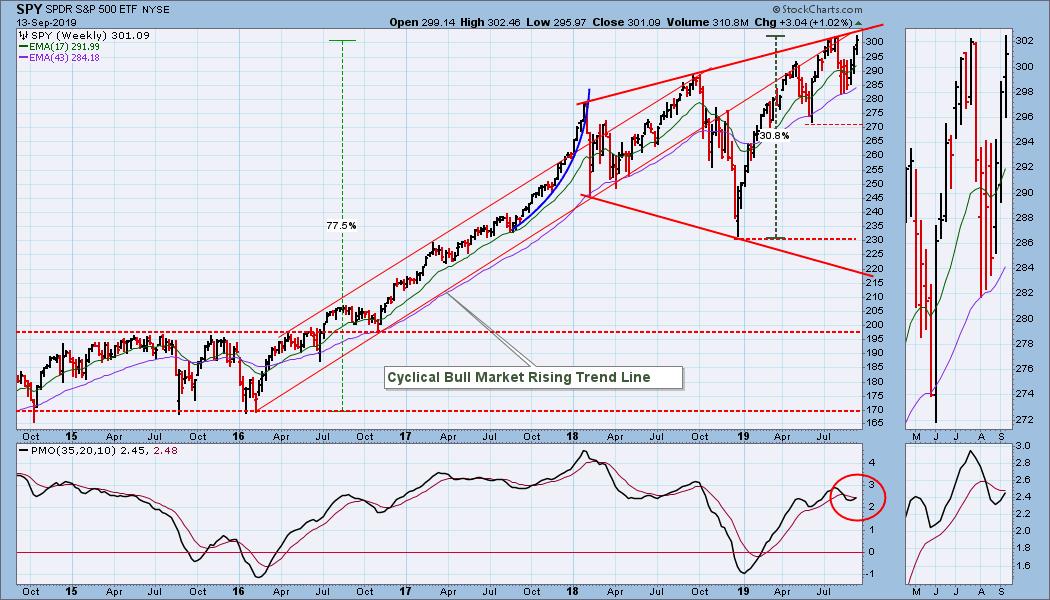
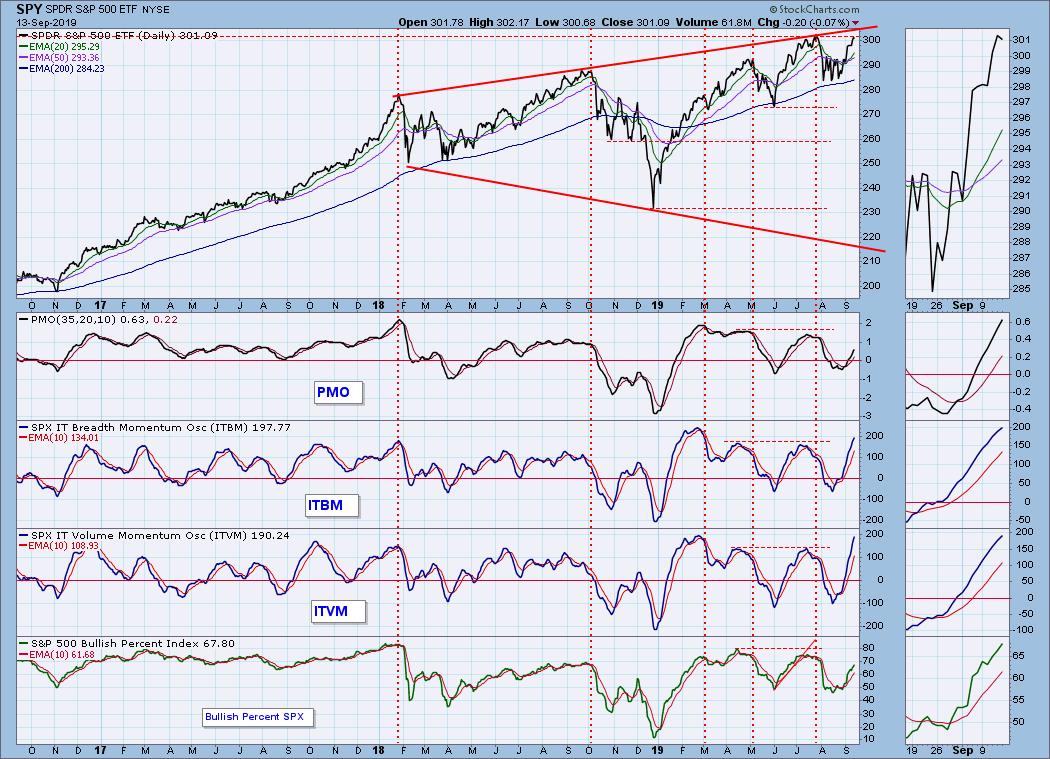
SPY Weekly Chart: The broadening top formation is bearish, and the rising tops line may be the next point of resistance.
Climactic Market Indicators: Other than SPX Total Volume, there were no climactic readings this week.
Short-Term Market Indicators: STO-B and STO-V tops don't always bring price tops, but the fact that price is pushing records could provide more leverage in turning price down.
Intermediate-Term Market Indicators: The ITBM and ITVM are both quite overbought. Similar readings in May and July preceded some pretty good selling, but you can see on the chart that overbought doesn't always result in price decline.
CONCLUSION: The market is overbought in all time frames, and it is firmly up against overhead resistance, so we should be alert for possible selling next week. On Wednesday the FOMC announcement regarding interest rates is key to the outcome. My guess is that no cut or a cut of only one-quarter percent will result in a selloff. A cut of one-half percent will probably result in a rally. Market technicals certainly favor some selling.
Next week is an options expiration week. Since September is an end-of-quarter month, next Friday's volume should be very high.
DOLLAR (UUP)
IT Trend Model: BUY as of 7/5/2019
LT Trend Model: BUY as of 5/25/2018
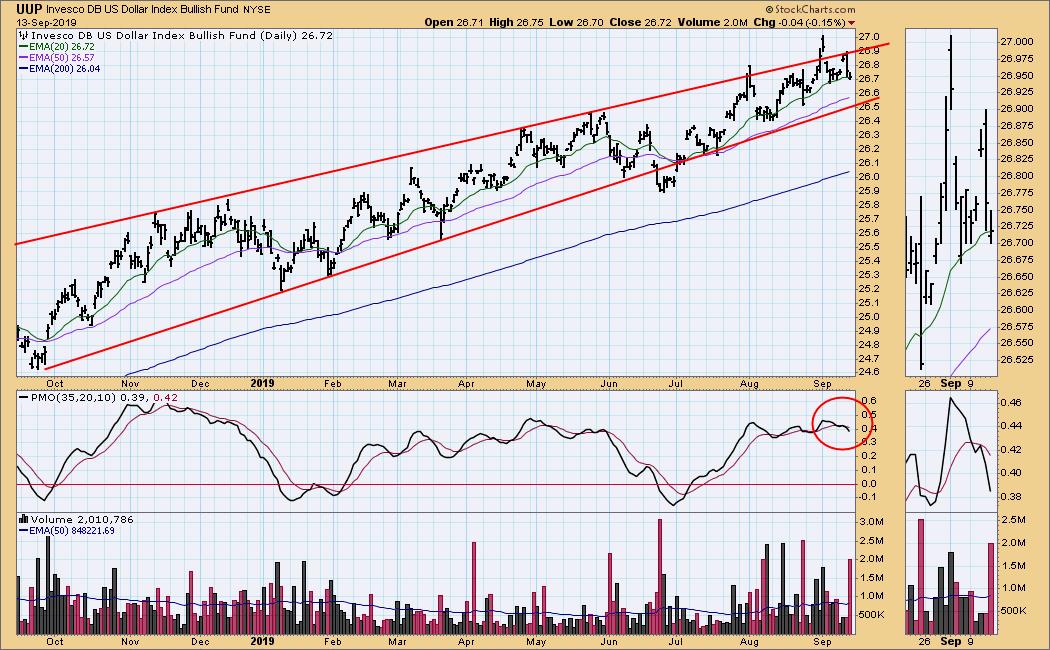
UUP Daily Chart: Neutral to positive. Price is still contained by the rising wedge. For the third time in six weeks the PMO is below the signal line and falling.
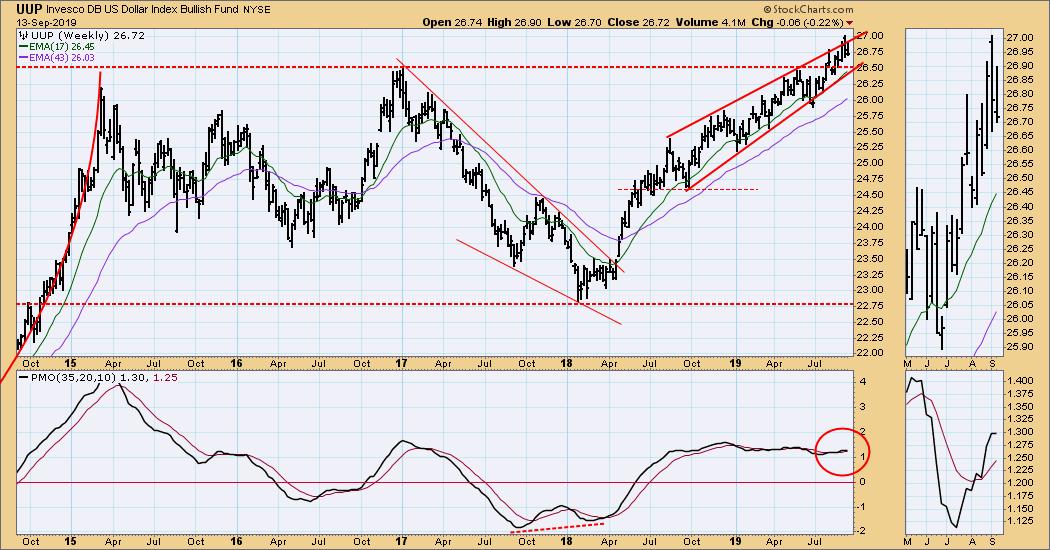
UUP Weekly Chart: The break above long-term resistance still holds, but it is only +2%. Not a decisive breakout yet.
GOLD
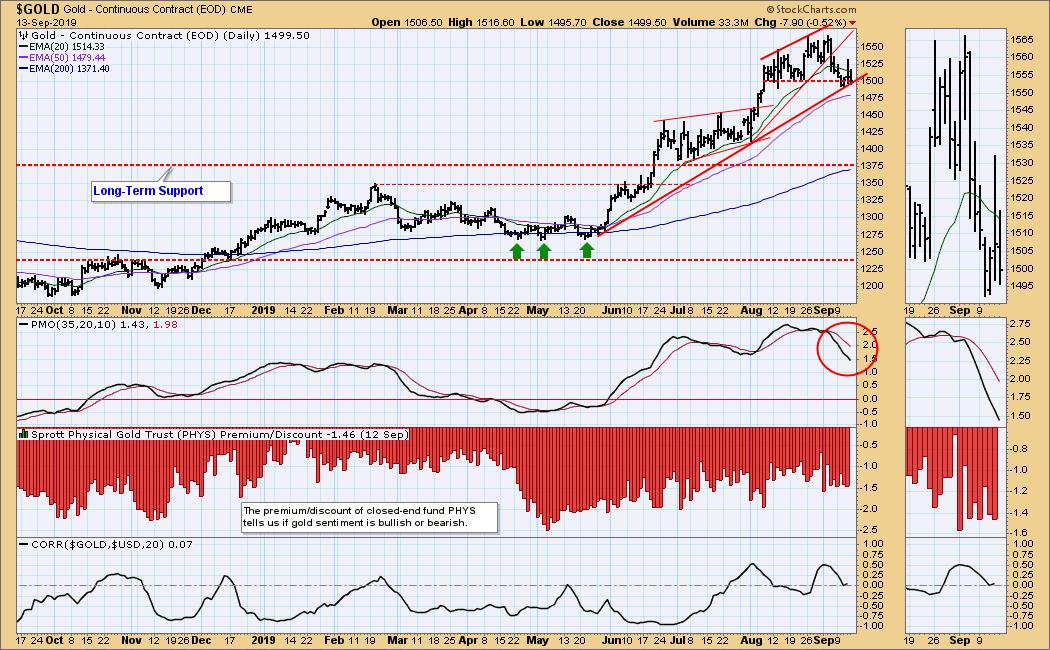
IT Trend Model: BUY as of 6/3/2019
LT Trend Model: BUY as of 1/8/2019
GOLD Daily Chart: Gold broke down from a rising wedge, as expected, and it has found support on the rising trend line. The daily PMO in positive territory, but it is currently falling.
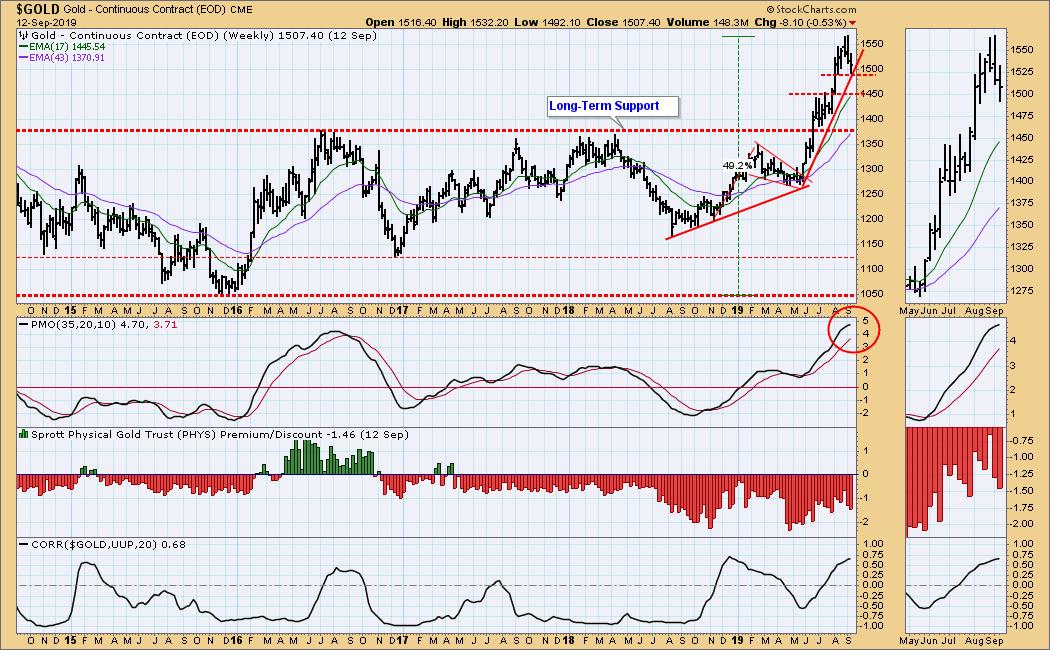
GOLD Weekly Chart: In this time frame, horizontal support looks good at about 1490 and 1450. The most critical support is at 1375.
CRUDE OIL (USO)
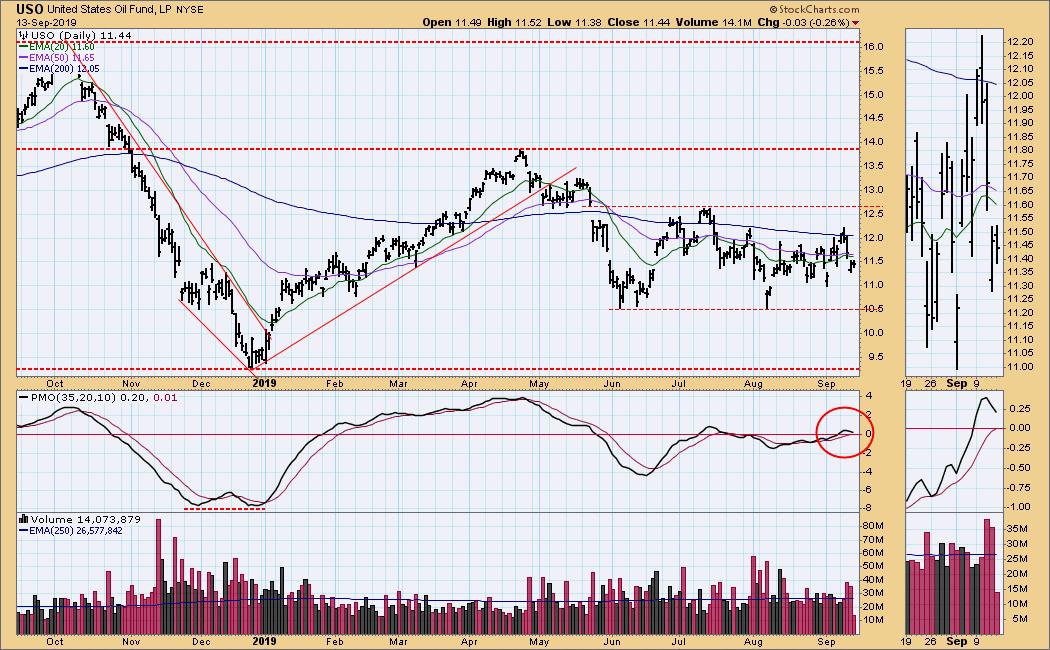
IT Trend Model: NEUTRAL as of 5/30/2019
LT Trend Model: SELL as of 6/4/2019
USO Daily Chart: We continue to see dramatic moves in each direction, but the range is pretty narrow.
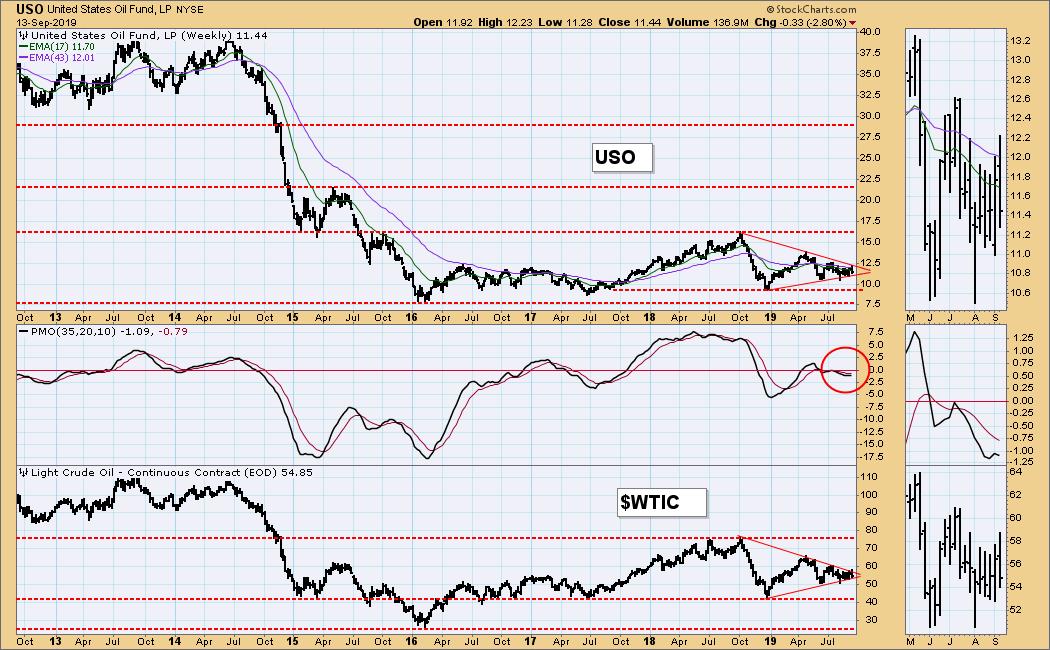
USO Weekly Chart: Price is being squeezed into the apex of a triangle. The triangle will have to resolve soon because price will have nowhere to go but out of the triangle. No clues as to whether price will start moving up or down. It could continue sideways.
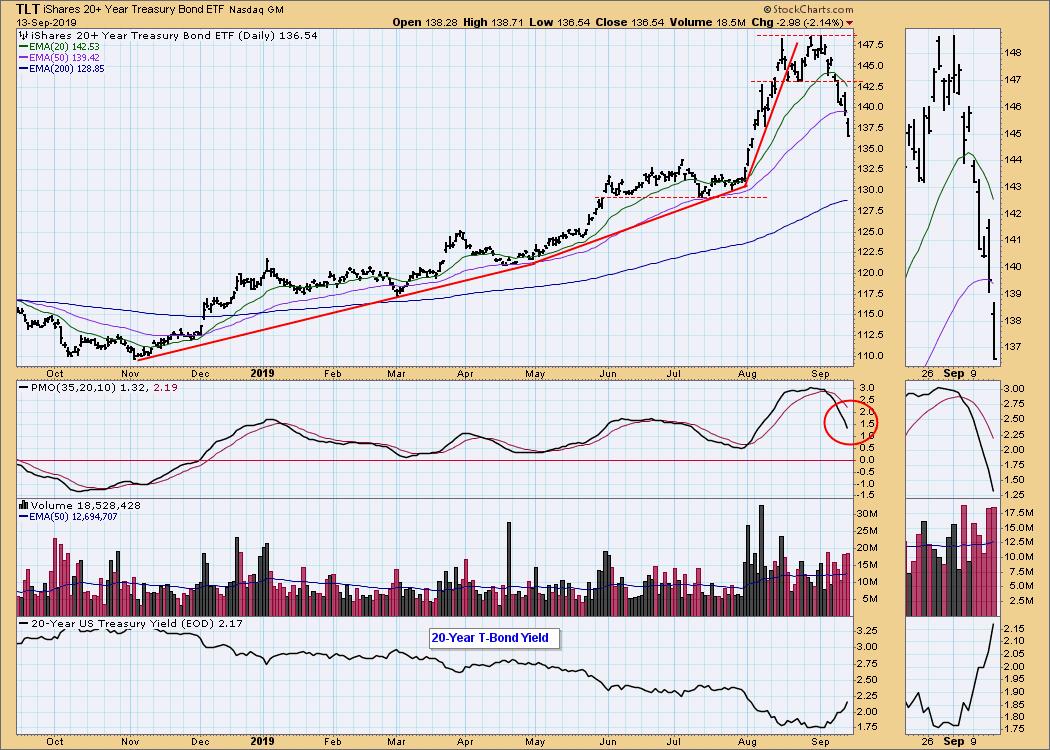
BONDS (TLT)
IT Trend Model: BUY as of 12/6/2018
LT Trend Model: BUY as of 1/2/2019
TLT Daily Chart: Last week TLT closed at the bottom of a trading range that looked like a flag. That illusion was shattered with a sharp breakdown on Monday. This pullback will come in handy if the Fed cuts rates next week -- handy in the regard that bond prices will be able to rally without exceeding recent highs.
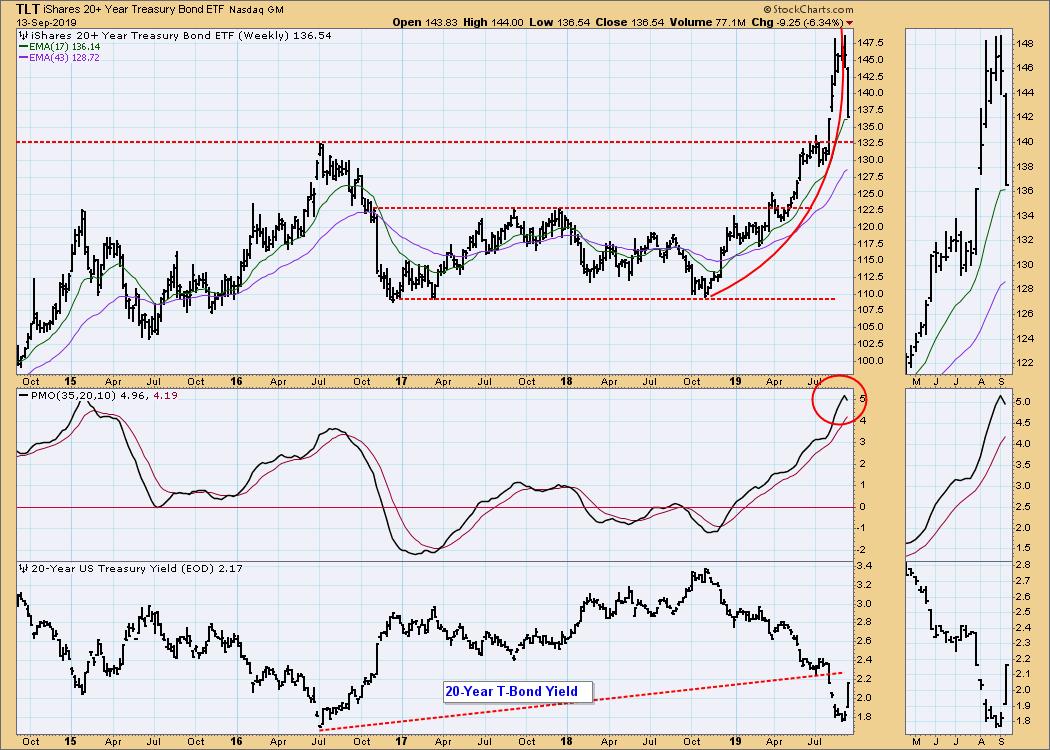
TLT Weekly Chart: I love those parabolic advances -- we know they are doomed to break down the steeper they get. Support is obvious, though not inviolate, at 132.50. The weekly PMO has topped.
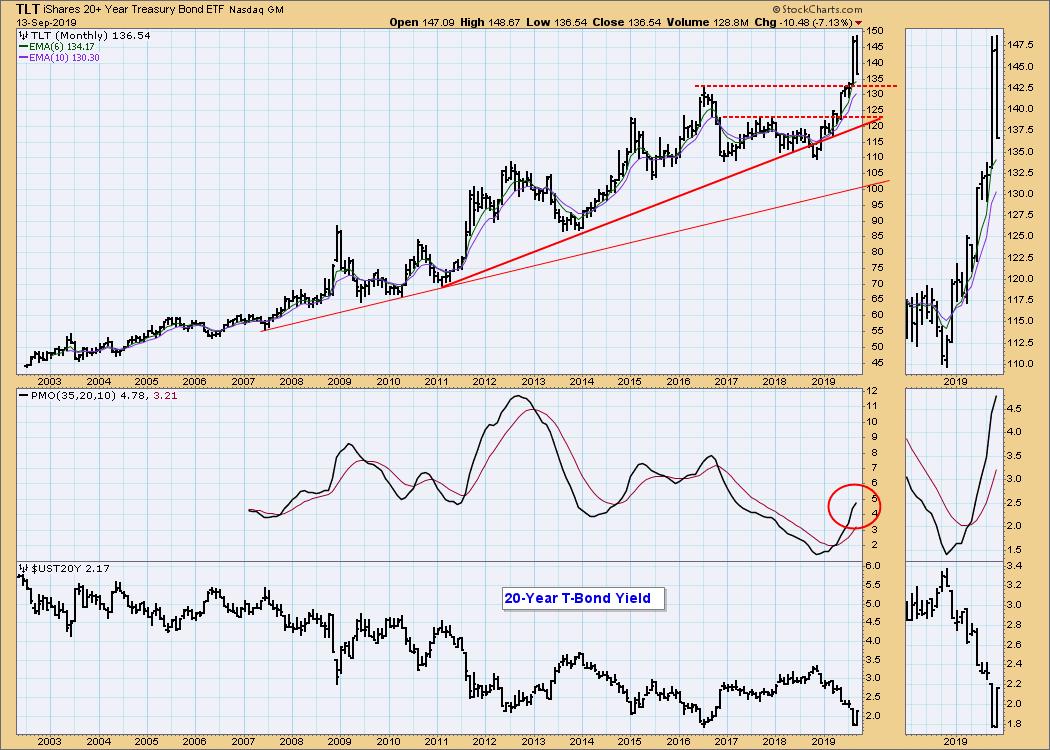
TLT Monthly Chart: The monthly chart is not final for this month, but we need to take a peek to see where other support might be. It looks like horizontal support and a rising trend line could stop a decline around 120 to 125.
**Don't miss any of the DecisionPoint commentaries! Go to the "Notify Me" box toward the end of this blog page to be notified as soon as they are published.**
Technical Analysis is a windsock, not a crystal ball.
Happy Charting! - Carl
NOTE: The signal status reported herein is based upon mechanical trading model signals, specifically, the DecisionPoint Trend Model. They define the implied bias of the price index based upon moving average relationships, but they do not necessarily call for a specific action. They are information flags that should prompt chart review. Further, they do not call for continuous buying or selling during the life of the signal. For example, a BUY signal will probably (but not necessarily) return the best results if action is taken soon after the signal is generated. Additional opportunities for buying may be found as price zigzags higher, but the trader must look for optimum entry points. Conversely, exit points to preserve gains (or minimize losses) may be evident before the model mechanically closes the signal.
Helpful DecisionPoint Links:
DecisionPoint Shared ChartList and DecisionPoint Chart Gallery
Price Momentum Oscillator (PMO)
Swenlin Trading Oscillators (STO-B and STO-V)


