
I discovered an interesting phenomenon today. When I ran my general Price Momentum Oscillator (PMO) scan, I got 19 results. That's more than we've seen the last few days, but then I decided I'd also run my Scan for Dogs, which is basically the inverse of the bullish General PMO Scan. When I ran that, I got 70 results! This makes me very suspicious of the market right now. I'll give you one chart today as a possible short, but I personally don't have the risk appetite for shorting, so I rarely do. If the market takes a header, I'll be putting more shorts in the Diamond Report. Oh! One more thing... Northrup-Grumman (NOC) came up again in today's General PMO scan.
Welcome to the "DecisionPoint Daily Diamonds", a newsletter in which we highlight five "diamonds in the rough," taken from the results of one of my DecisionPoint scans. Remember, these are not recommendations to buy or sell, but simply stocks that I found interesting. The objective is to save you the work of the initial, tedious culling process, but you need to apply your own analysis to see if these stocks pique your interest. There are no guaranteed winners here.
Current Market Outlook:
Market Trend: DP Trend Models are currently on BUY signals. However, the market is weakening.
Market Condition: The market is overbought now that it has reached all-time highs. Momentum is decelerating.
Market Environment: It is important to consider the "odds" for success. Here are the current percentages on the Silver and Golden Cross Indexes, which are continuing to rise:
Silver Cross: 69.6% SPX ITTM Buy Signals
Golden Cross: 65.6% SPX LTTM Buy Signals
Of the 19 results I got today from the General PMO scan, I narrowed it down to these four bullish setups:
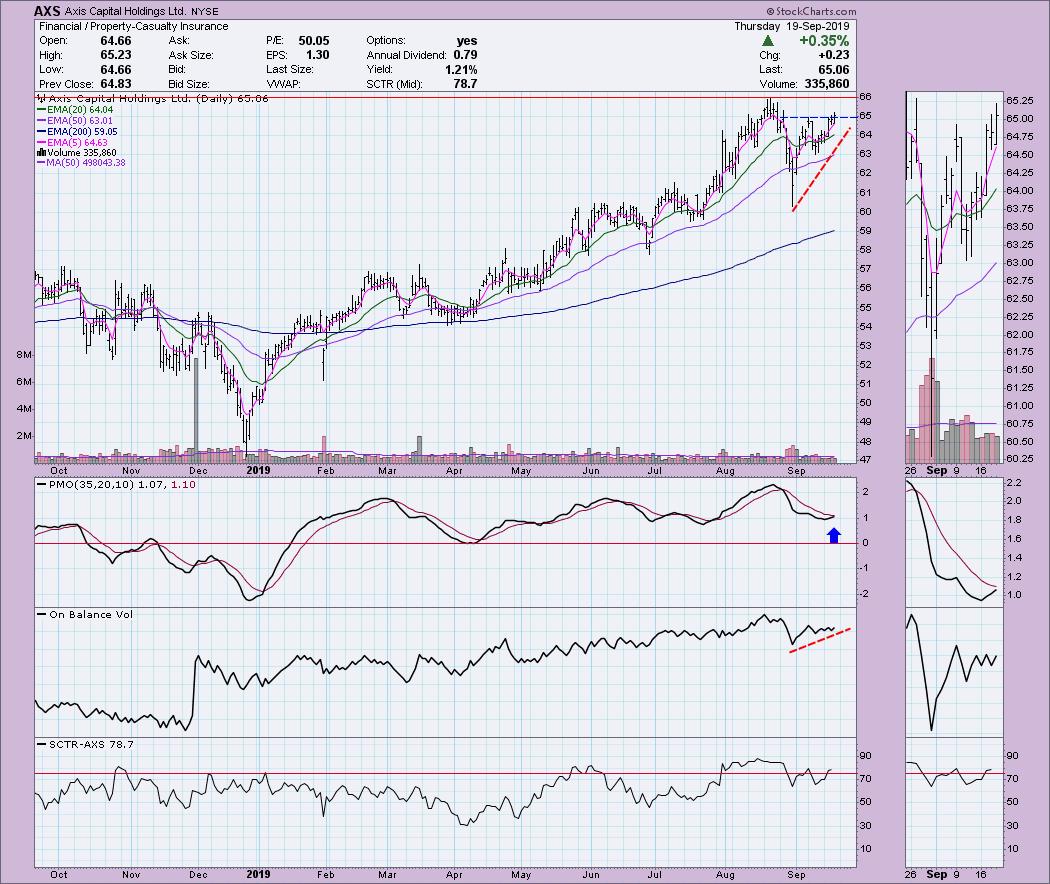
Axis Capital Holdings Ltd (AXS): Today saw a tiny price breakout from the short-term top in early September. The volume pattern looks pretty good and I like the way the OBV is rising with price. My one caveat is that upside potential is at $66. That's not a big gain, and $66 is its all-time high. However, if it does break out to a new all-time high, it'll likely be a nice ride up. For now, tight-stop or watchlist it.
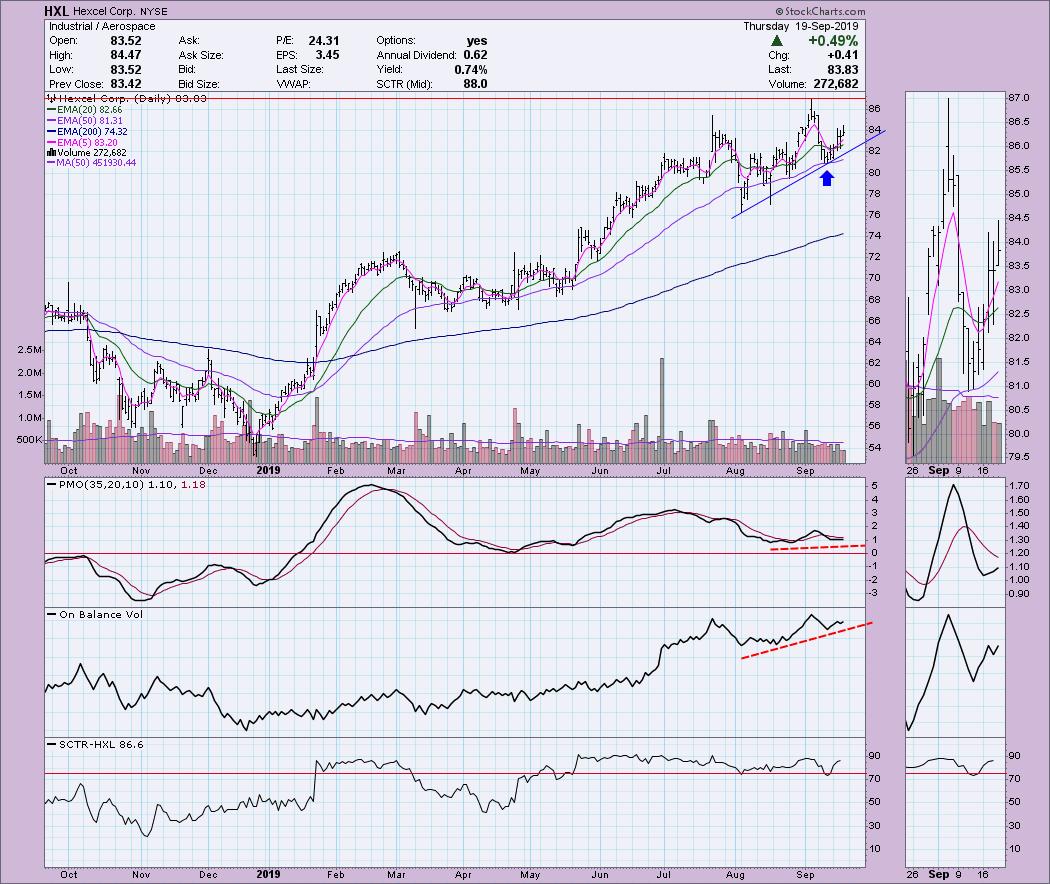
Hexcel Corp (HXL): Price is in a solid rising trend and PMO/OBV bottoms are rising with price. The SCTR is 86.6, which is very healthy. Overhead resistance is at about $87. This month's top is the all-time high for HXL, but it looks good for a ride to that level and, like AXS above, if it does break out, I'd expect it to form support at that previous resistance level and continue on higher.
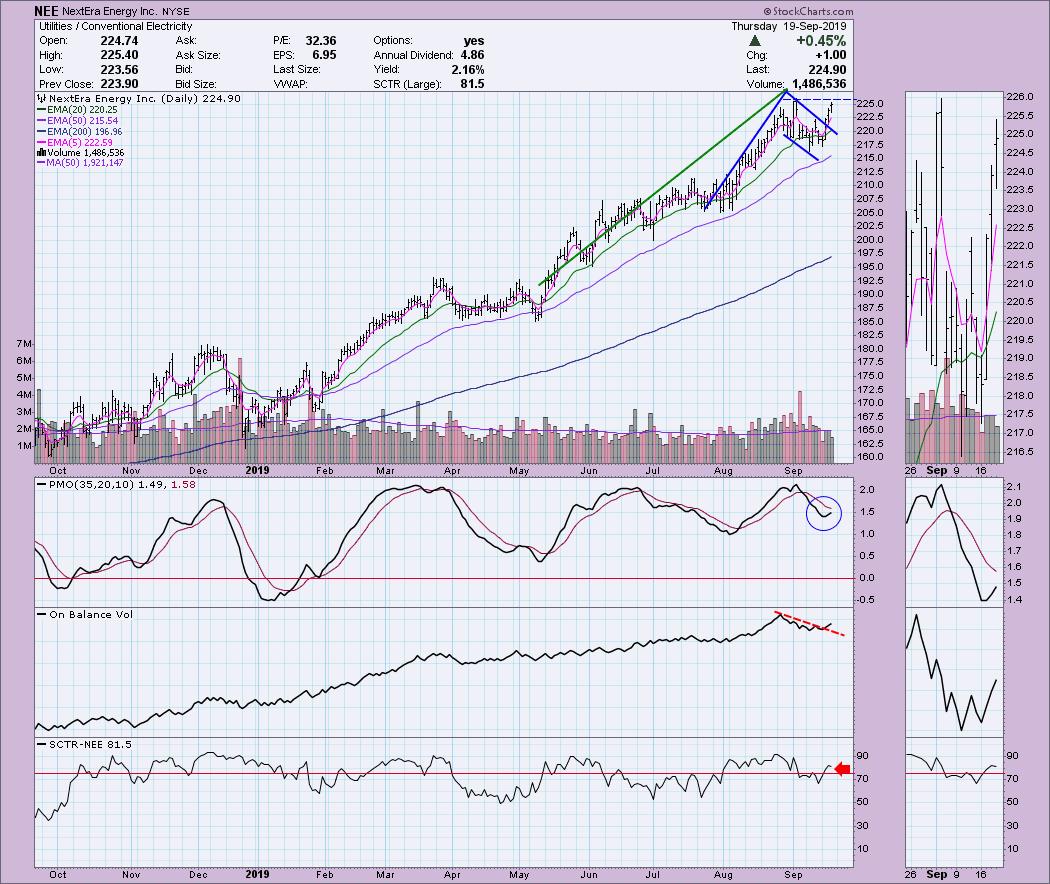
NextEra Energy Inc (NEE): I can't help but think of the knights in Monty Python and the Holy Grail when I see the symbol "NEE." Right now, I can see the execution of a flag formation. Conservatively, I'd make the flagpole the "blue" line, but you could easily make a case for the green line to be the flagpole. Why's that important? Well, the minimum upside target is calculated by taking the height of the flagpole and adding it to the breakout point from the flag. That would conservatively put the minimum upside target at about $242.50 and aggressively about $252.50. It still needs to break above the September top at $226, but this is a possible early entry. Note that the OBV is breaking from the declining trend and the SCTR just entered the "hot zone" above 75.
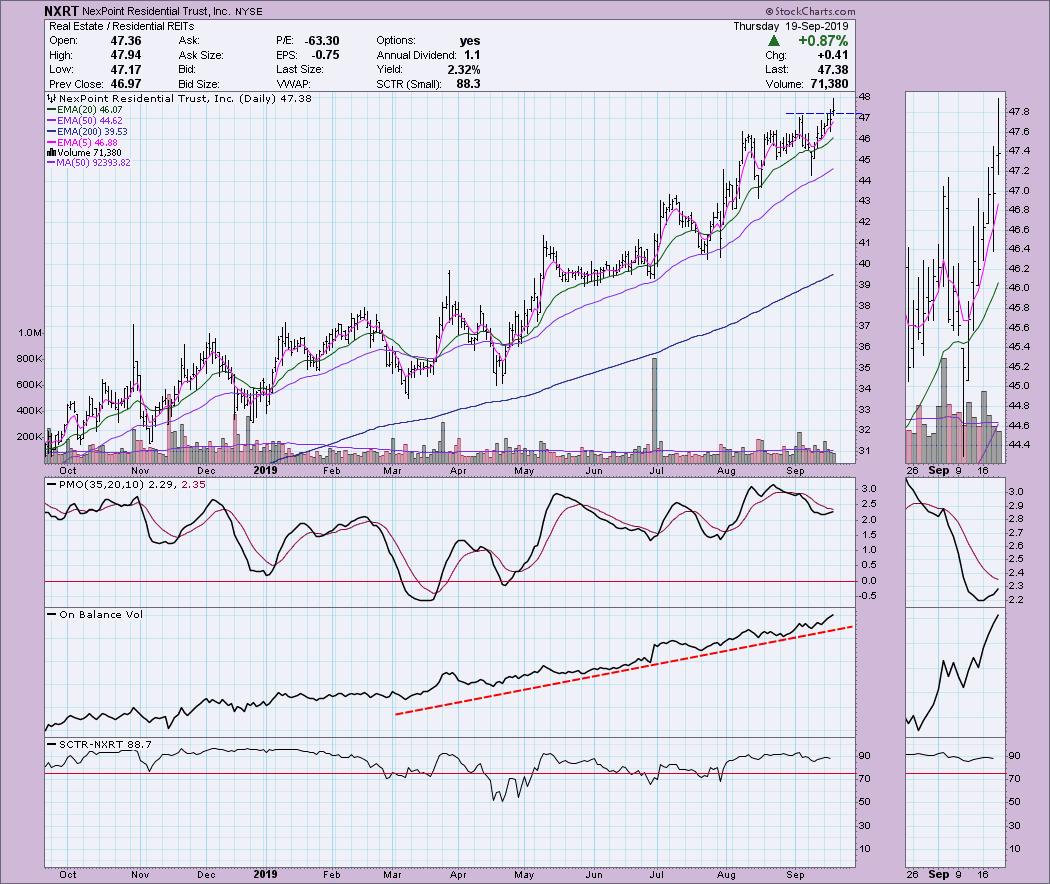
NexPoint Residential Trust Inc (NXRT): I like this chart. The only thing I don't like is price closing off the highs today. I'm not overly worried about that since the close was above overhead resistance. The PMO isn't that overbought and is hooking up nicely. The OBV is continuing in a nice rising trend.
Of the 70 results I got today from the Scan for Dogs, I narrowed it down to this bearish setup:
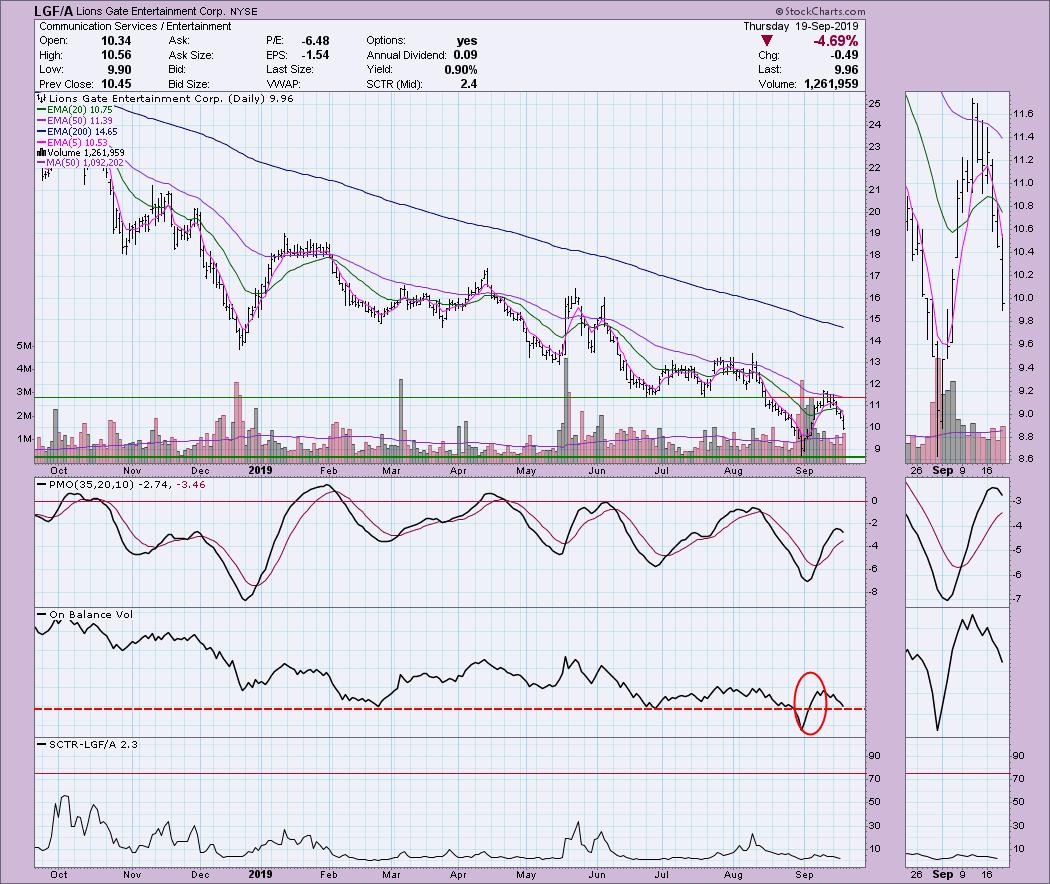
Lions Gate Entertainment Corp. (LGF/A): This one is certainly is a "dog." It hit overhead resistance at $11.50 and promptly lost steam. Today was a big down day, so be prepared for a possible throwback toward the breakdown point, despite all the pop in the OBV during the accumulation phase. For optimum distribution, I would look for the OBV to challenge that low. How do you get the OBV to move lower? Negative closes. So look for more downside. One trick that I learned from David Keller regarding shorting: if you put a minus sign (-) in front of the symbol, that will flip it upside down. If it looks like a good "buy" when you look at it that way, then you're likely shorting the right stock!
Full Disclosure: I do not own any of the stocks above and I am not planning on purchasing/shorting any at this time. I'm currently about 60% in cash, so I will be considering new longs depending on market trend and condition improving.
Watch the latest episode of DecisionPoint with Carl & Erin Swenlin LIVE on Mondays 5:00p EST or on the StockCharts TV YouTube channel here!
Technical Analysis is a windsock, not a crystal ball.
Happy Charting!
- Erin
erinh@stockcharts.com
NOTE: The stocks reported herein are from mechanical trading model scans that are based upon moving average relationships, momentum and volume. DecisionPoint analysis is then applied to get five selections from the scans. The selections given should prompt readers to do a chart review using their own analysis process. This letter is not a call for a specific action to buy, sell or short any of the stocks provided. There are NO sure things or guaranteed returns on the daily selection of "diamonds in the rough".
Helpful DecisionPoint Links:
DecisionPoint Shared ChartList and DecisionPoint Chart Gallery
Price Momentum Oscillator (PMO)
Swenlin Trading Oscillators (STO-B and STO-V)
**Don't miss DecisionPoint Commentary! Add your email below to be notified of new updates"**


