
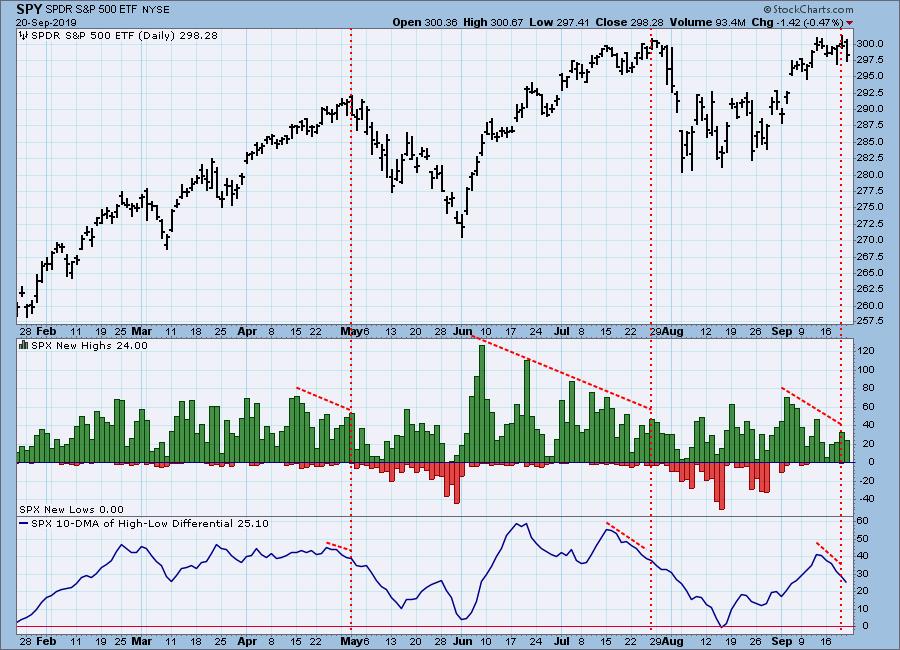
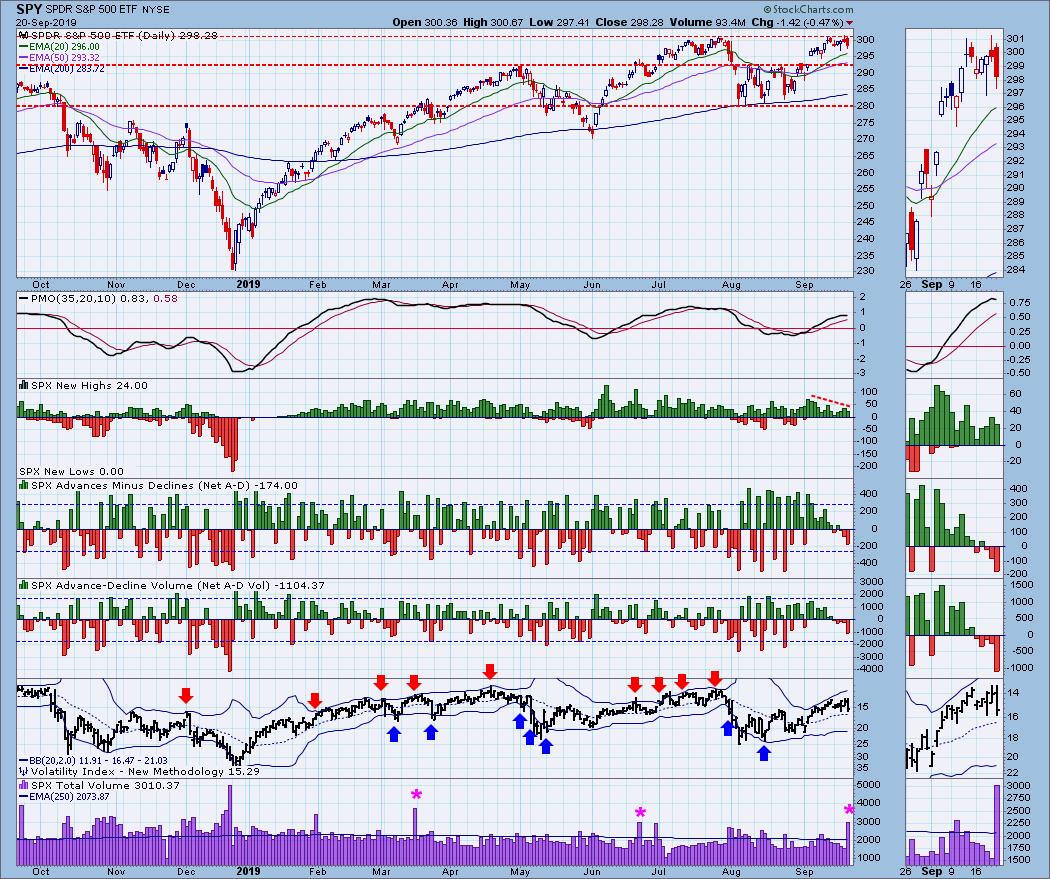
While SPY made another all-time intraday high on Thursday, the number of S&P 500 component New Highs continued to contract from the level they had reached earlier this month. This kind of activity should be taken as a warning flag, increasing our expectation of a price top. Also interesting is that the New High complex for this month is considerably smaller than the New High complex of June and July, showing us how dramatically participation has waned.
The DecisionPoint Weekly Wrap presents an end-of-week assessment of the trend and condition of the stock market (S&P 500), the U.S. Dollar, Gold, Crude Oil, and Bonds.
Watch the latest episode of DecisionPoint on StockCharts TV's YouTube channel here!
GLOBAL MARKETS
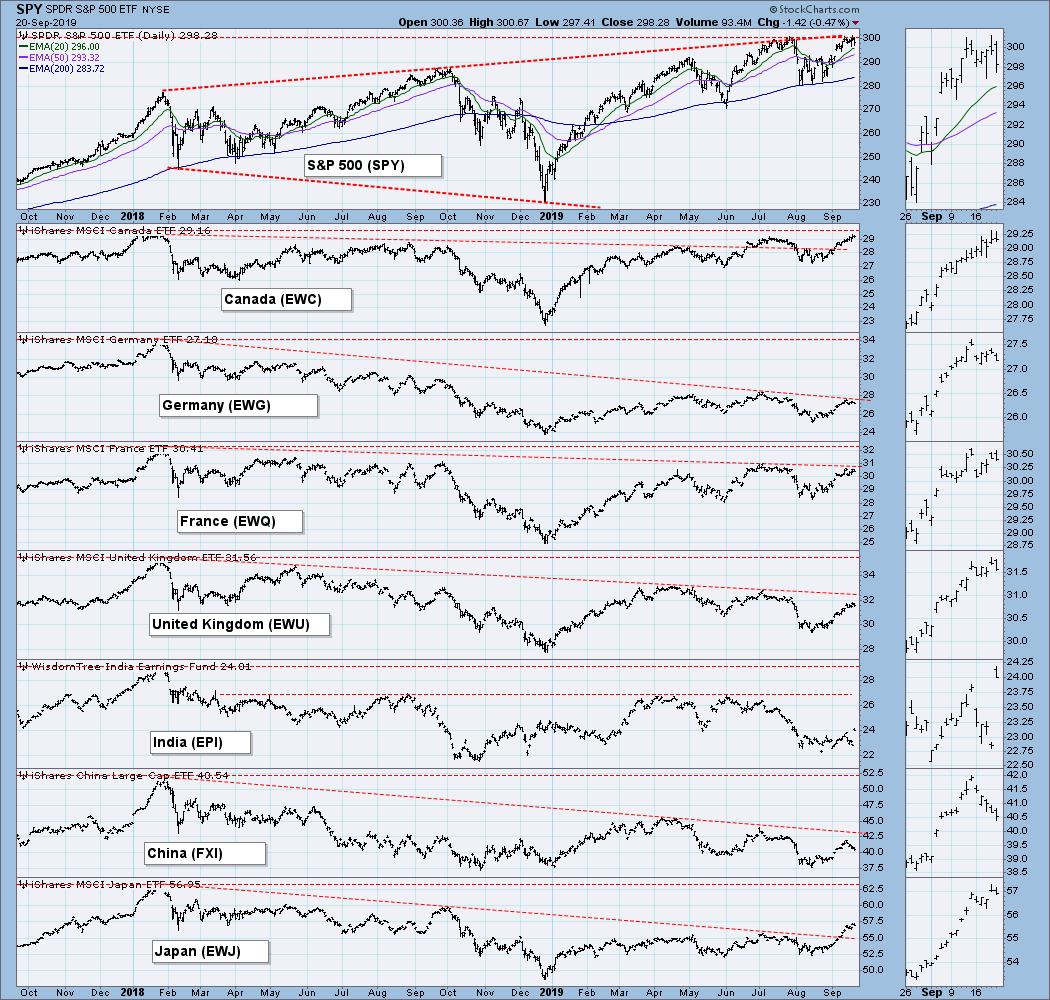
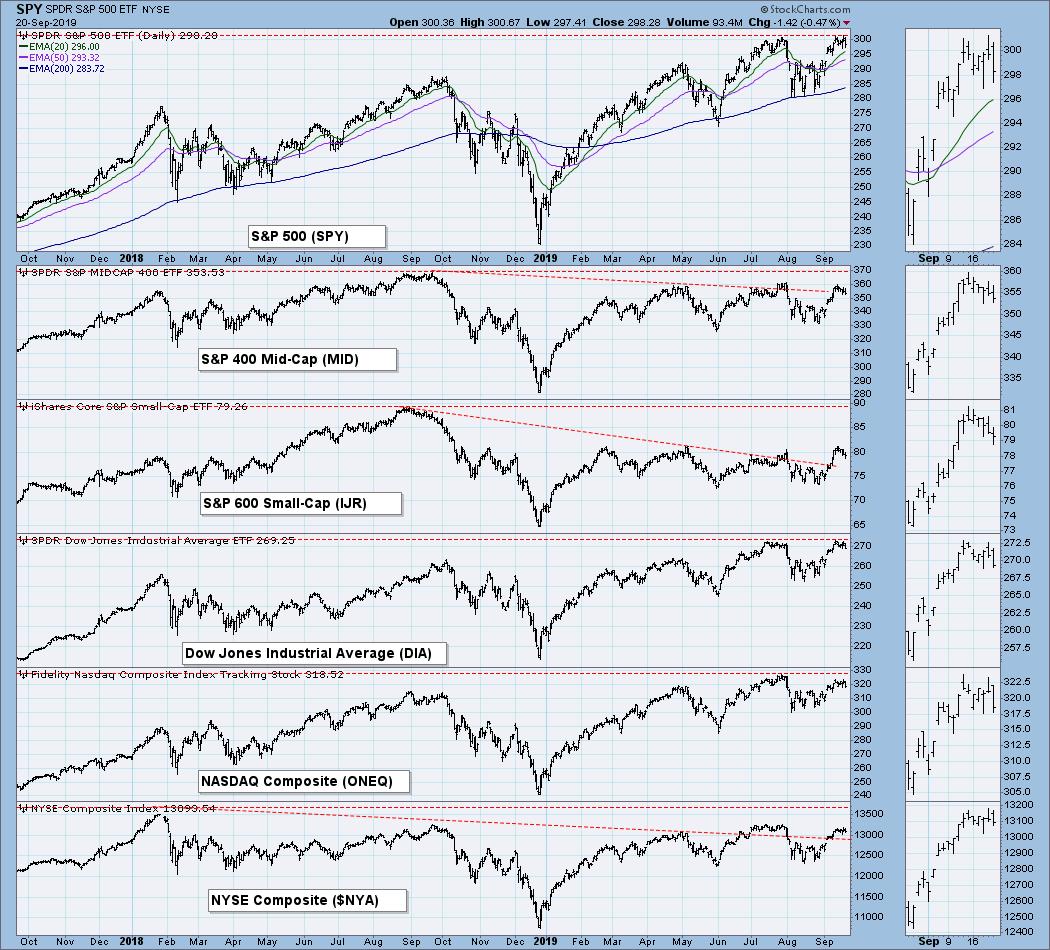
These charts and the Broad Market Indexes charts below are included in this report because I think, for background, we need to be generally aware of what these indexes are doing, but on a deeper level, I don't really care enough to get into a tedious analysis of them, unless something catches my eye. Look at the charts, deposit your general impression in your memory bank, and move on.
BROAD MARKET INDEXES
SECTORS
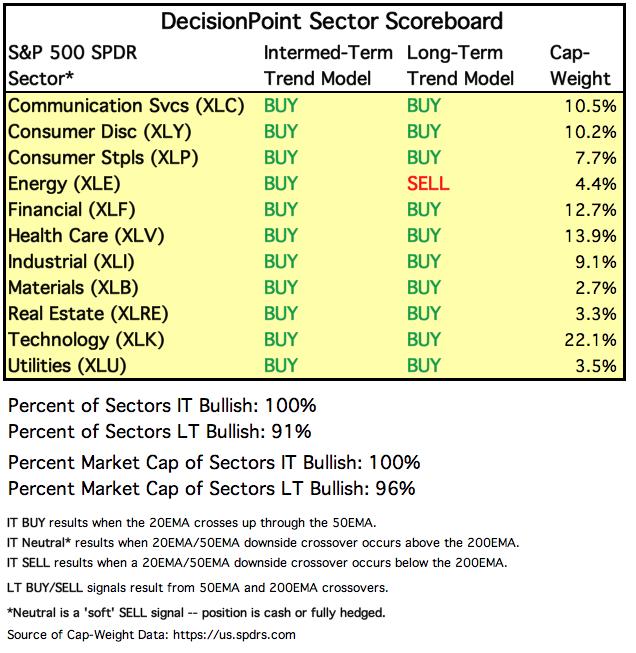
Each S&P 500 Index component stock is assigned to one, and only one, of 11 major sectors. This is a snapshot of the Intermediate-Term and Long-Term Trend Model signal status for those sectors.
INTEREST RATES
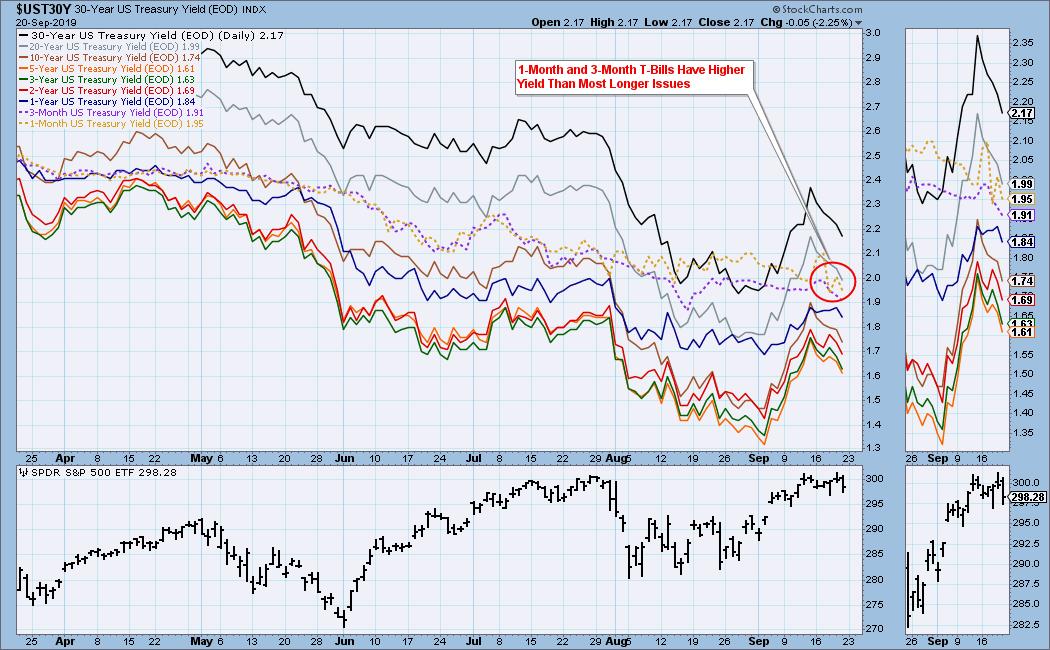
In normal circumstances the longer money is borrowed the higher the interest rate that must be paid. When rates are inverted, the reverse is true. It is generally believed that rate inversions result from "a flight to safety." On the chart below, notice that the one-month and three month T-Bills (dotted lines) pay a higher interest rate than the one year through the 10-year T-Bonds. This is a serious problem for the stock market.
STOCKS
IT Trend Model: NEUTRAL as of 9/6/2019
LT Trend Model: BUY as of 2/26/2019
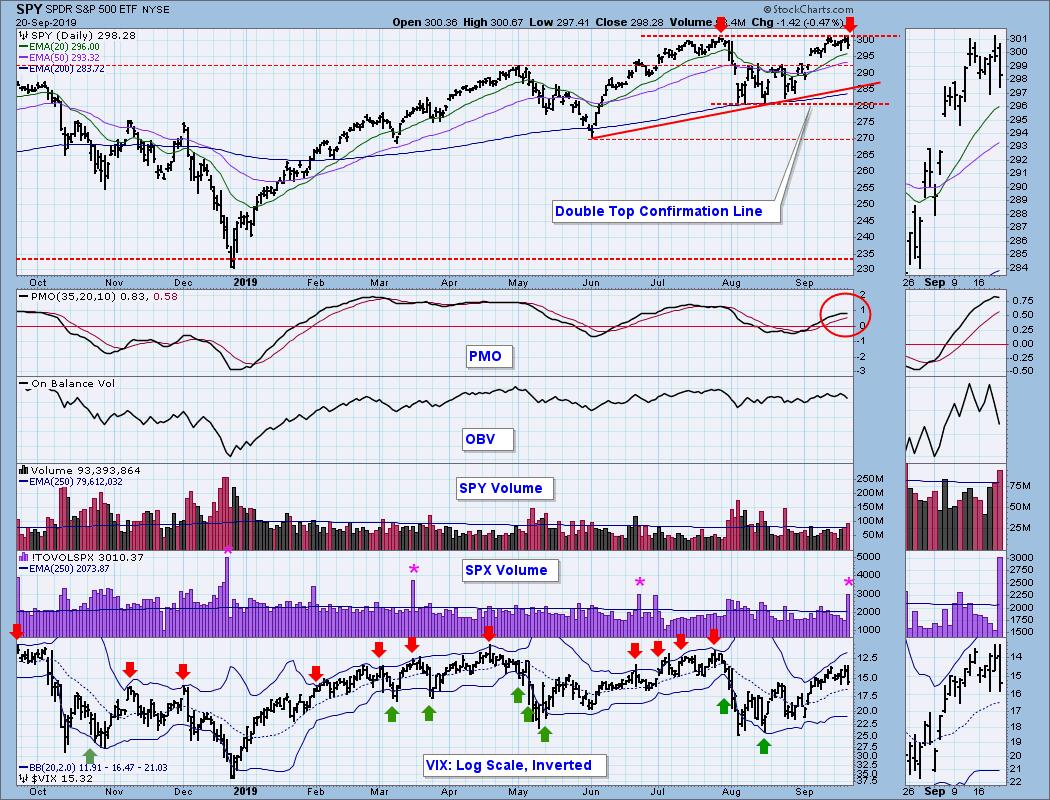
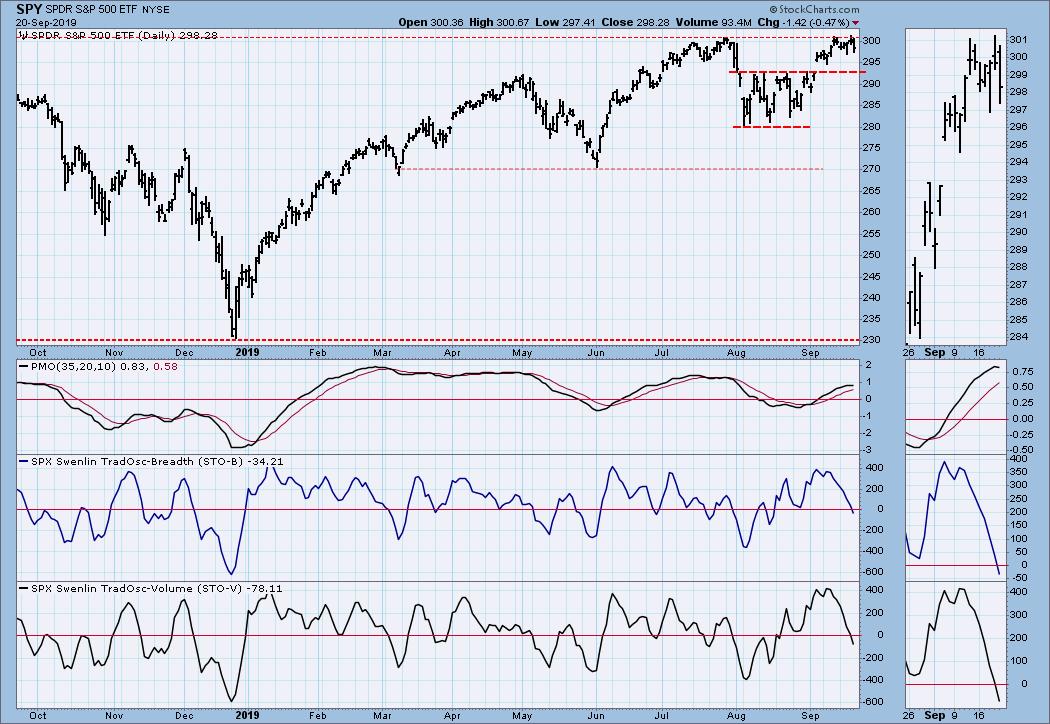
SPY Daily Chart: Volume was high today because of end-of-quarter options expiration, but it wasn't so high that we could infer that a selling climax took place. OBV for SPY shows a negative divergence, but OBV for $SPX (not shown) has formed a reverse divergence. Either way that picture is negative. Finally, we can see the potential for a double top. The confirmation line is at about 280, and the minimum downside target is 260.
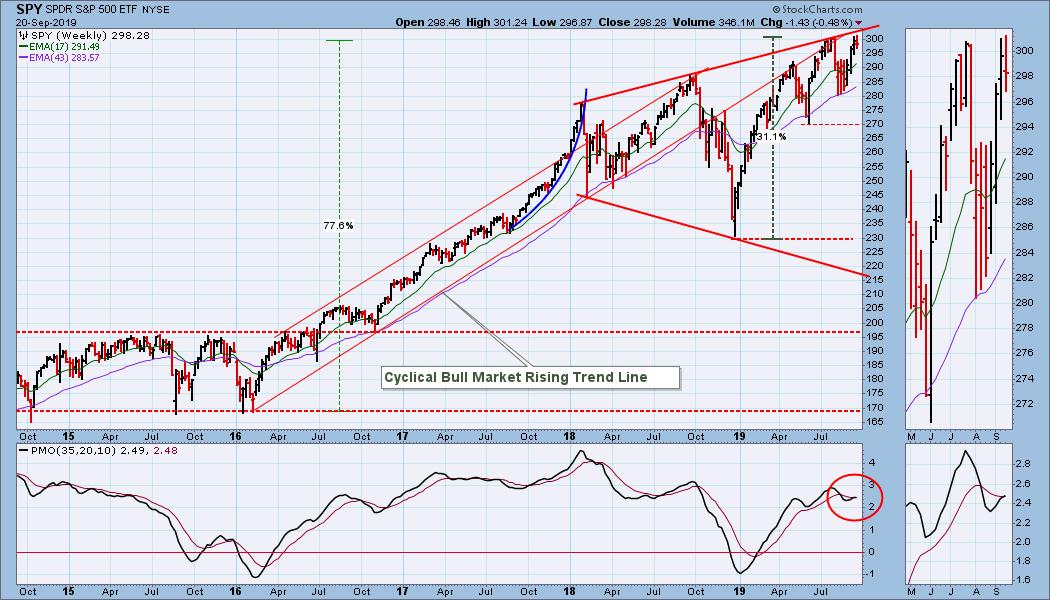
SPY Weekly Chart: The weekly PMO has crossed up through the signal line, but for the time being, I am considering that to be an "over shoot" that will soon reverse.
Climactic Market Indicators: Today's high volume notwithstanding, there really wasn't any climactic activity this week.
Short-Term Market Indicators: This month the STO-B and STO-V both topped and dropped quickly to the zero line, but as often happens, price did not succumb to this apparent weakness. Stay tuned. It is not too late to see price pulling back.
Intermediate-Term Market Indicators: I have added two new panels to this chart -- SPX Stocks Above 20EMA and SPX PMOs Rising. These indicators are subject to short-term perturbations, but they also can show intermediate-term internal trends, like the falling tops that preceded the price tops in 2018 and 2019. As it happens, they are currently showing some weakness, but the ITBM, ITVM, and PMO are overbought and topping. I'd say we have a pretty good indication of a price top in progress.
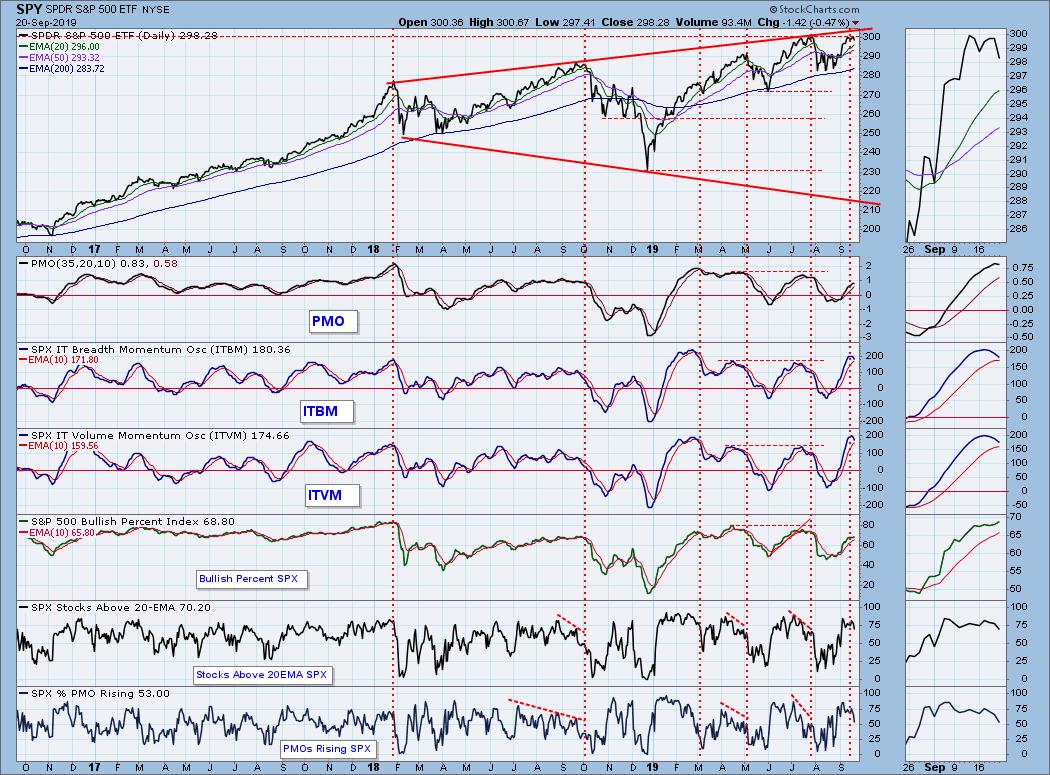
CONCLUSION: Intermediate-term indicators are topping, and there is a double price top forming, so I think we could see a pullback begin as early as next week. If the double top continues to develop, the potential initial downside is about -15%.
Erin and I do a 30-minute show on StockCharts TV on Mondays at 5 pm ET. If you can't make that schedule, you can watch it on YouTube. Please check it out!
DOLLAR (UUP)
IT Trend Model: BUY as of 7/5/2019
LT Trend Model: BUY as of 5/25/2018
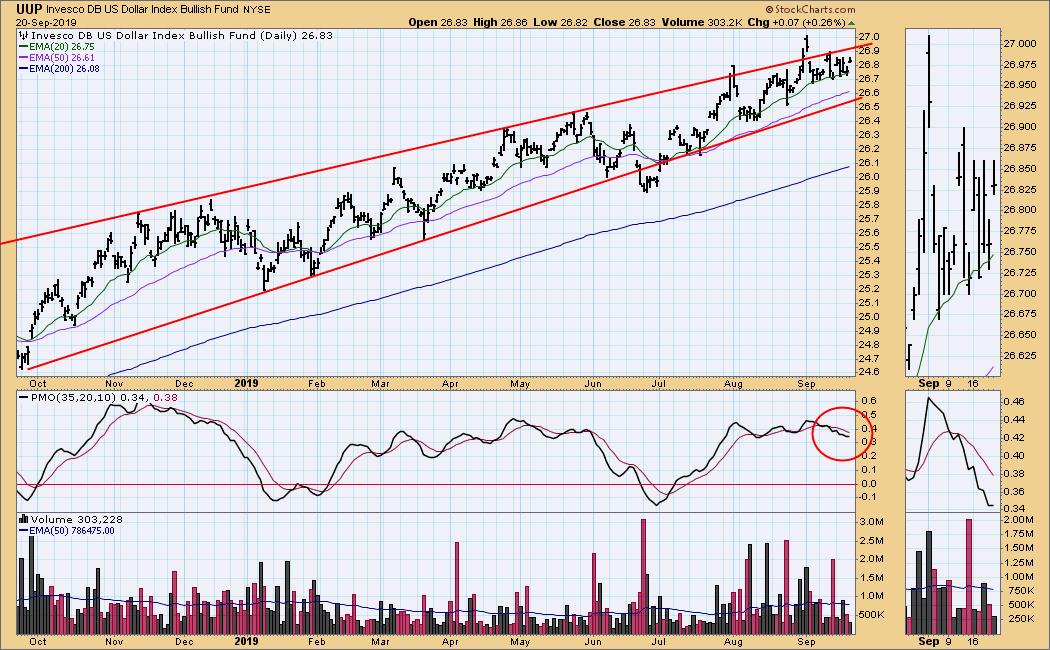
UUP Daily Chart: UUP has been supported by the 20EMA for nearly three months, as it presses against the top of a rising wedge pattern. The PMO is positive and level, reflecting UUP's steady advance.
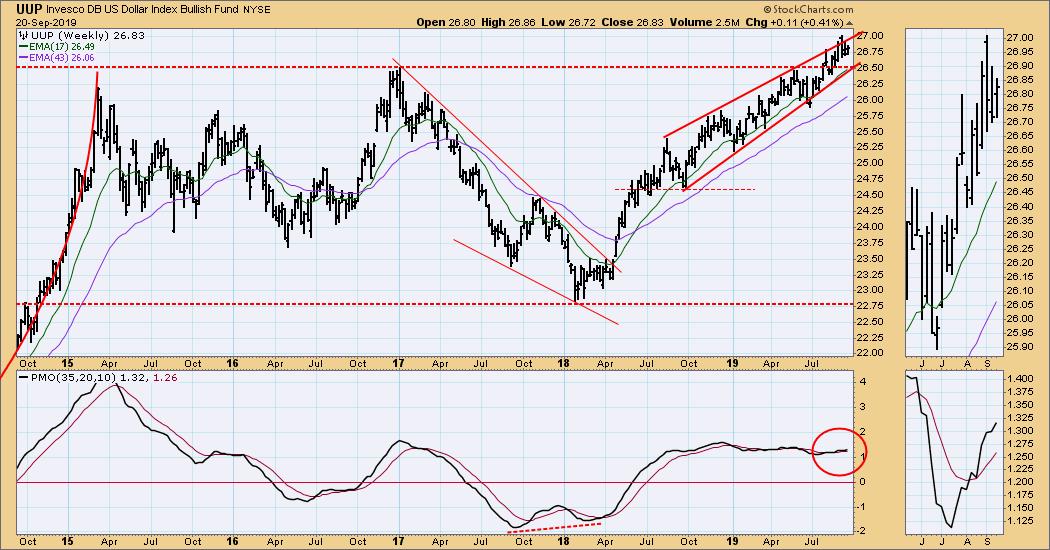
UUP Weekly Chart: The break above long-term resistance is not yet "decisive'" but it is persistent. The technical expectation for the rising wedge is a downside resolution, but there are no signs of that yet.
GOLD
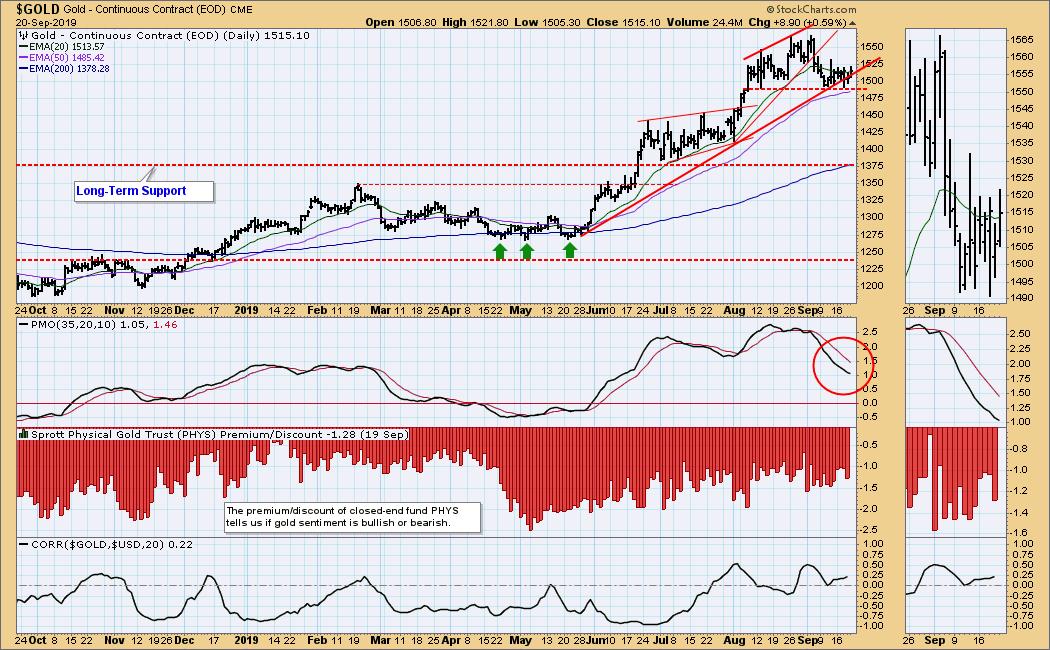
IT Trend Model: BUY as of 6/3/2019
LT Trend Model: BUY as of 1/8/2019
GOLD Daily Chart: Gold is trying to move sideways through the rising trend line. It is encouraging that it hasn't broken down yet, but the August-September head and shoulders pattern is not encouraging.
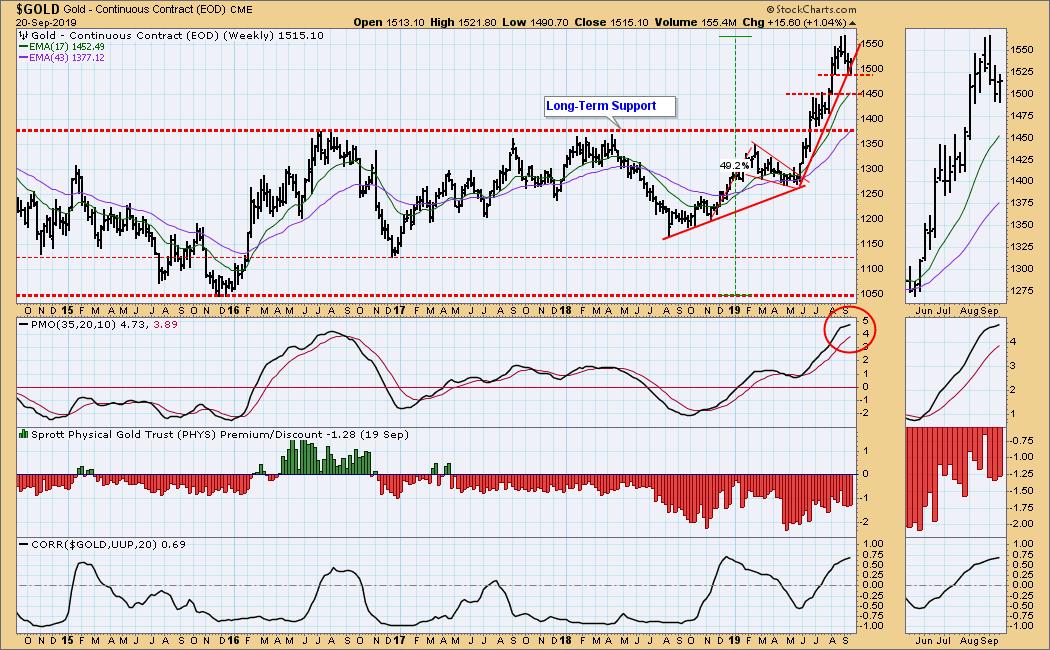
GOLD Weekly Chart: The weekly PMO seems about to top, and I think we're going to see a pullback. Obvious support is at 1450 and 1375.
CRUDE OIL (USO)
IT Trend Model: BUY as of 9/16/2019
LT Trend Model: SELL as of 6/4/2019
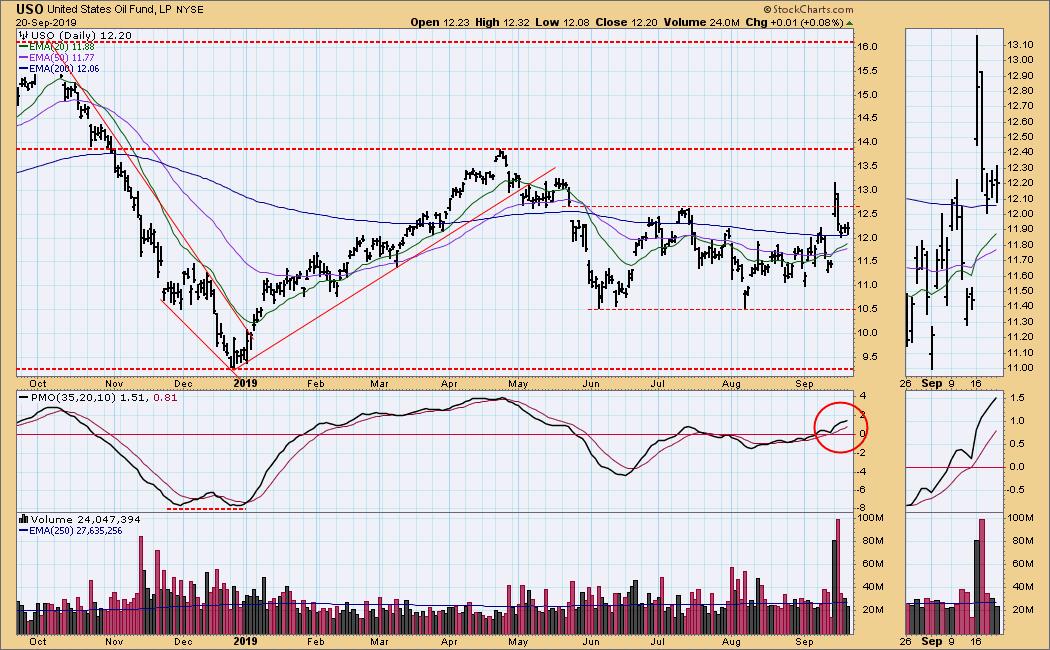
USO Daily Chart: The Iran drone attack on Saudi oil fields on Saturday, caused USO to rally +15% on Monday, but by Wednesday it was back down in the range defined by the July top. Before this happened, I was thinking that USO would drift to the bottom of the range, but now it might drift somewhat higher.
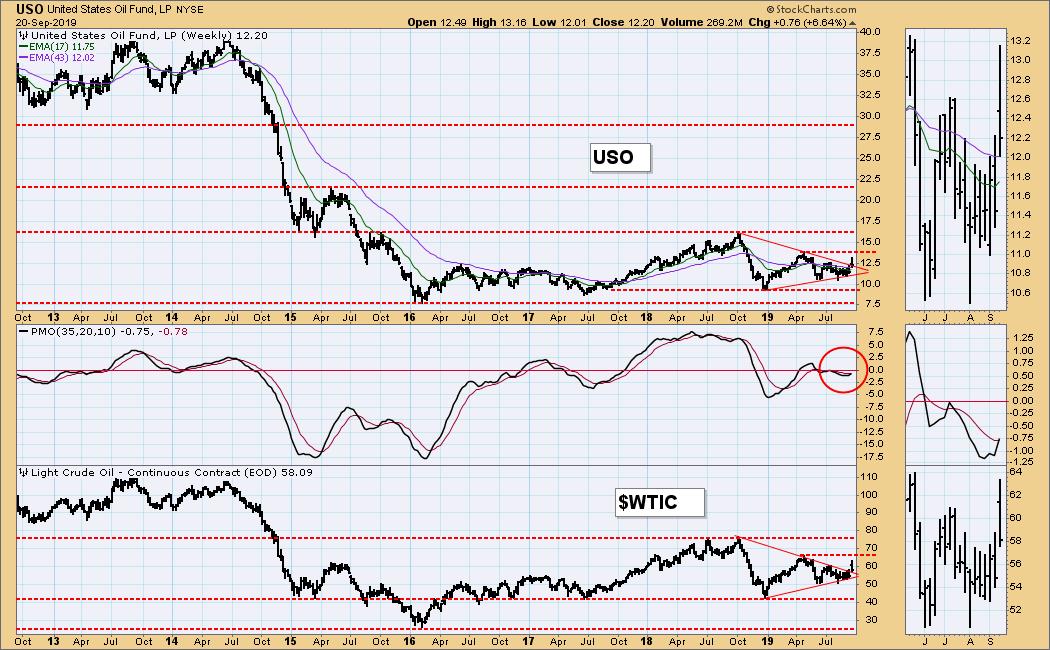
USO Weekly Chart: The triangle patterns we have been watching have resolved upward, but I don't think this is a precursor a major rally. I'm seeing resistance for WTIC at about 65.
BONDS (TLT)
IT Trend Model: BUY as of 12/6/2018
LT Trend Model: BUY as of 1/2/2019
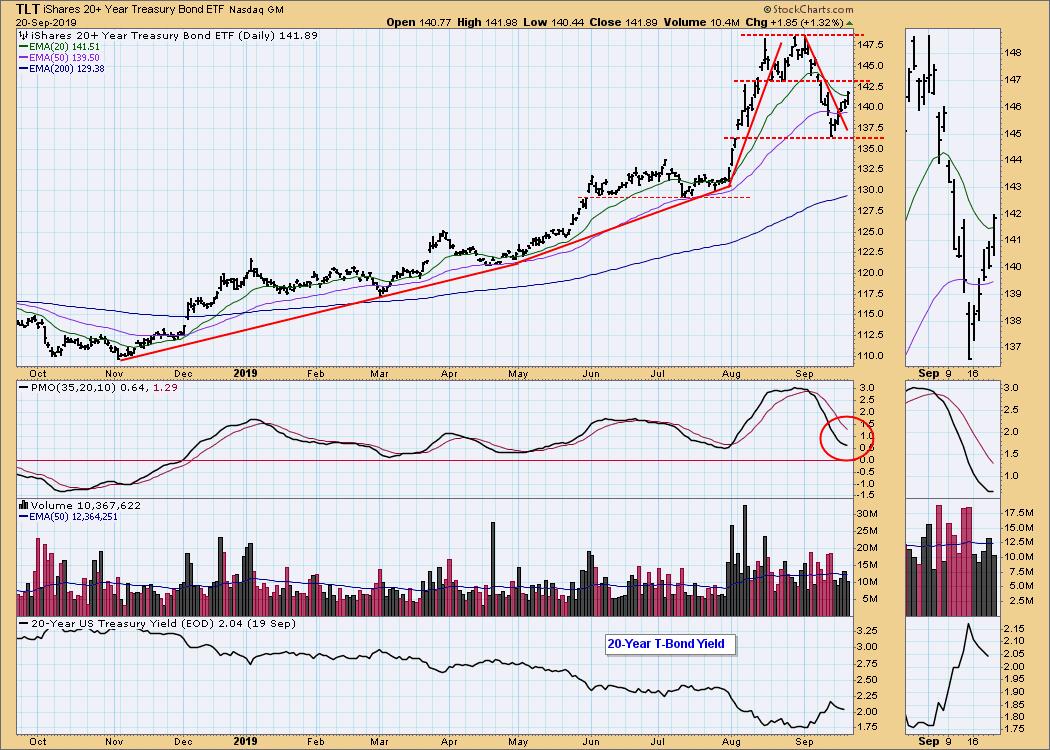
TLT Daily Chart: The decline of TLT this month helped to disperse some of the froth in the market, but the decline was excessive, and a bounce is the result. I'm thinking that the line of resistance at 143 looks like a good place for the bounce to end.
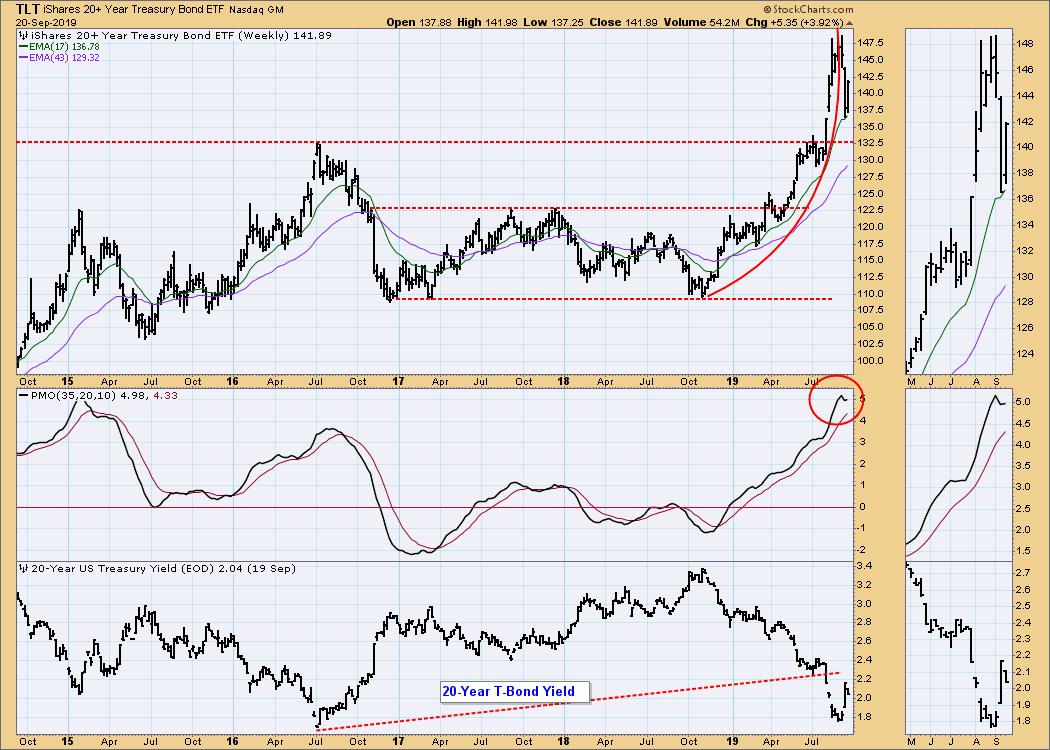
TLT Weekly Chart: This week's bounce has managed to turn the weekly PMO up again. Note that the parabolic line has been broken, so more decline is probably in store. I see good support at 132.50.
**Don't miss any of the DecisionPoint commentaries! Go to the "Notify Me" box toward the end of this blog page to be notified as soon as they are published.**
Technical Analysis is a windsock, not a crystal ball.
Happy Charting! - Carl
NOTE: The signal status reported herein is based upon mechanical trading model signals, specifically, the DecisionPoint Trend Model. They define the implied bias of the price index based upon moving average relationships, but they do not necessarily call for a specific action. They are information flags that should prompt chart review. Further, they do not call for continuous buying or selling during the life of the signal. For example, a BUY signal will probably (but not necessarily) return the best results if action is taken soon after the signal is generated. Additional opportunities for buying may be found as price zigzags higher, but the trader must look for optimum entry points. Conversely, exit points to preserve gains (or minimize losses) may be evident before the model mechanically closes the signal.
Helpful DecisionPoint Links:
DecisionPoint Shared ChartList and DecisionPoint Chart Gallery
Price Momentum Oscillator (PMO)
Swenlin Trading Oscillators (STO-B and STO-V)


