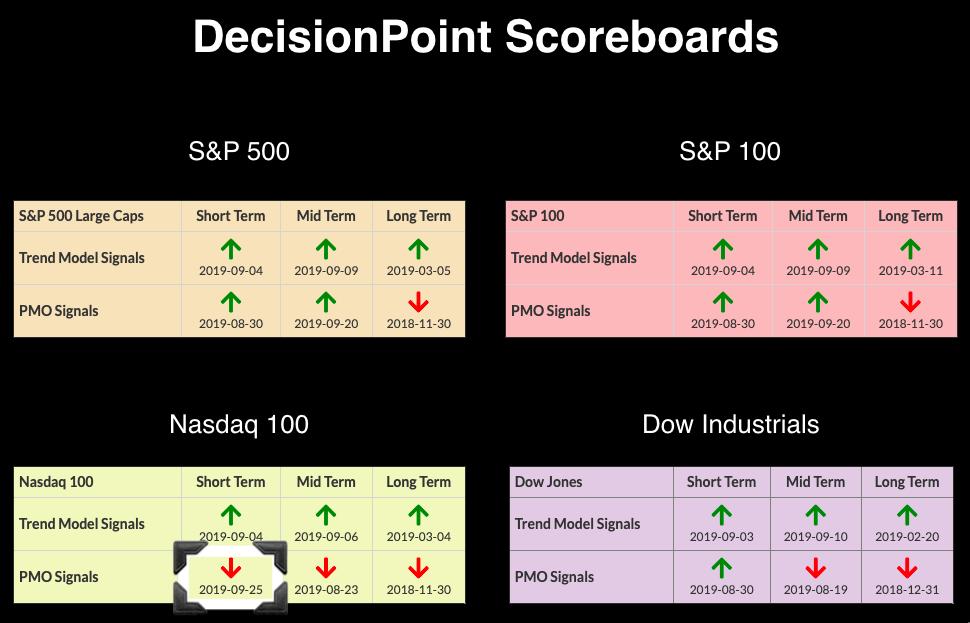
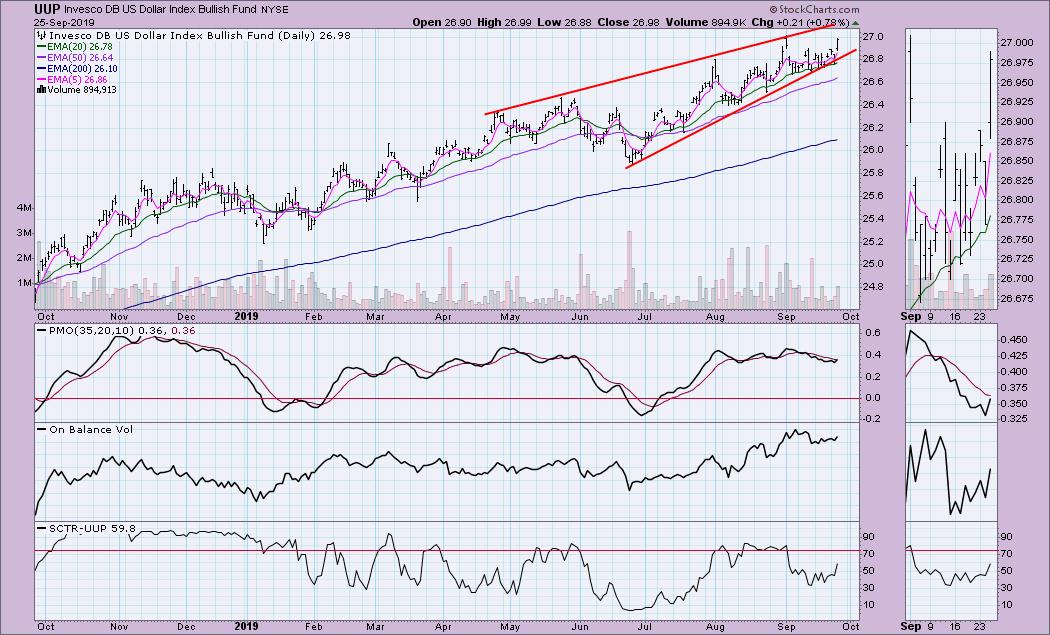
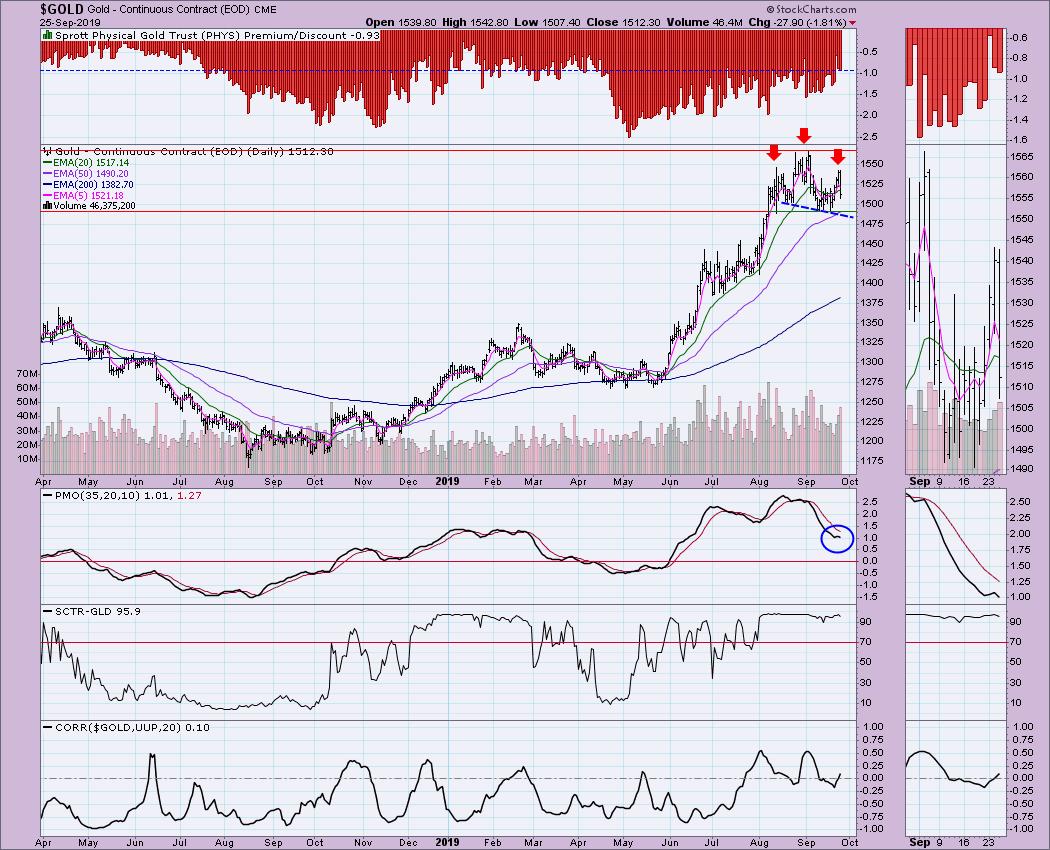
 Technology has continued to underperform the SPX, so it shouldn't surprise anyone that a Price Momentum Oscillator (PMO) SELL signal triggered on the NDX. The chart is below the Scoreboards. Gold topped today, with it now looking like a possible head-and-shoulders reversal pattern. Meanwhile, the Dollar meanders in a bearish rising wedge.
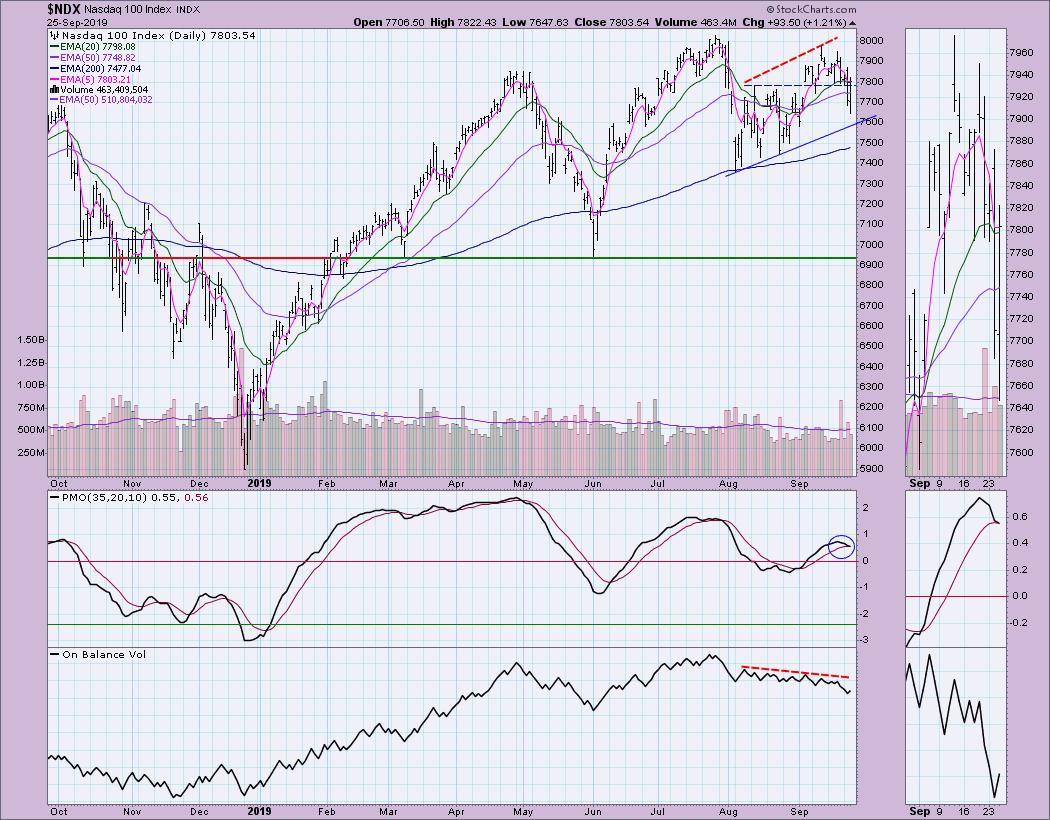
The good news is that the NDX closed near its highs for the day. The bad news is that yesterday and today saw serious breakdowns below short-term support. The other good news would be that the rising bottoms trend line is still intact.
The DecisionPoint Alert presents a mid-week assessment of the trend and condition of the stock market (S&P 500), the U.S. Dollar, Gold, Crude Oil and Bonds.
Watch the latest episode of DecisionPoint on StockCharts TV's YouTube channel here!
GLOBAL MARKETS
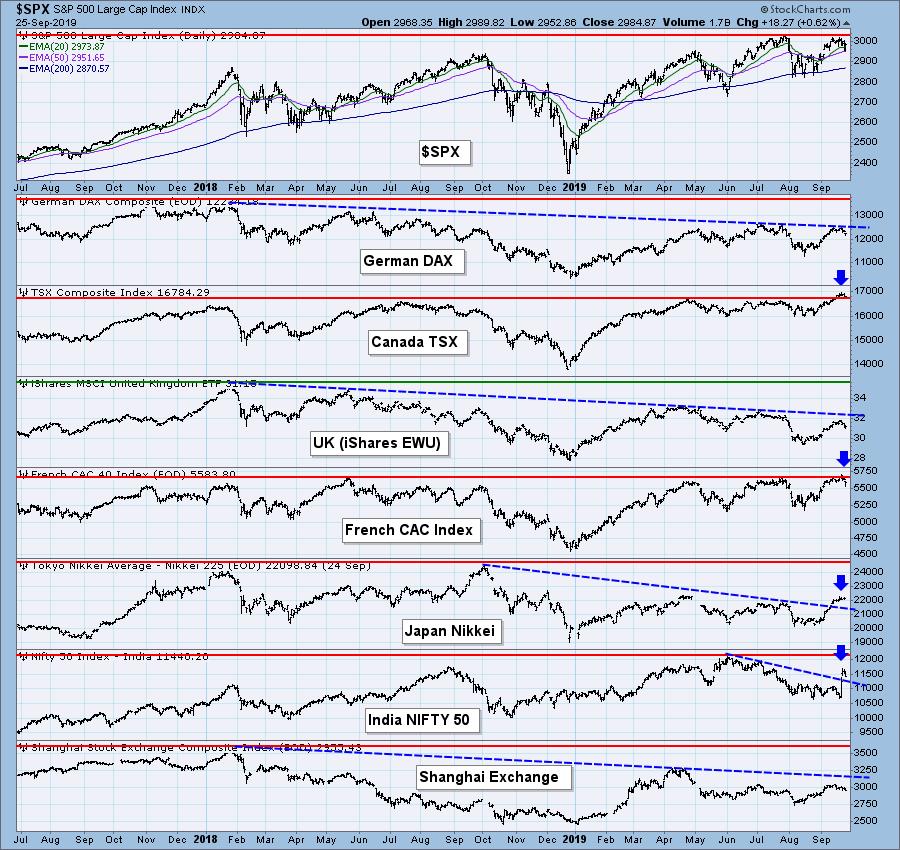
We're finally seeing some breakouts on some of the global indexes, with both the TSX and CAC breaking to new all-time highs without us.
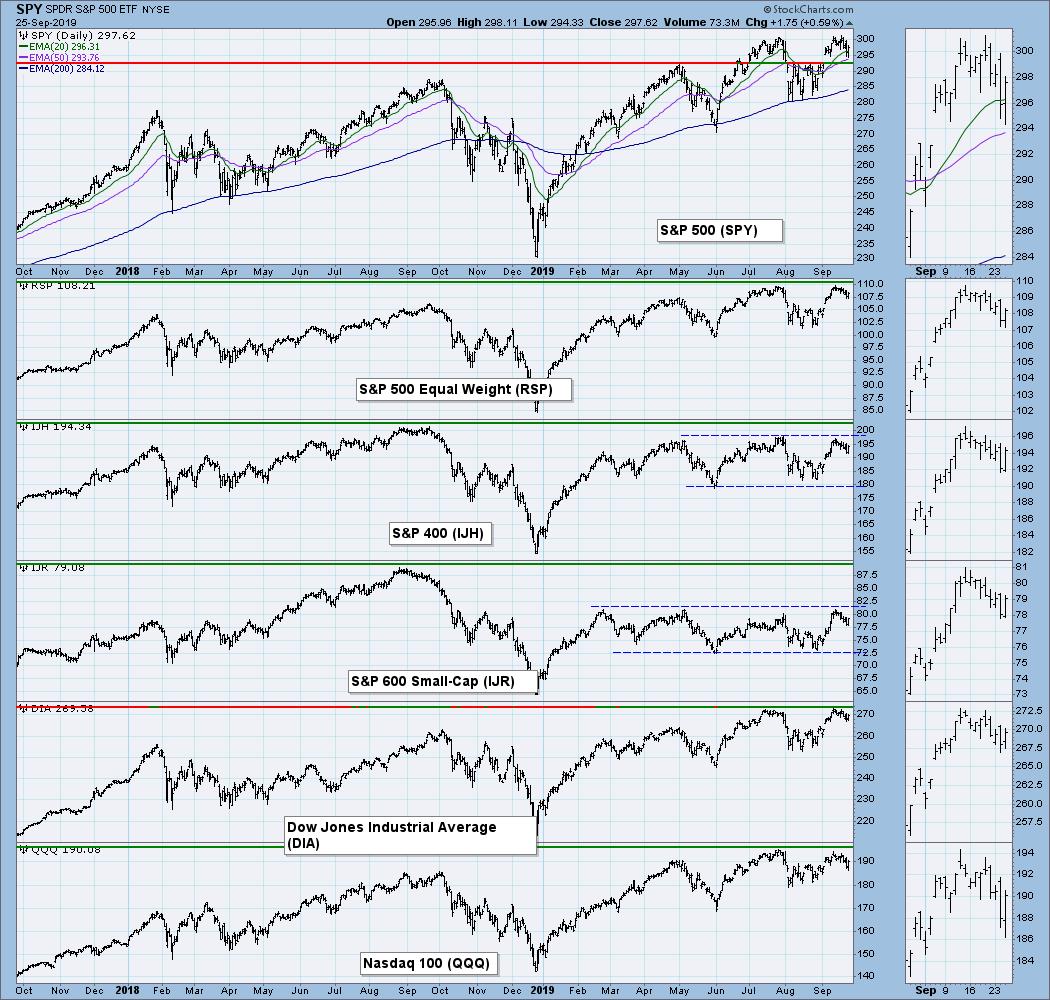
BROAD MARKET INDEXES
SECTORS
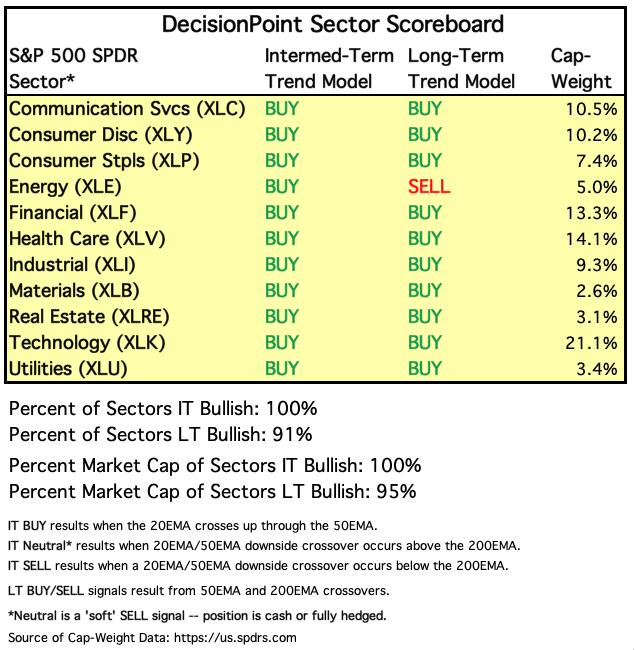
Each S&P 500 Index component stock is assigned to one, and only one, of eleven major sectors. This is a snapshot of the Intermediate-Term and Long-Term Trend Model signal status for those sectors.
STOCKS
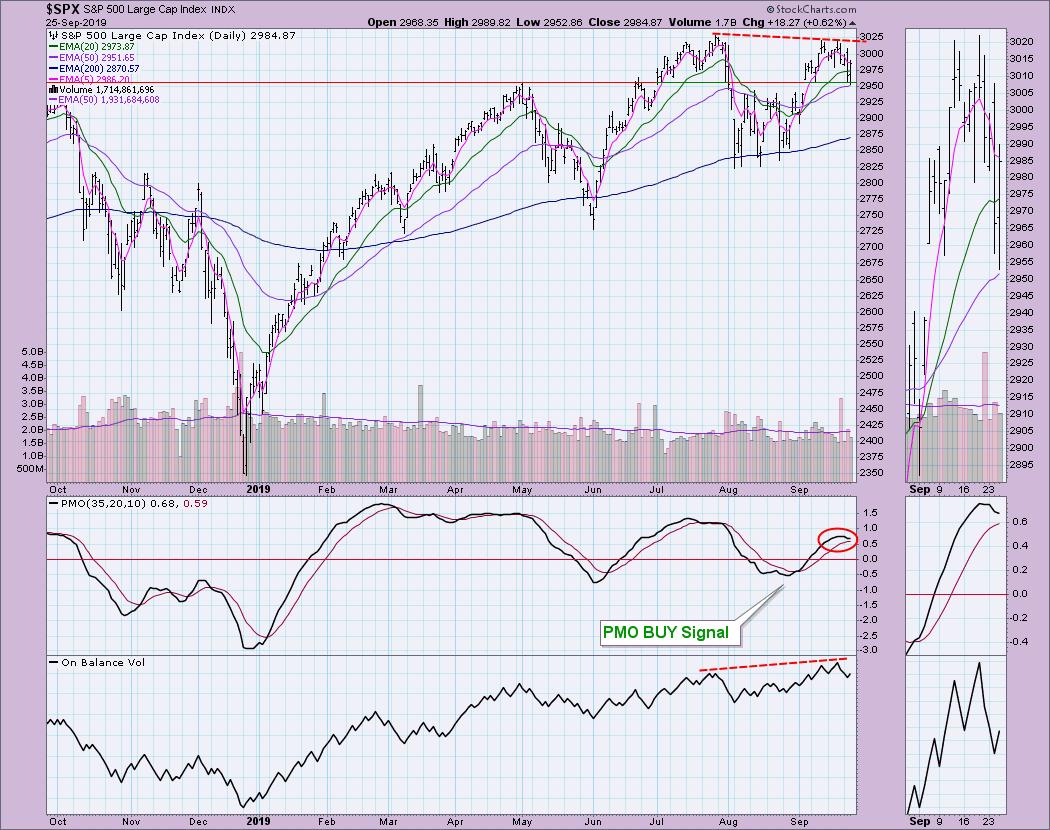
IT Trend Model: BUY as of 9/4/2019
LT Trend Model: BUY (SPY) as of 2/26/2019
SPX Daily Chart: Unlike the NDX, support here is holding (albeit barely) along the May top and above the 50-EMA. The PMO is decelerating its decline, but it still appears headed for a negative crossover. The reverse divergence between the OBV and price tops is a problem. It is a "reverse" divergence in that price should follow volume. A higher top on the OBV compared to a lower price top tells you that volume was unable to push price to new all-time highs. That suggests there is internal weakness.
Climactic Market Indicators: We saw a pop in the Net A-D, but the volume A-D wasn't anything special. The VIX traveled below its average for the first time in September, but it hasn't penetrated the lower Bollinger Band. It did close near its lows (remember that my scale is inverted), setting up what could be a move back up above the average. Typically, when the VIX bounces toward the upper band, price rallies with it. Given the interesting pop in breadth, this could be a buying initiation, which would mean higher prices into the end of the week.
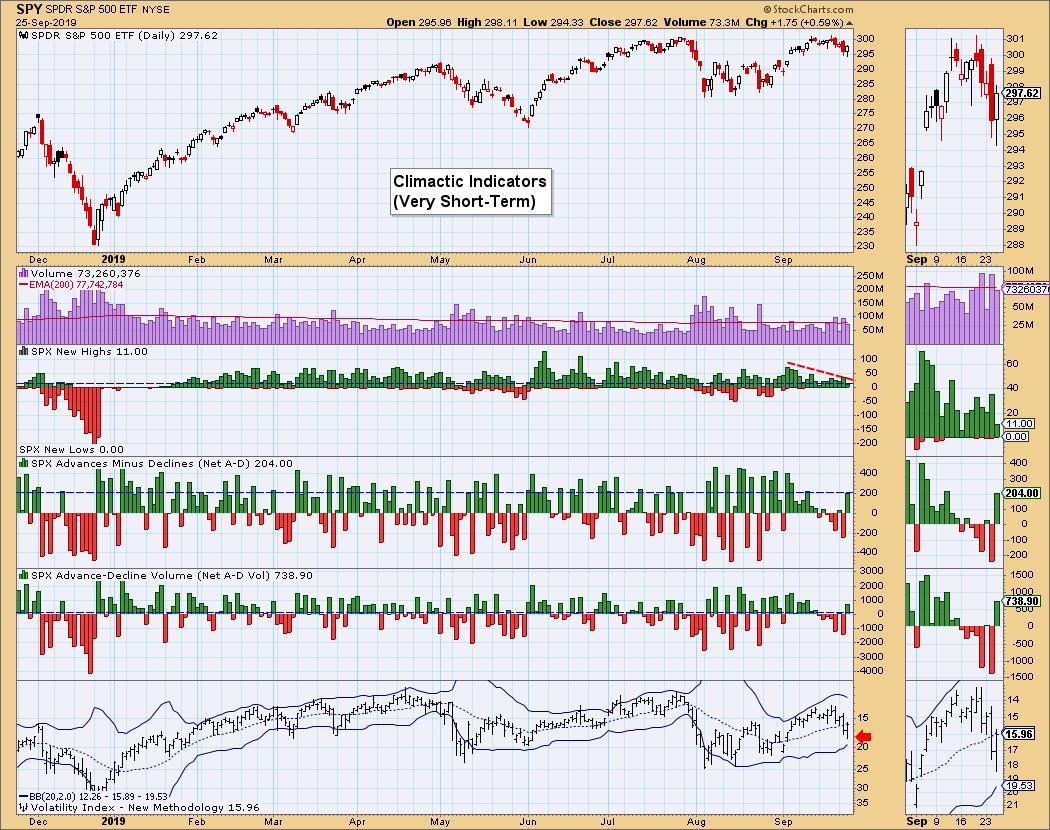
Short-Term Market Indicators: Unfortunately, overall in the short- and intermediate-term, indicators are bearish. The STOs did tick higher today, but, given the 0.62% move in price, I would've expected to see more than a small blip.
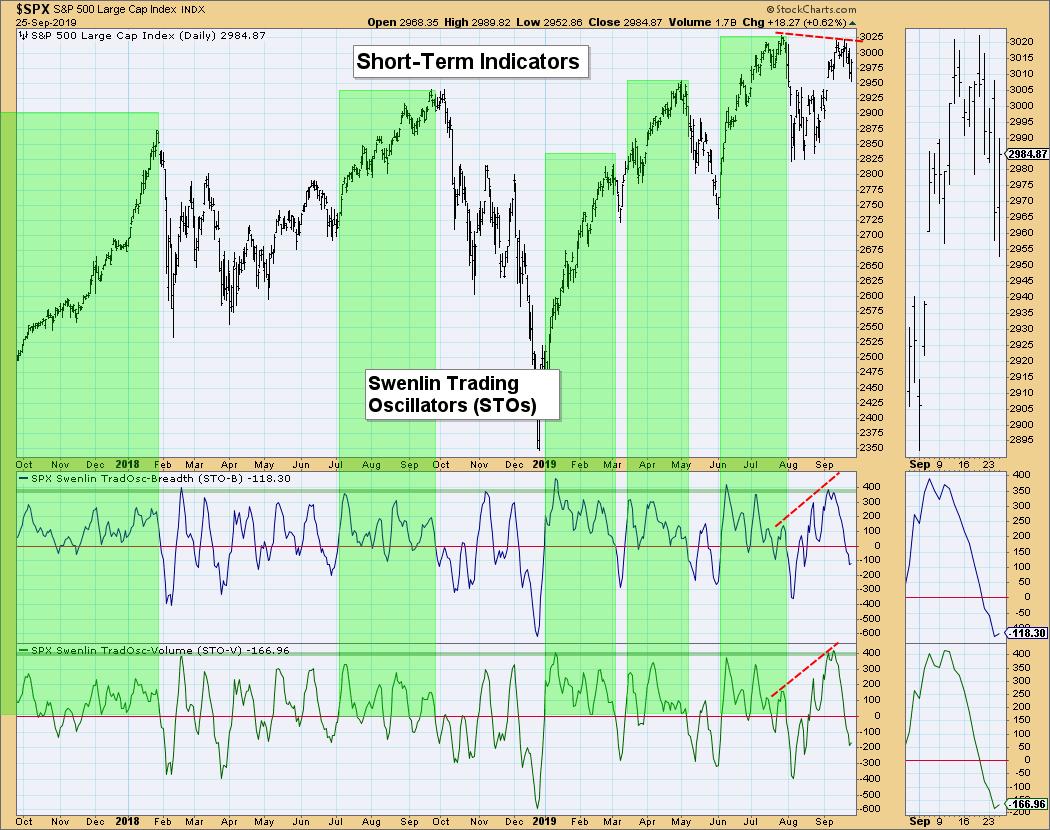
Intermediate-Term Market Indicators: The IT indicators have continued to fall since their negative crossovers. There is plenty of downside available to them to accommodate more price decline before they become oversold. The reverse divergences are also bearish.
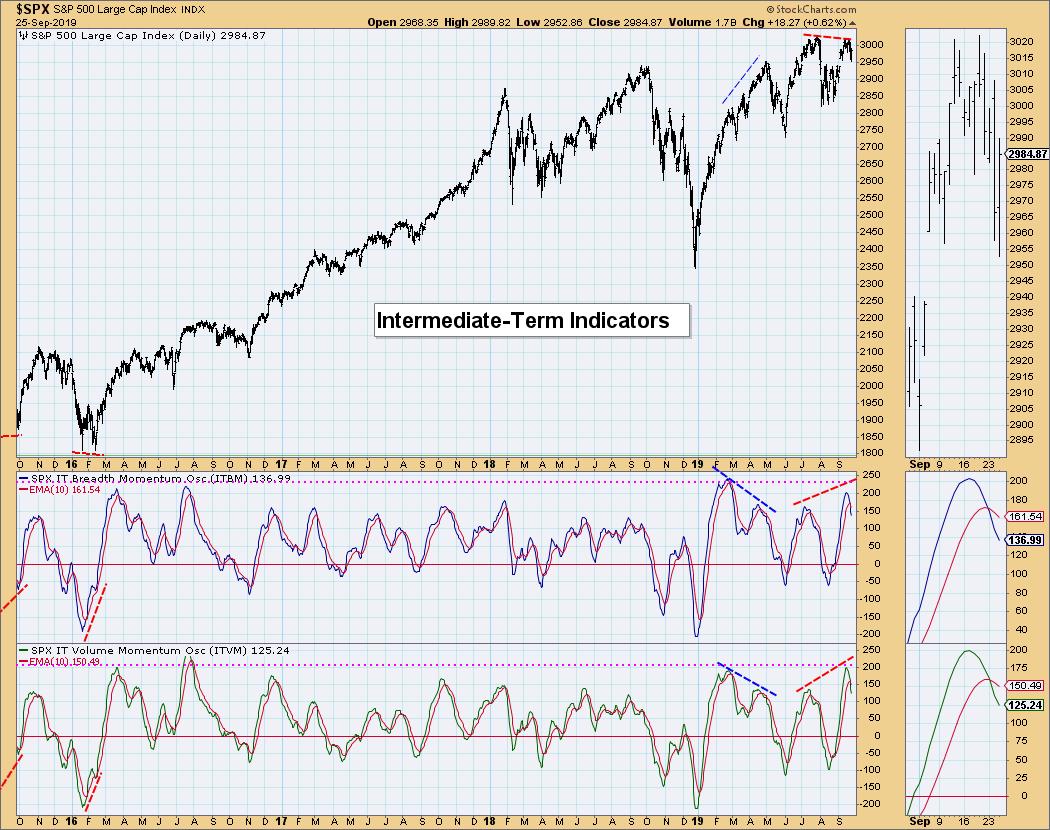
Conclusion: The VIX and breadth tell me we could see a little follow-through on today's rally going into the end of the week. However, our other indicators simply don't give me confidence in the market overall. Additionally, seeing a very aggressive area of the market (technology) underperforming and giving us a PMO SELL signal doesn't inspire confidence that all-time highs are around the corner.
DOLLAR (UUP)
IT Trend Model: BUY as of 2/7/2019
LT Trend Model: BUY as of 5/25/2018
UUP Daily Chart: This rising wedge is getting long in the tooth, but I believe it is still valid. The expectation is a breakdown below the rising bottoms trend line. The PMO is very indecisive (as with price!). The OBV is showing rising bottoms, which is generally positive, but even that is debatable. I'm still expecting a breakdown that will execute this chart pattern.
GOLD
IT Trend Model: BUY as of 6/3/2019
LT Trend Model: BUY as of 1/8/2019
GOLD Daily Chart: Today's lower intraday high formed the right shoulder of what could be a bearish head-and-shoulders reversal pattern. It has a down-sloping neckline, so it would take a breakdown lower than the September bottom to execute it. If it were to execute, the height of the pattern added to the bottom of the neckline would imply a minimum downside target around 1380, which does coincide nicely with the July lows. The PMO has topped below the signal line, which is also bearish. I do note that the correlation with the Dollar is non-existent right now, so both could fall at that same time.
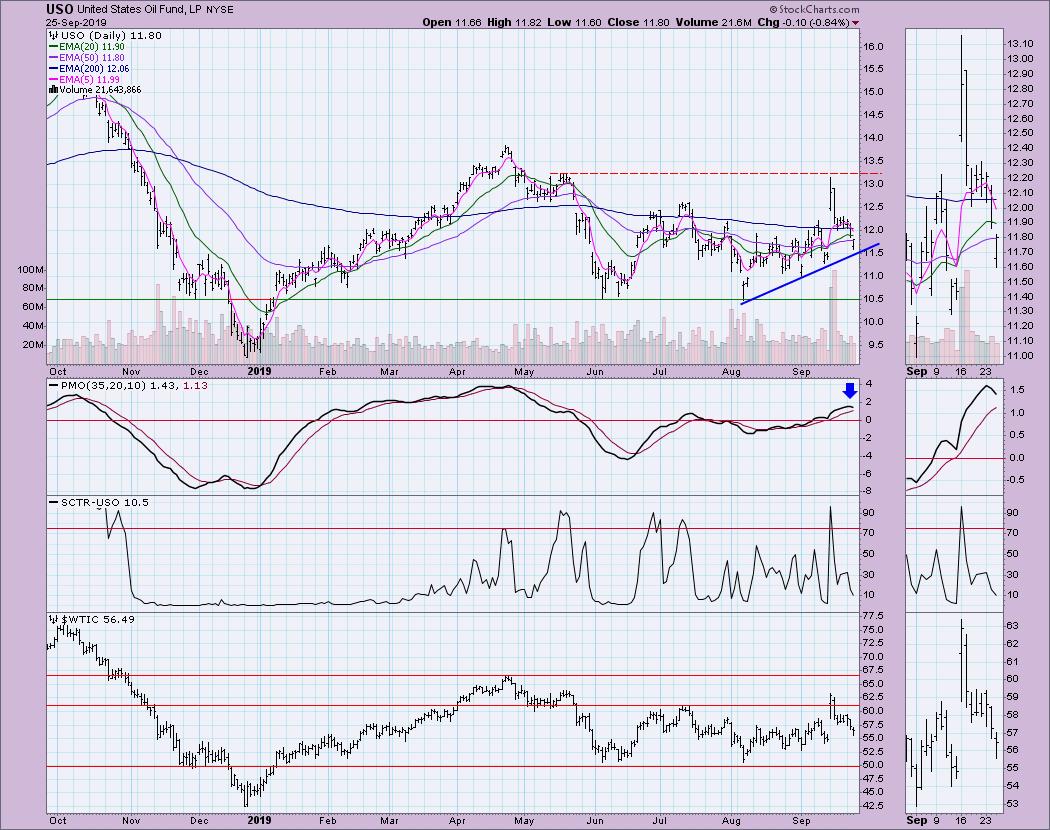
CRUDE OIL (USO)
IT Trend Model: BUY as of 9/16/2019
LT Trend Model: SELL as of 6/4/2019
USO Daily Chart: Oil remains on a rising trend line despite today's big decline. It looks like it could be another island reversal, like we saw on each of the other touches on this rising bottoms trend line. However, the PMO has turned down and the SCTR is tanking (no pun intended). If we don't get the reversal and instead see a breakdown, support is around $10.50.
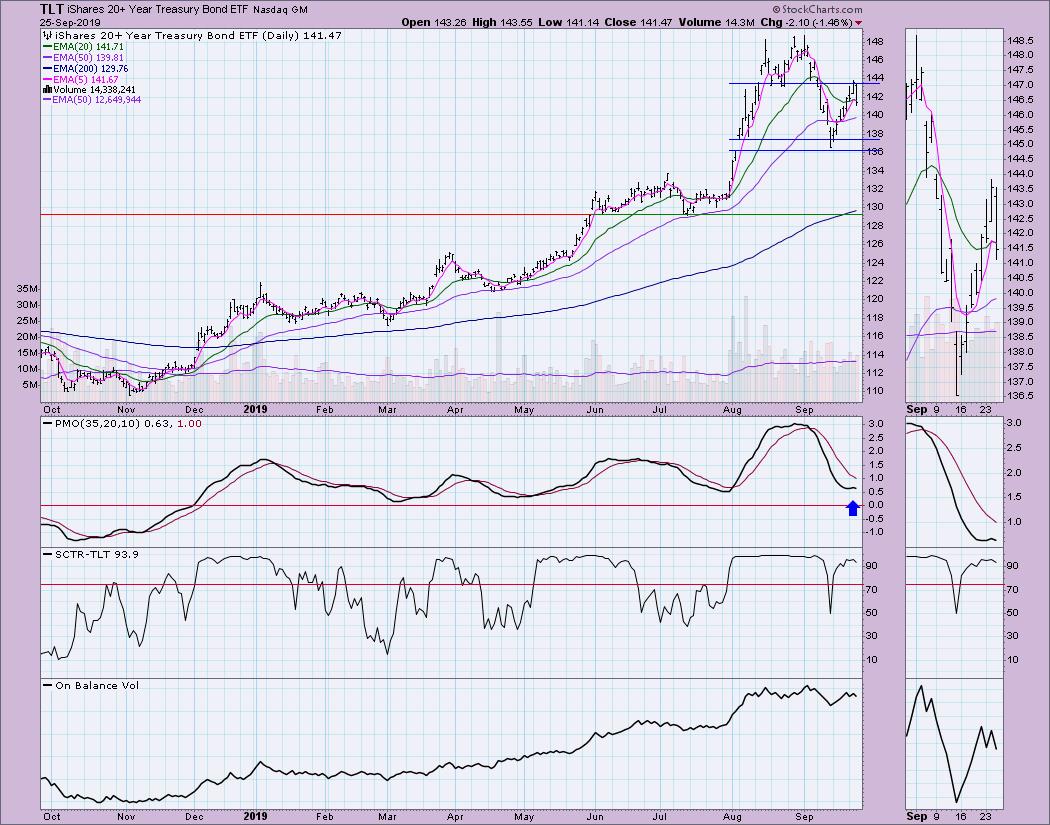
BONDS (TLT)
IT Trend Model: BUY as of 12/6/2018
LT Trend Model: BUY as of 1/2/2019
TLT Daily Chart: Well, price hit resistance and then quickly backed away. The PMO has topped below its signal line and we are seeing declining tops on the OBV. The one ray of sunshine would be the 93.9 SCTR rank. We could see the 50-EMA hold as support, but I'm inclined to believe $136 will be the true support. However, I could give you support at $137 or $138 based on the August gap.
Technical Analysis is a windsock, not a crystal ball.
Happy Charting! - Erin
Email: erinh@stockcharts.com
**Don't miss any of the DecisionPoint commentaries! Go to the "Notify Me" box toward the end of this blog page to be notified as soon as they are published.**
NOTE: The signal status reported herein is based upon mechanical trading model signals, specifically, the DecisionPoint Trend Model. They define the implied bias of the price index based upon moving average relationships, but they do not necessarily call for a specific action. They are information flags that should prompt chart review. Further, they do not call for continuous buying or selling during the life of the signal. For example, a BUY signal will probably (but not necessarily) return the best results if action is taken soon after the signal is generated. Additional opportunities for buying may be found as price zigzags higher, but the trader must look for optimum entry points. Conversely, exit points to preserve gains (or minimize losses) may be evident before the model mechanically closes the signal.
Helpful DecisionPoint Links:
DecisionPoint Shared ChartList and DecisionPoint Chart Gallery
Price Momentum Oscillator (PMO)
Swenlin Trading Oscillators (STO-B and STO-V)


