
When going through my Diamond scans, I realized that the bearish scan was searching on a larger domain than the bullish scan, so I adjusted it. But the bearish scan is still showing many more results. Diamond PMO Scan (bullish) versus the Diamond Dogs PMO Scan (bearish) showed an increase in bullish stocks, 23 --> 28, alongside an increase from 74 --> 90 bearish stocks. I don't like my odds on picking a growth stock, so for you, dear readers, I sifted through all 90 stocks to find you the following five shorting opportunities. I prefer not to short, but I know many of the DecisionPoint Faithful do.
Welcome to the "DecisionPoint Daily Diamonds", a newsletter in which we highlight five "diamonds in the rough" taken from the results of one of my DecisionPoint scans. Remember, these are not recommendations to buy or sell, but simply stocks that I found interesting and the reasons why. The objective is to save you the work of the initial, tedious culling process, but you need to apply your own analysis to see if these stocks pique your interest. There are no guaranteed winners here.
Current Market Outlook:
Market Trend: DP Trend Models are currently on BUY signals.
Market Condition: The PMO is topping on most of the major market indexes. This is occurring while the price on SPX sits on important support. Overall, I still see overbought conditions.
Market Environment: It is important to consider the "odds" for success. Here are the current percentages on the Silver and Golden Cross Indexes. Both indexes declined for the first time since the beginning of the month.
- Silver Cross Index: 69.4% SPX ITTM Buy Signals
- Golden Cross Index: 65.6% SPX LTTM Buy Signals
Be sure to read Carl's Weekly Wrap and the DP Alert Mid-Week for more comprehensive coverage of the overall market including Dollar, Gold, Oil and Bonds.
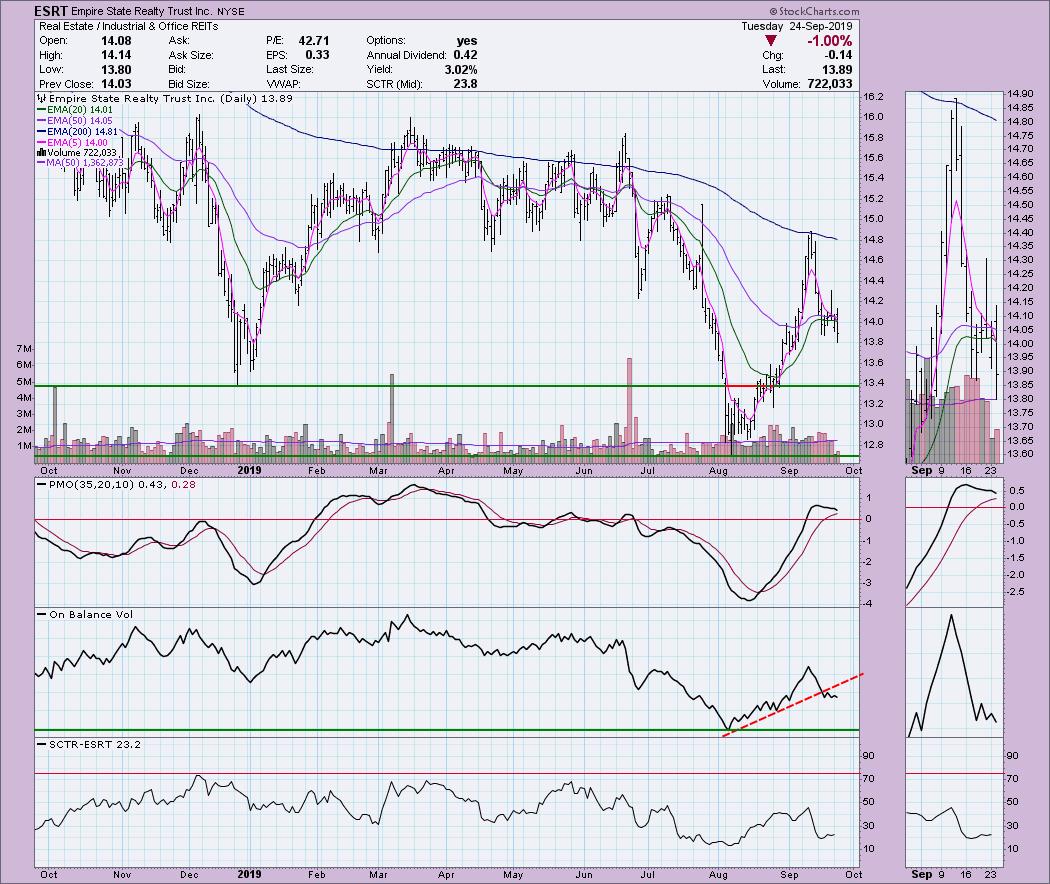
Empire State Realty Trust Inc (ESRT) - Earnings: 10/29 - 11/4
The best thing about this short is that there is no support until around $13.40. Today, price nearly closed below last week's intraday lows; it is now forming a lower low. Notice that the OBV has broken a rising trend. It has room for more distribution before it reaches the level from the August low.
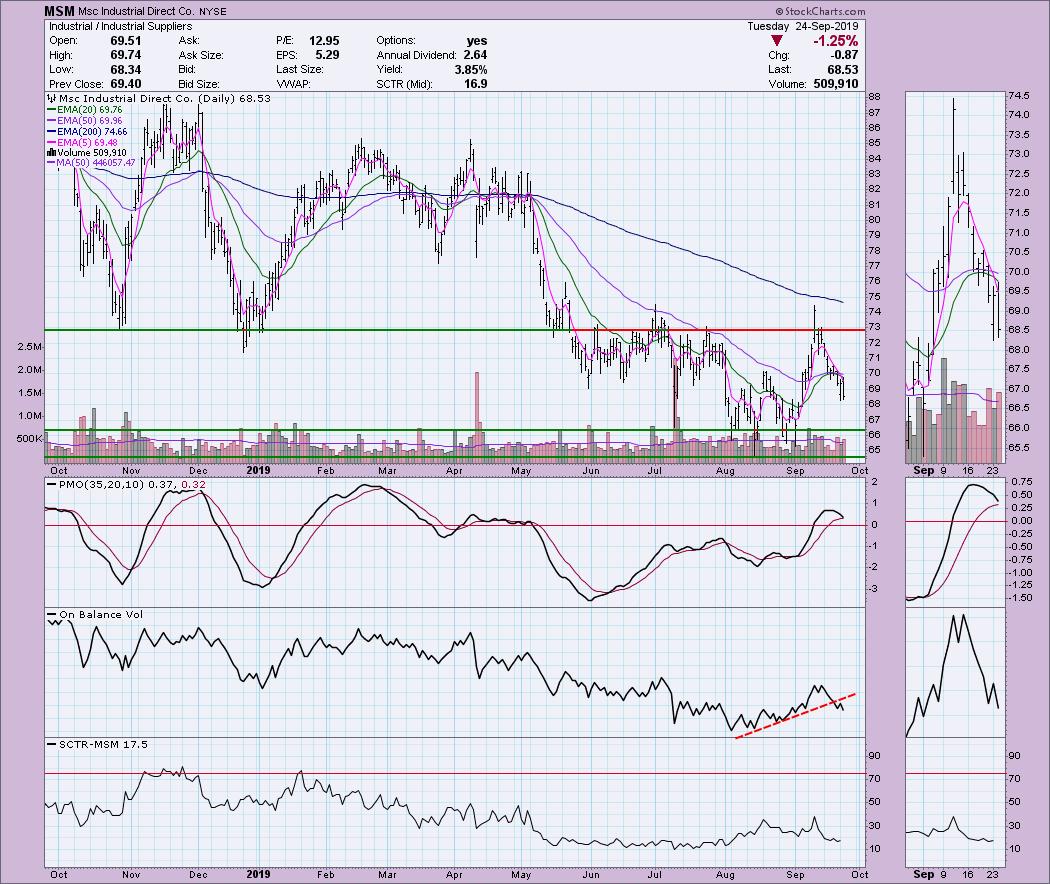
Msc Industrial Direct Co (MSM) - Earnings: 10/24
There are two support levels to watch on this short - $66.50 and $64.50. Price is likely headed to test both levels. The PMO looks about as negative as it can without a SELL signal. That SELL signal is imminent. The OBV is acting like the OBV on ESRT in the chart above. There is room for more distribution.
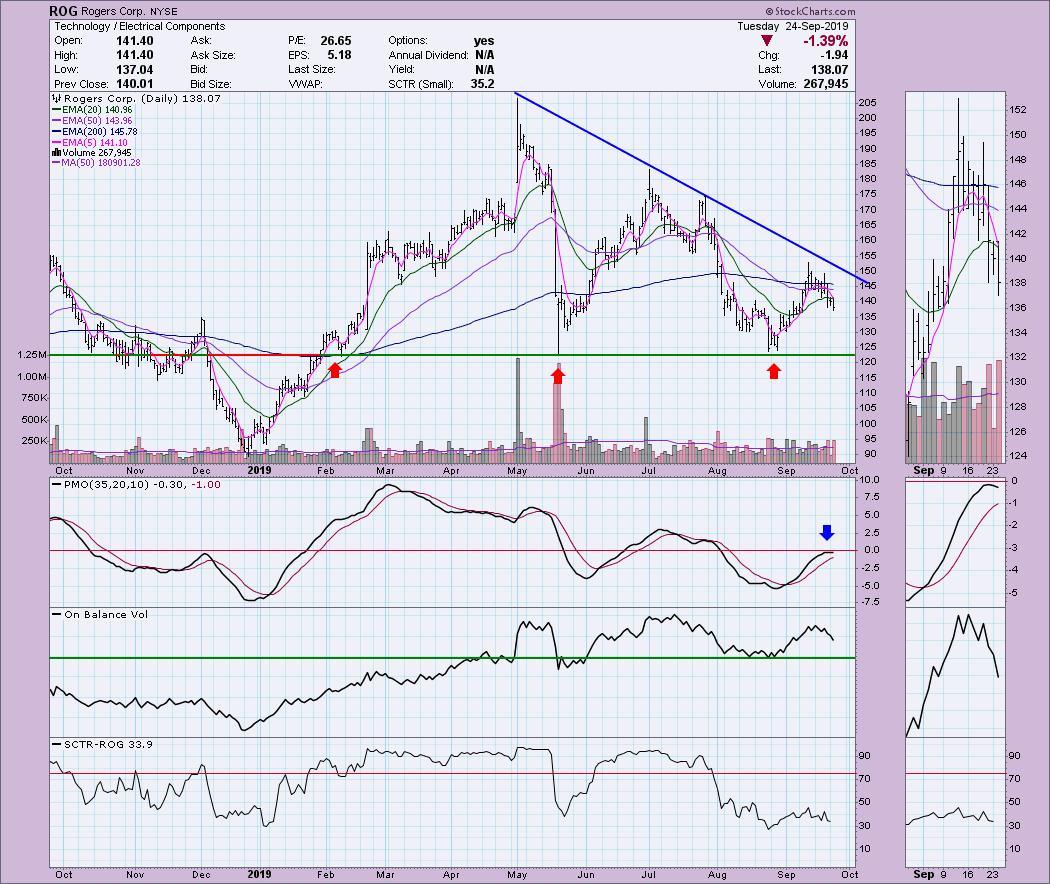
Rogers Corp (ROG) - Earnings: 10/30 - 11/4
One of the signs of price weakness that I look for is the inability to test a trend line. In this case, we saw three previous touches on the declining tops trend line. This last top was unable to reach that level. The PMO is topping below the zero line and the OBV can move much lower.
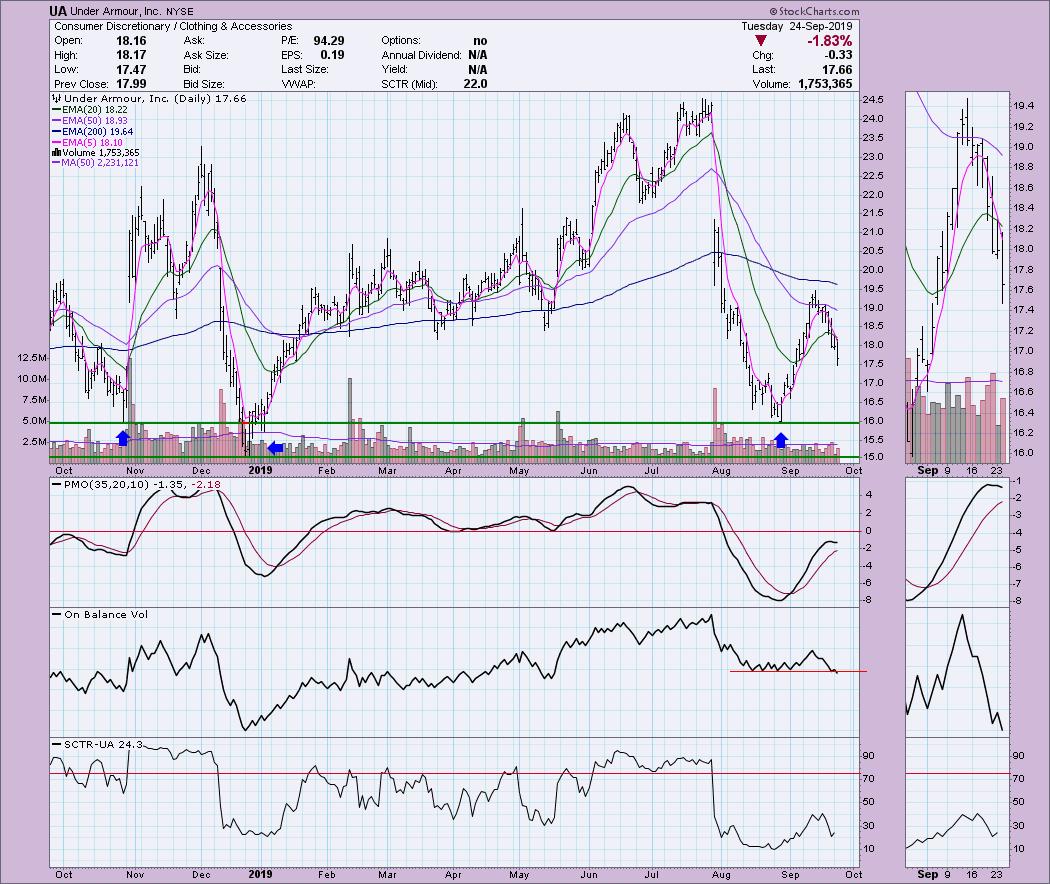
Under Armour Inc (UA) - Earnings: 10/31
Like ESRT, I like that support is well below the current price. With a lower priced stock like UA, a drop to $16.00 would be great, but longer-term support is at $15.00. There is lots of downside potential here. The OBV is dropping below its own support levels, which suggests internal weakness. A PMO top below the zero line is also a good shorting signal.
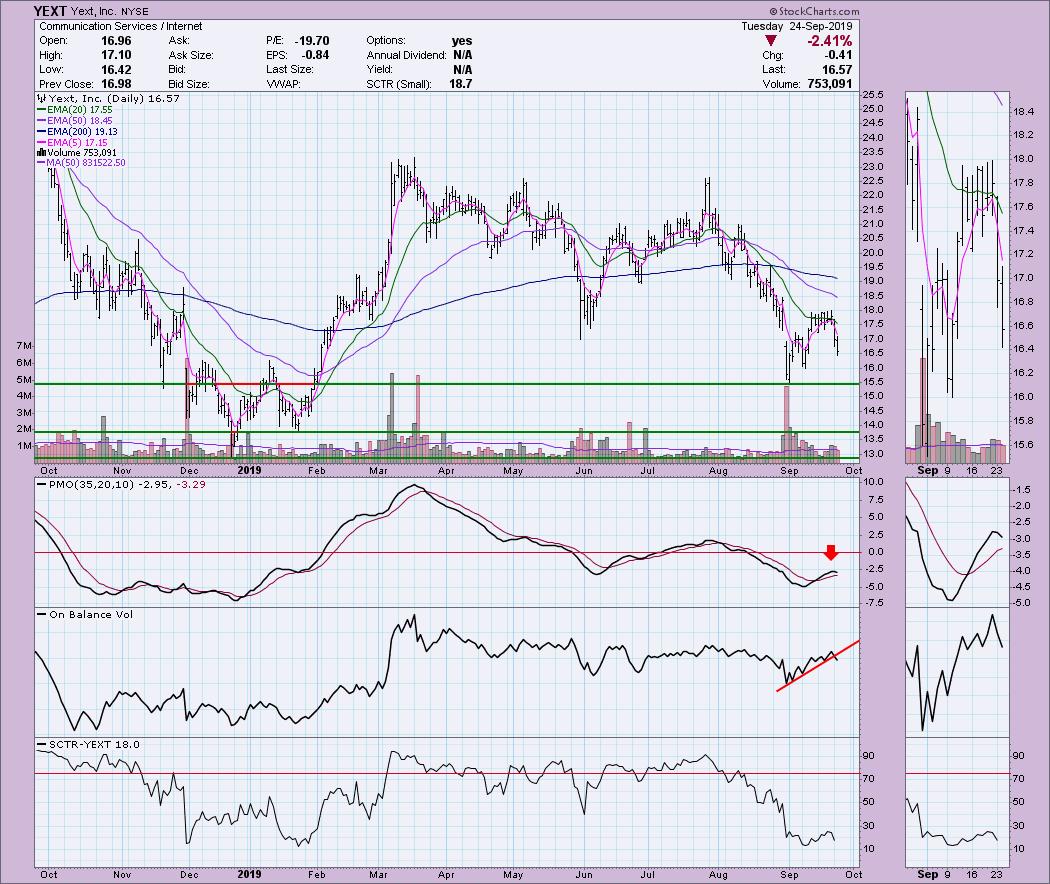
Yext Inc (YEXT) - Earnings: Last reported 8/29/19
The PMO topped well below the zero line and the OBV has broken down. The next level of very short-term support is around $16.00, but I suspect it will test $15.50. If that fails, there are a few other target levels for a short.
Full Disclosure: I am not looking to trade long right now; I'd prefer to watch and wait since I don't like shorting. That said, I'm beginning to consider shorting given the weakness in the market overall. I'll wait until I see if the SPX can hold current support. I'm currently about 60% in cash.
Watch the latest episode of DecisionPoint with Carl & Erin Swenlin LIVE on Mondays 5:00p EST or on the StockCharts TV YouTube channel here!
Technical Analysis is a windsock, not a crystal ball.
Happy Charting!
- Erin
erinh@stockcharts.com
NOTE: The stocks reported herein are from mechanical trading model scans that are based upon moving average relationships, momentum and volume. DecisionPoint analysis is then applied to get five selections from the scans. The selections given should prompt readers to do a chart review using their own analysis process. This letter is not a call for a specific action to buy, sell or short any of the stocks provided. There are NO sure things or guaranteed returns on the daily selection of "diamonds in the rough".
Helpful DecisionPoint Links:
DecisionPoint Shared ChartList and DecisionPoint Chart Gallery
Price Momentum Oscillator (PMO)
Swenlin Trading Oscillators (STO-B and STO-V)
**Don't miss DecisionPoint Commentary! Add your email below to be notified of new updates"**


