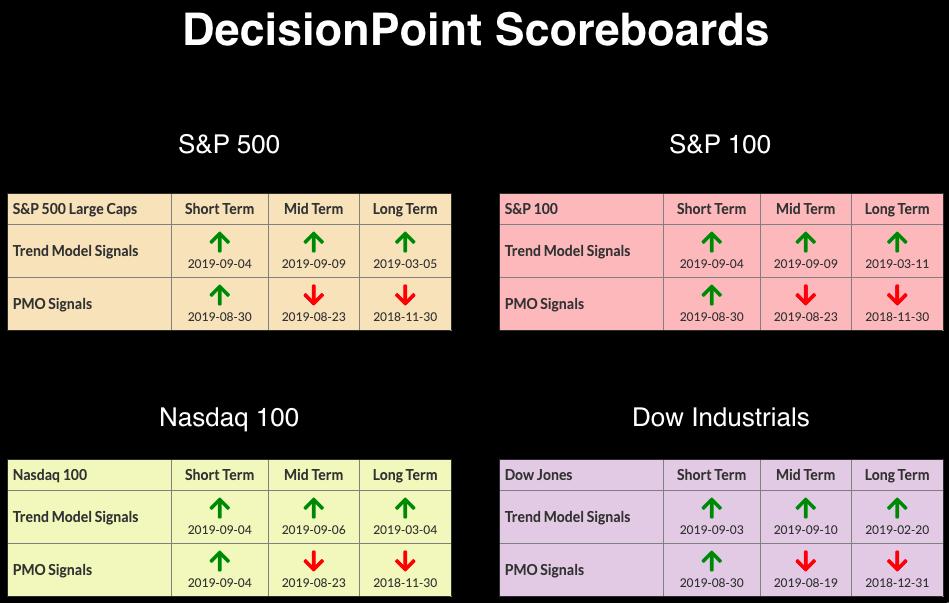
 The DecisionPoint indicators help give us some insight into the condition of the market. The present short-term indicator deterioration is bearish, and the very overbought readings on our ITBM and ITVM suggest lower prices ahead. Currently, the trend of the markets is bullish, with all three of our trend models on BUY signals on all four large-cap scoreboards. As we know, moving averages can sometimes lag, so I wouldn't get too comfortable.
The DecisionPoint Alert presents a mid-week assessment of the trend and condition of the stock market (S&P 500), the U.S. Dollar, Gold, Crude Oil and Bonds.
Watch the latest episode of DecisionPoint on StockCharts TV's YouTube channel here!
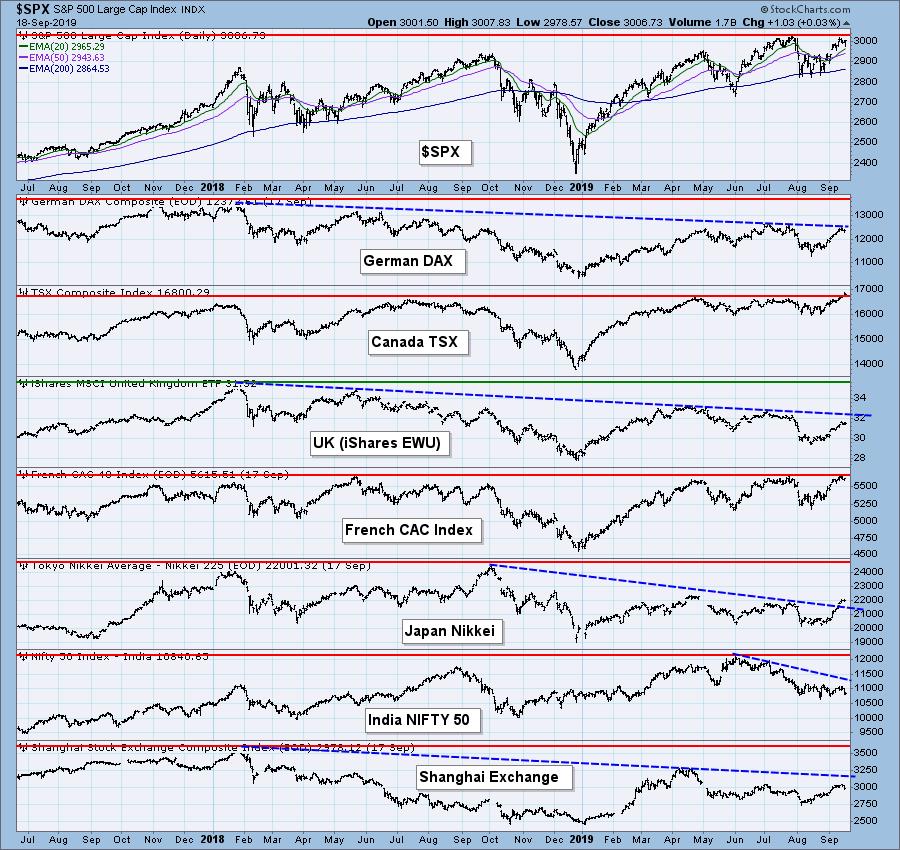
GLOBAL MARKETS
Note that the $TSX has posted new all-time highs, whereas the SPX has not this time around. The CAC ($CAC) is flirting with all-time highs, while the Nikkei ($NIKK) has broken out of its declining trend, suggesting the bear market in Japan may be coming to an end.
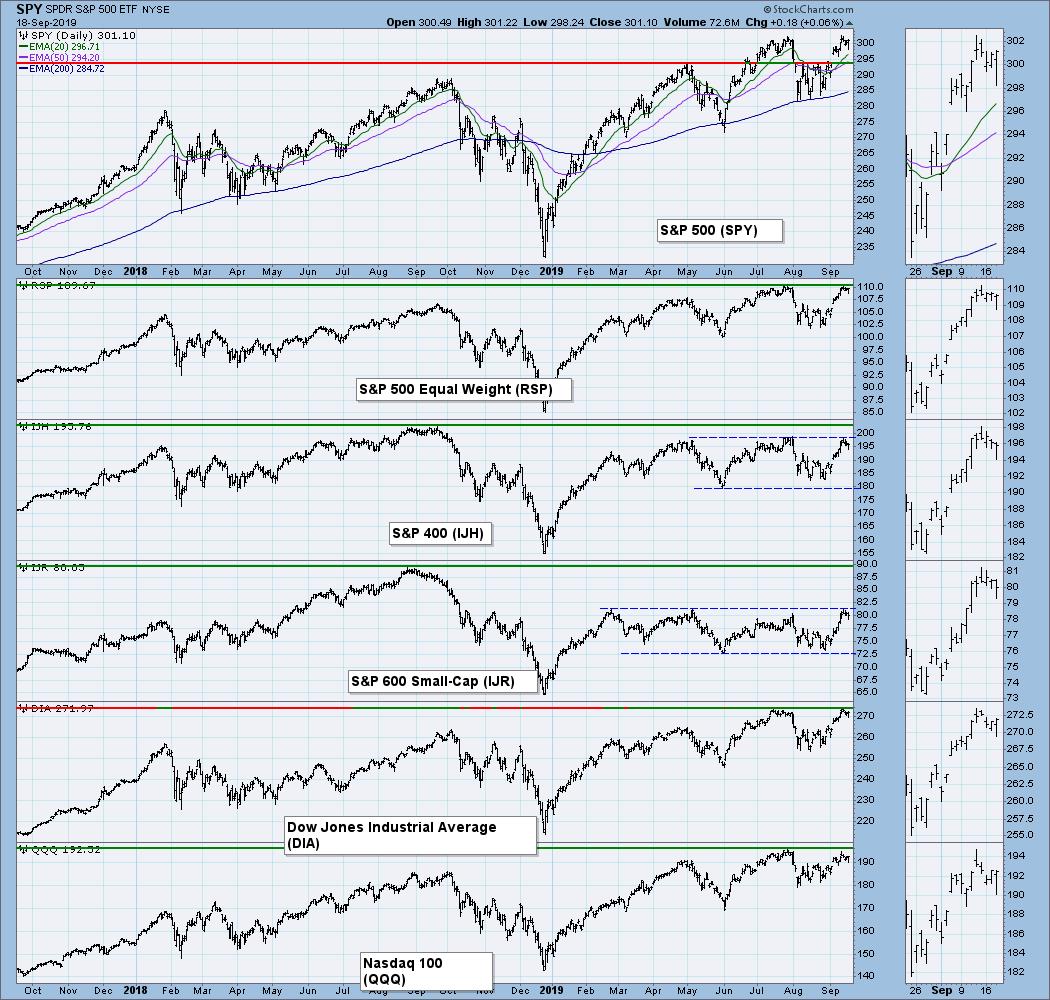
BROAD MARKET INDEXES
The important thing to note on this chart is that as soon as each index reached overhead resistance (all-time highs in some cases), price was immediately turned away.
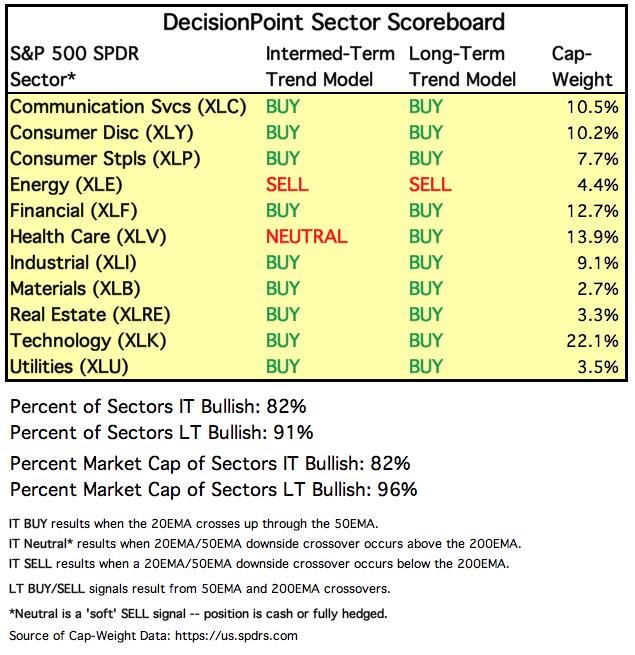
SECTORS
Each S&P 500 Index component stock is assigned to one, and only one, of eleven major sectors. This is a snapshot of the Intermediate-Term and Long-Term Trend Model signal status for those sectors.
STOCKS
IT Trend Model: BUY as of 9/4/2019
LT Trend Model: BUY (SPY) as of 2/26/2019
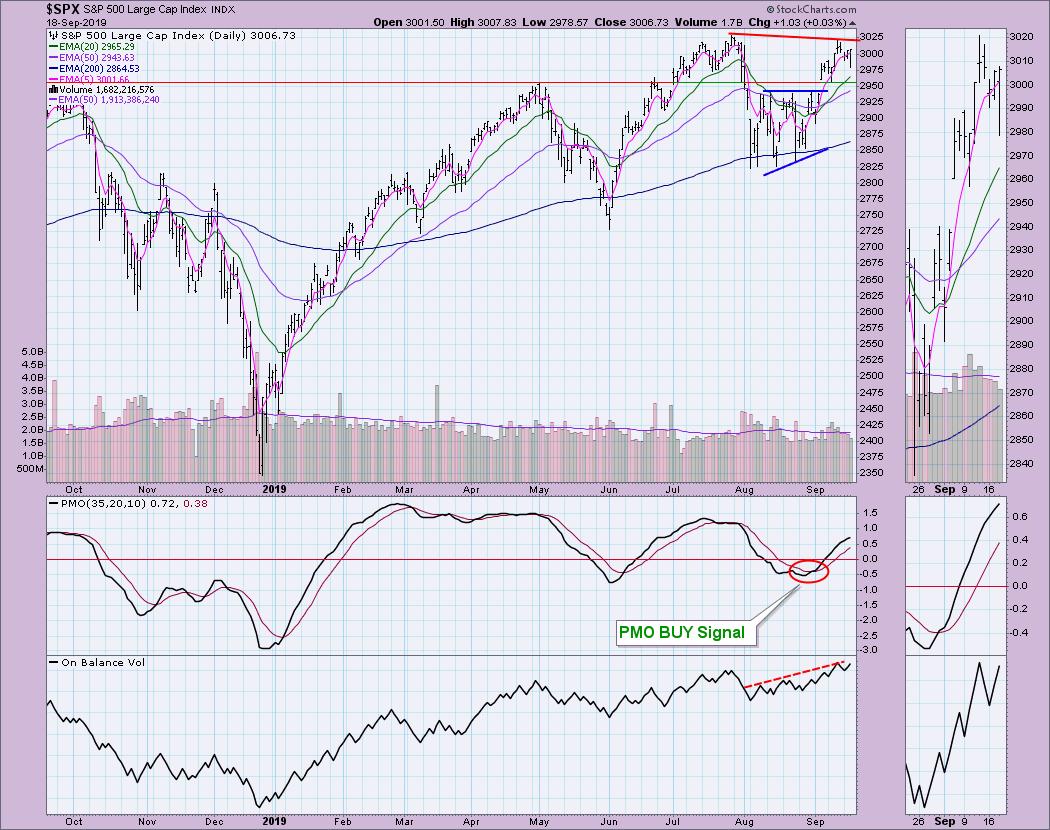
SPX Daily Chart: Price had nearly reached the all-time high - and then abruptly changed direction. The ascending triangle formation suggested a much higher minimum upside target, but the failure to break out from all-time highs tells me the pattern will likely disintegrate, if it hasn't already. A big problem is that, despite higher highs on the OBV, price was unable to make a new higher high. This is a reverse divergence. Price should follow volume; when it doesn't, that's usually a warning sign.
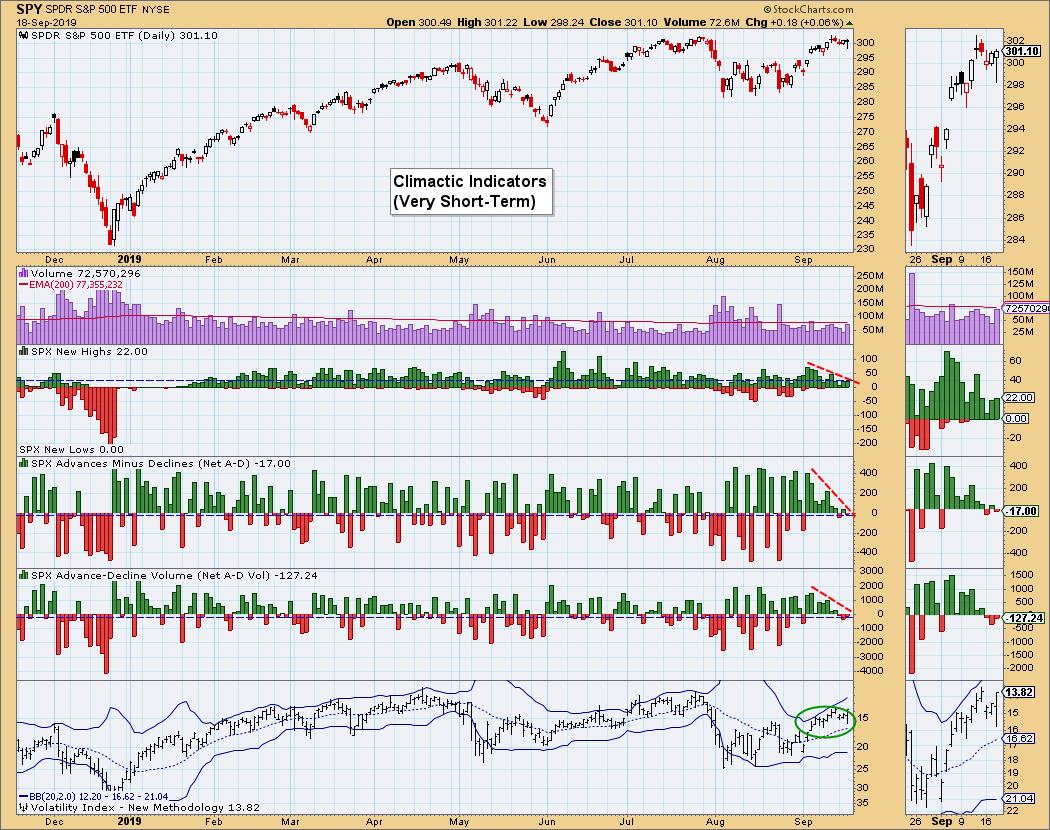
Climactic Market Indicators: We continue to see deterioration in breadth. The one positive I see is that the VIX has been oscillating above its average on the inverse scale. That suggests internal strength in the very short-term. It could make another run to the upper Bollinger Band, which would mean a few days of rally. I could buy that, but, with breadth so anemic, I wouldn't look for much follow-on.
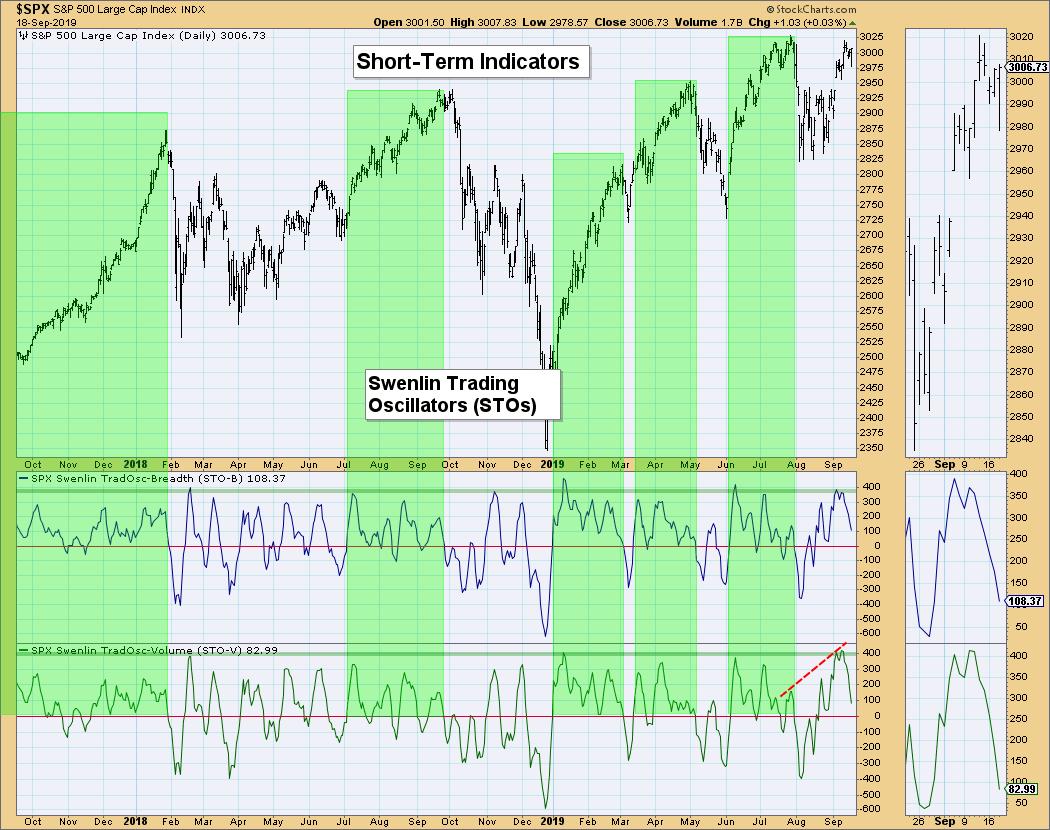
Short-Term Market Indicators: The STOs are in a speedy decline. They have already hit neutral territory and they don't look ready to turn back up. If they do, that would be bullish. Note that, in the green areas, the STOs were oscillating above the zero line. If they break too far below, I would look for that gap to close on the SPX. That would mean a retracement to about 2940. One last note: the STO-V has a reverse divergence with price tops. Again, despite positive volume, price was unable to make new highs.
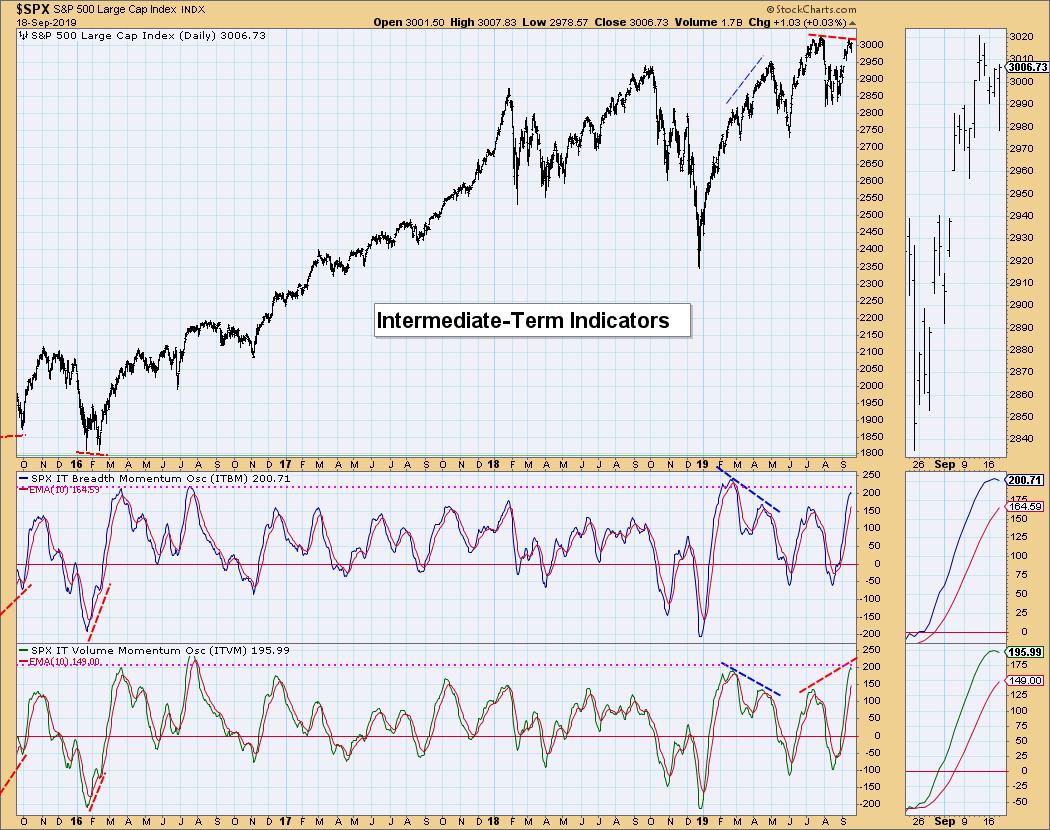
Intermediate-Term Market Indicators: These indicators are highly overbought and have turned lower. This generally means we will see the same for prices. One side note: the ITVM logged a higher high than previously, but price did not push past all-time highs. That is a reverse divergence, just as we saw on the OBV on the SPX daily chart.
Conclusion: All-time highs are so far elusive for the major indexes. It is hard to remain bullish when the major indexes can't make new all-time highs despite volume indicators (OBV, ITVM) logging new highs. Based on the indicators, price should continue lower despite the decline in interest rates.
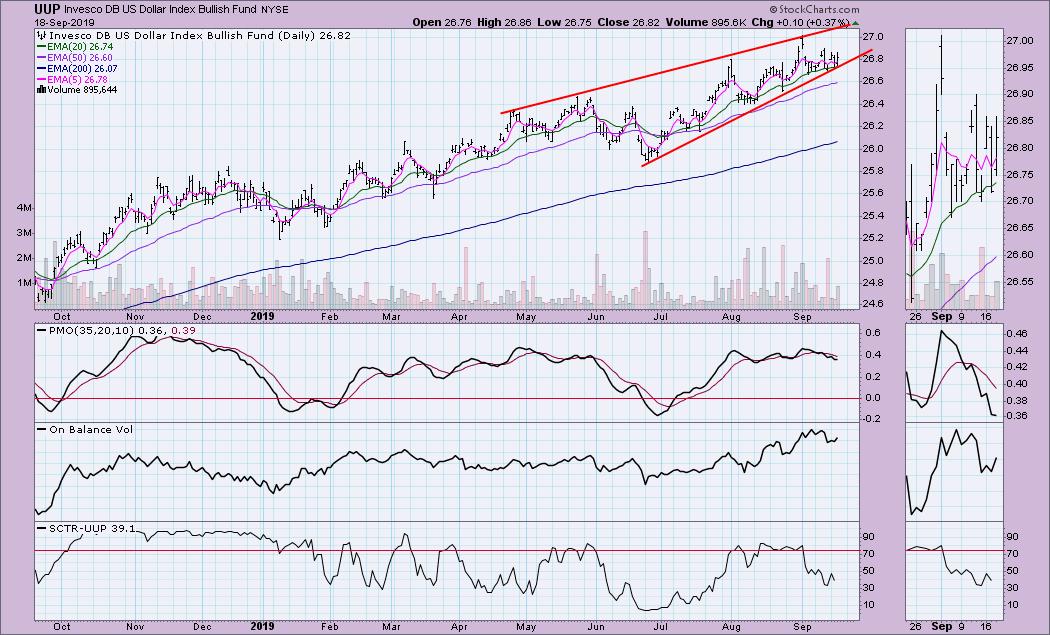
DOLLAR (UUP)
IT Trend Model: BUY as of 2/7/2019
LT Trend Model: BUY as of 5/25/2018
UUP Daily Chart: The Dollar has been traveling in a bearish rising wedge this summer, but it refuses to execute. The PMO is on a SELL signal. The OBV isn't telling us much, but the SCTR shows the relative weakness of UUP. I am still looking for the Dollar to break down here.
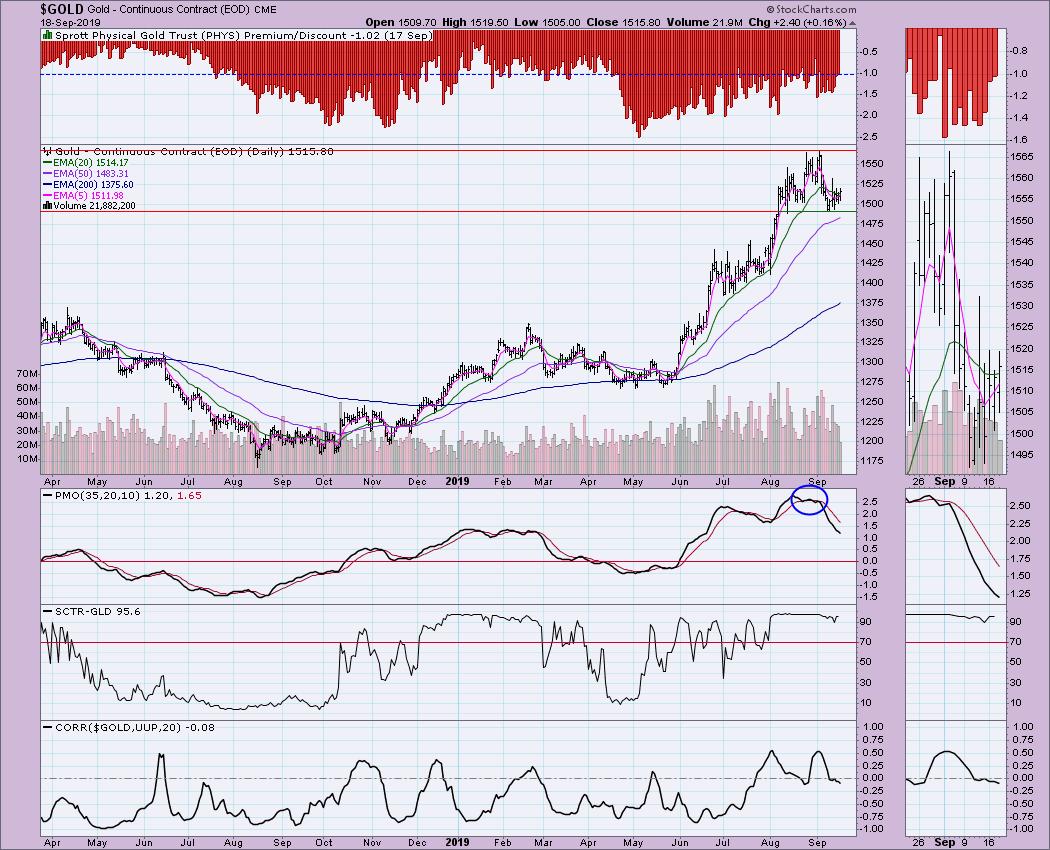
GOLD
IT Trend Model: BUY as of 6/3/2019
LT Trend Model: BUY as of 1/8/2019
GOLD Daily Chart: Gold seems to be holding support at about 1490. My concern here is what looks like the forming of a head-and-shoulders pattern. The SCTR is still strong and, despite a large drop in the PMO, price has been recovering. Discounts are pulling back, suggesting some bullishness regarding Gold. That isn't good for Gold since sentiment is contrarian. These discounts are still high in given the history these past two years. The PMO is decelerating and, if the Dollar breaks down, that should help Gold. Problem is that Gold and the Dollar have decoupled based on the new correlation of about zero. When the correlation is zero, that tells us that they are traveling independent of each other.
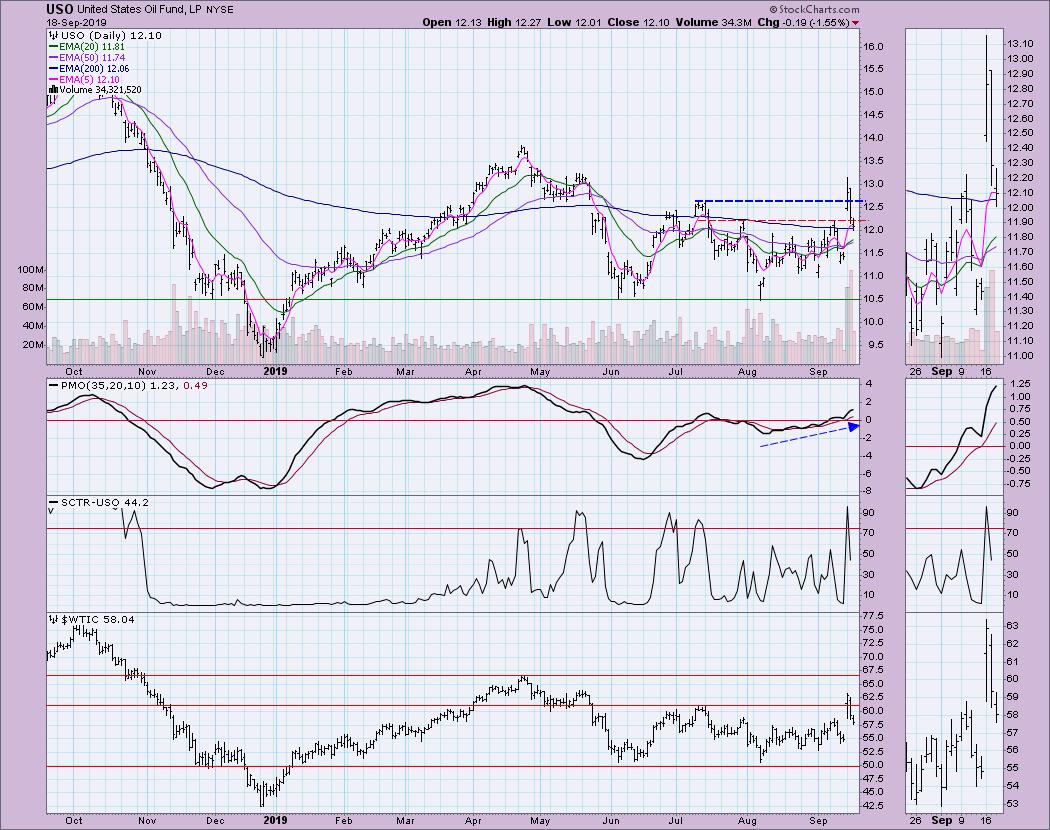
CRUDE OIL (USO)
IT Trend Model: BUY as of 9/16/2019
LT Trend Model: SELL as of 6/4/2019
USO Daily Chart: Oil was on its way to logging a new PMO SELL signal when the fires in Saudi Arabia broke out; afterwards, we saw a near-14% rise on USO. As Carl mentioned during our DecisionPoint show on Monday, the oil production that was knocked out was only 5% of the world's supply. Basically a "blip" on the radar that quickly disappeared. Price began to continue down where it was and seems ready to close the gap formed on Monday. I wouldn't be fooled by the PMO rising right now. The IT Trend Model BUY signal that was triggered when the 20-EMA crossed above the 50-EMA was coincident with the gap up. It's a false positive, in my opinion, given the sharp decline in the SCTR and the heavy downside volume that came yesterday and today.
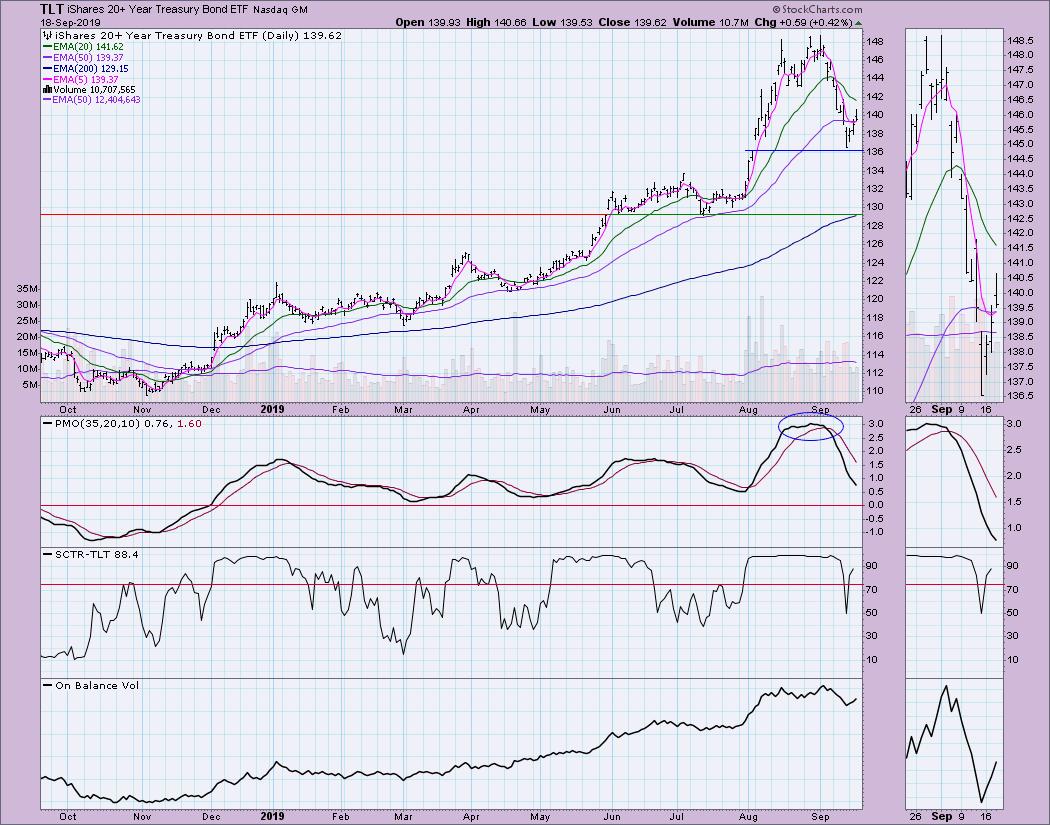
BONDS (TLT)
IT Trend Model: BUY as of 12/6/2018
LT Trend Model: BUY as of 1/2/2019
TLT Daily Chart: TLT almost closed the gap from early August, but then decided to bounce. I believe it is positive to see the gap remain open. I also like that the PMO was able to unwind and move into neutral territory. It is beginning to decelerate. The SCTR is positive and the OBV is still healthy, as the rising trend is intact.
Technical Analysis is a windsock, not a crystal ball.
Happy Charting! - Erin
Email: erinh@stockcharts.com
**Don't miss any of the DecisionPoint commentaries! Go to the "Notify Me" box toward the end of this blog page to be notified as soon as they are published.**
NOTE: The signal status reported herein is based upon mechanical trading model signals, specifically, the DecisionPoint Trend Model. They define the implied bias of the price index based upon moving average relationships, but they do not necessarily call for a specific action. They are information flags that should prompt chart review. Further, they do not call for continuous buying or selling during the life of the signal. For example, a BUY signal will probably (but not necessarily) return the best results if action is taken soon after the signal is generated. Additional opportunities for buying may be found as price zigzags higher, but the trader must look for optimum entry points. Conversely, exit points to preserve gains (or minimize losses) may be evident before the model mechanically closes the signal.
Helpful DecisionPoint Links:
DecisionPoint Shared ChartList and DecisionPoint Chart Gallery
Price Momentum Oscillator (PMO)
Swenlin Trading Oscillators (STO-B and STO-V)


