

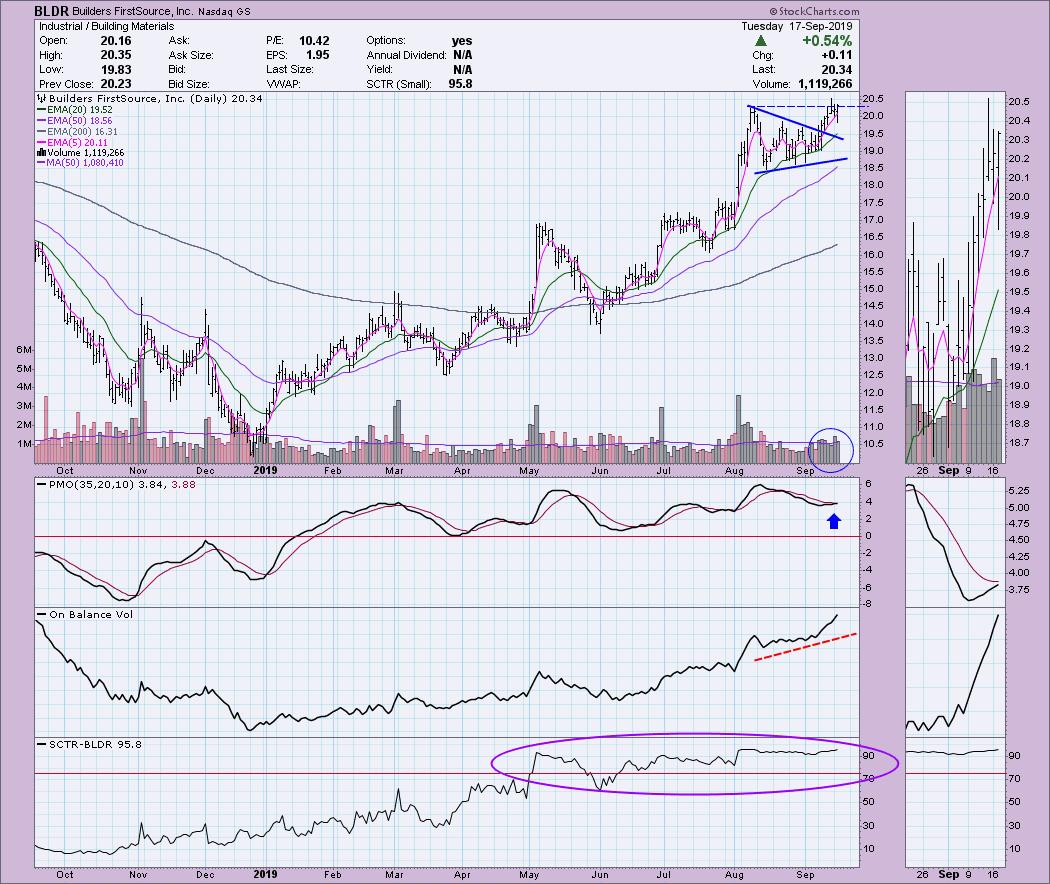
My Price Momentum Oscillator (PMO) scan is still not providing too many choices; the ones that are appearing are in defensive categories. This always makes me suspicious of market conditions. Despite the SPX rising to new all-time highs, I'm only seeing around 8-11 results. I did get two Industrials today, one in the Defense industry group. With uncertain global concerns, I think this industry group could see interest. The second Industrial is from the Home Builders industry group. With lower interest rates, I like this industry group. I do want to clarify that I will always let you know if I buy or am considering buying a particular stock. Please do not move blindly into anything. As my investment account will tell you, not every trade of mine is successful!
Welcome to the "DecisionPoint Daily Diamonds", a newsletter in which we highlight five "diamonds in the rough" taken from the results of one of my DecisionPoint scans. Remember, these are not recommendations to buy or sell, but simply stocks that I found interesting. The objective is to save you the work of the initial, tedious culling process, but you need to apply your own analysis and to see if these stocks pique your interest. There are no guaranteed winners here.
Current Market Outlook:
Market Trend: DP Trend Models are currently on BUY signals.
Market Condition: The market is becoming overbought now that it has reached all-time highs. However, it is important to remember that the market can sustain overbought conditions for some time in a bull market.
Market Environment: It is important to consider the "odds" for success. Here are the current percentages on the Silver and Golden Cross Indexes, which are continuing to rise nicely:
Silver Cross: 66.6% SPX ITTM Buy Signals
Golden Cross: 65.0% SPX LTTM Buy Signals
Of the 8 results I got today from the General PMO scan, I narrowed it down to these five:
Builders FirstSource Inc (BLDR): First off, notice the accumulation of volume and the very healthy OBV. Two days ago, BLDR broke above this year's price high after successfully executing a symmetrical triangle continuation pattern. I believe you could also make a case for the execution of a bull flag if you look at this summer's rally as the flagpole. After breaking out previously, we saw a pullback yesterday, but we also saw a close above that high in August.
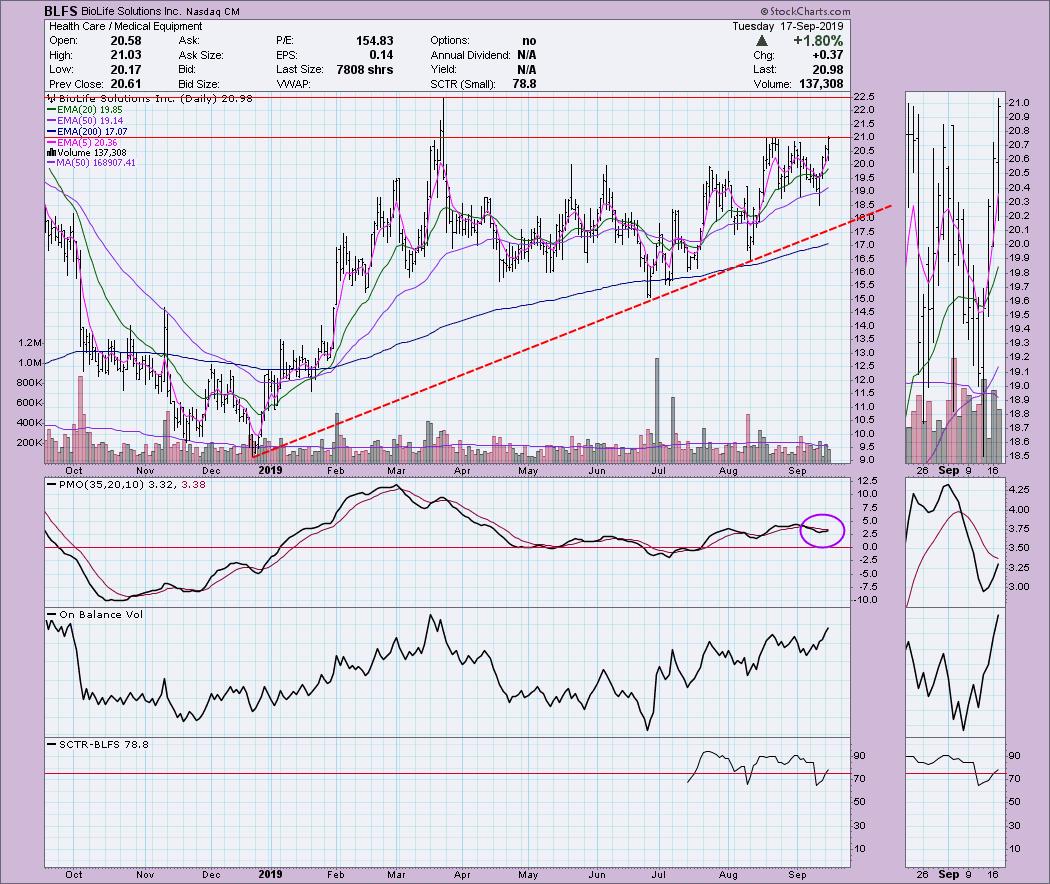
BioLife Solutions Inc (BLFS): We didn't get a significant breakout today, but price did close above the August high. OBV is healthy and rising and the PMO is about ready for a BUY signal. My upside target would be about $22.50, but I suspect it could go higher. I am considering this one for purchase.
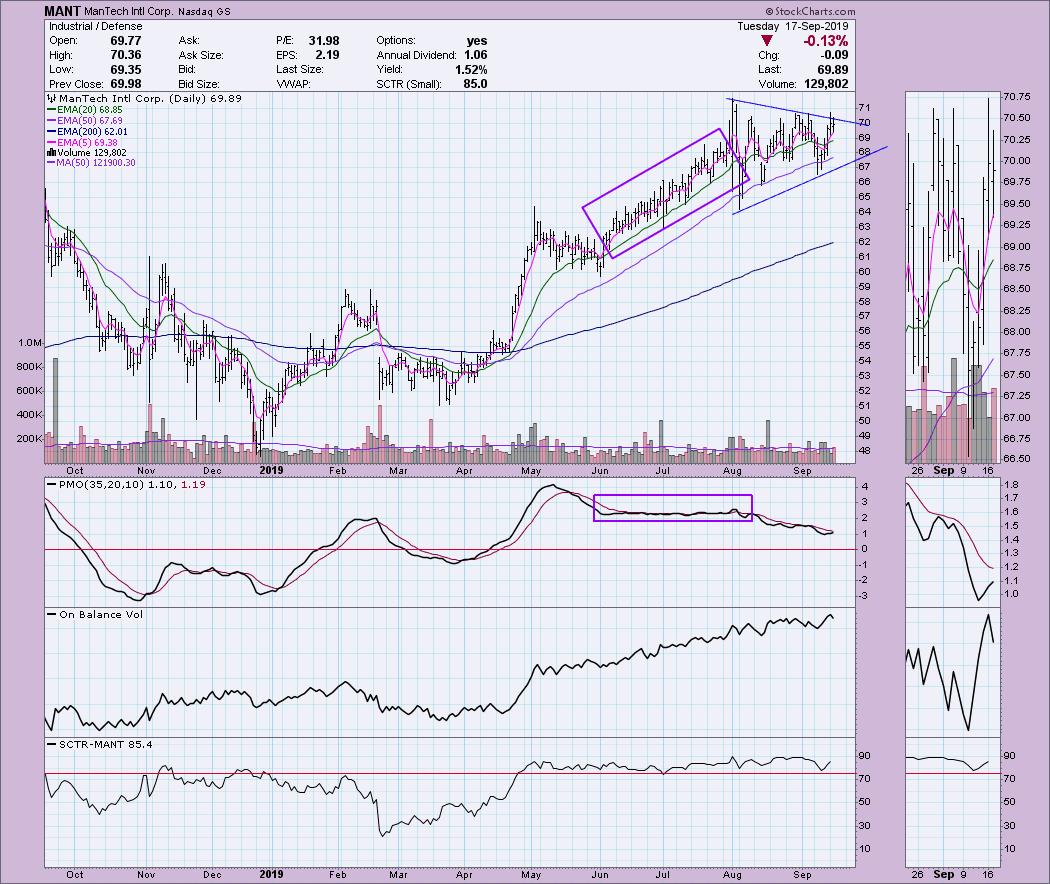
ManTech Intl Corp (MANT): We have a symmetrical triangle, which is a continuation pattern and suggests another leg up rally. I wanted to mention that, in June and July, price was rising but the PMO wasn't. This is because momentum is measures acceleration. If acceleration is about the same, the PMO will flatten as it did in June and July. After some particularly volatile trading within the triangle, MANT is begging to break out here. I am considering this one for purchase.
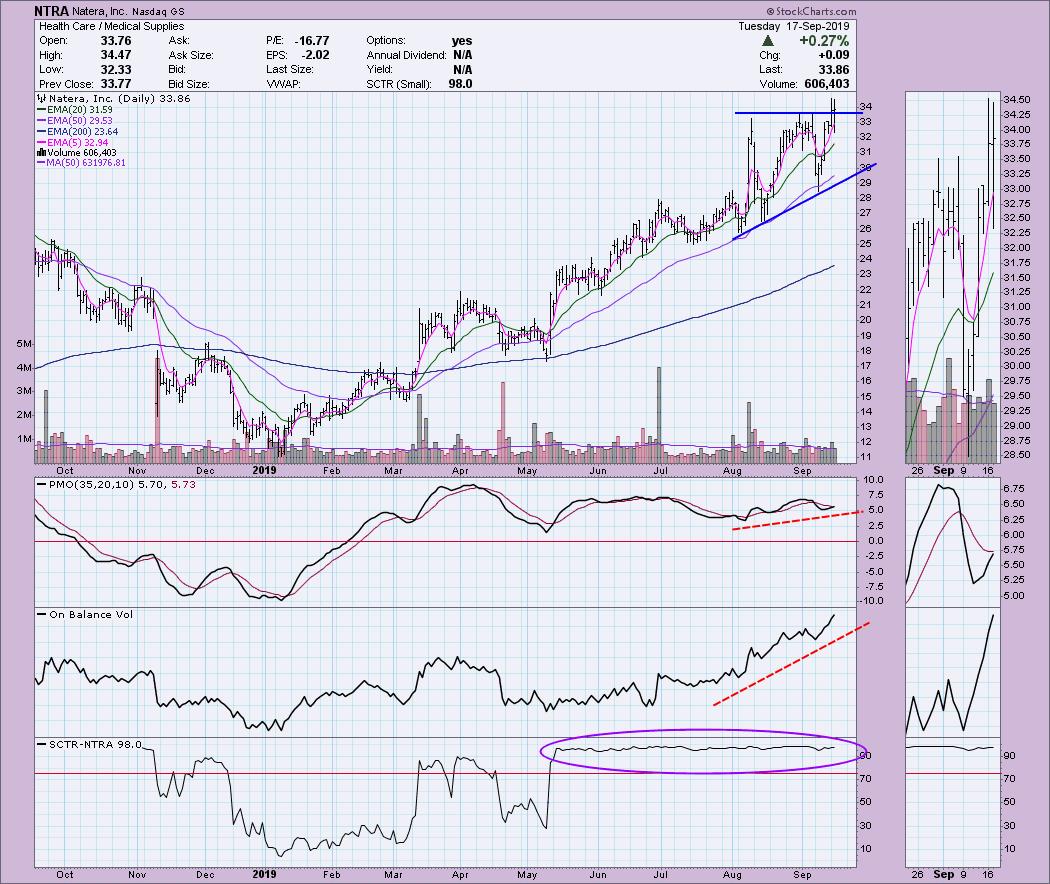
Natera Inc (NTRA): I really like the breakouts we had over the last two trading days. We got a breakout from a bullish ascending triangle. My back-of-the-napkin calculation for minimum upside target is to take the height of the back of the pattern and add it to the breakout point. I will tell you that, in my opinion, that is very optimistic - but not out of the question. The OBV is soaring as this stock continues to be accumulated by investors. The PMO is bit on the overbought side, but there is still room for it to move higher.
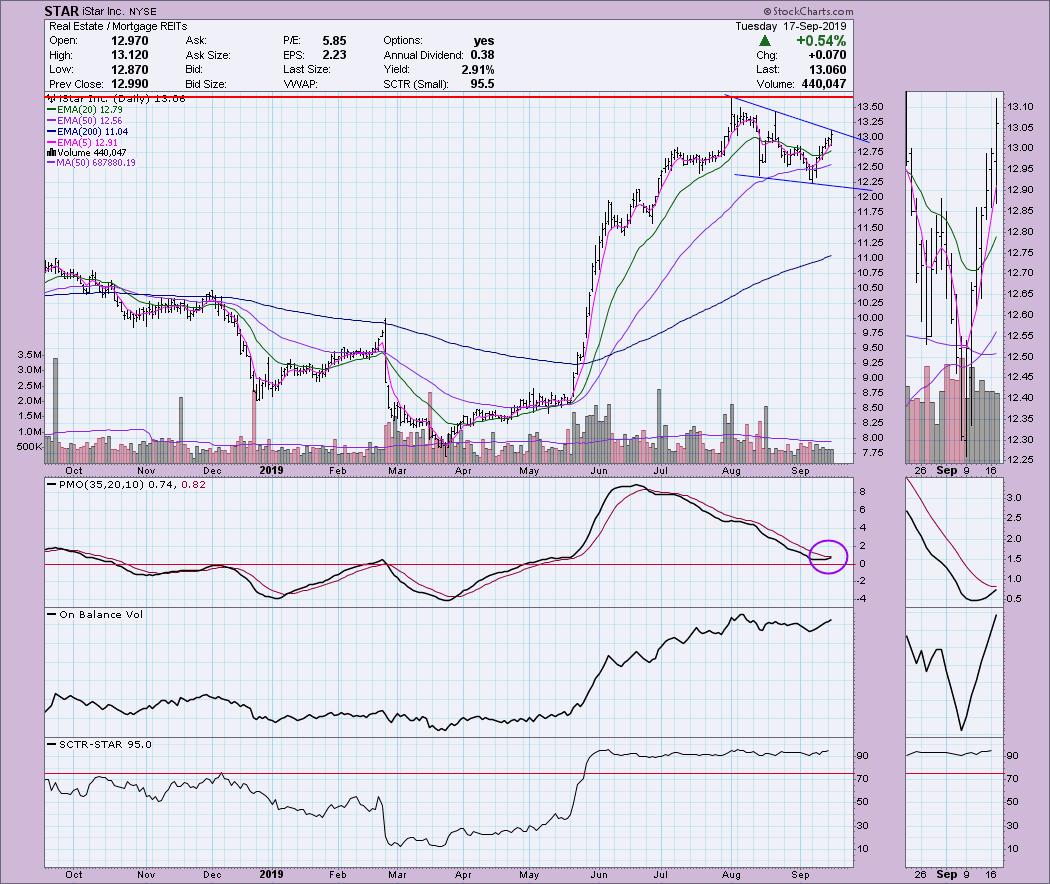
iStar Inc (STAR): This is one I'm putting on my watchlist. It looks like a combination of two very bullish patterns, a falling wedge and bull flag. If the wedge is considered the flag, the flagpole started in the March/May timeframe. I don't want to get your greedy on, but if you measure that flagpole and add it to the possible breakout point, the minimum upside target is could be around $18.50. The PMO is hooking nicely. The OBV shows the effect of the current accumulation taking place. The expectation of the falling wedge, if it breaks out, is a move to about $14.50. I'm waiting for the breakout from that declining tops trend line before taking the plunge.
Full Disclosure: I do not own any of the stocks above but have moved some to my watchlist. I'm currently about 60% in cash.
Watch the latest episode of DecisionPoint with Carl & Erin Swenlin LIVE on Mondays 5:00p EST or on the StockCharts TV YouTube channel here!
Technical Analysis is a windsock, not a crystal ball.
Happy Charting!
- Erin
erinh@stockcharts.com
NOTE: The stocks reported herein are from mechanical trading model scans that are based upon moving average relationships, momentum and volume. DecisionPoint analysis is then applied to get five selections from the scans. The selections given should prompt readers to do a chart review using their own analysis process. This letter is not a call for a specific action to buy, sell or short any of the stocks provided. There are NO sure things or guaranteed returns on the daily selection of "diamonds in the rough".
Helpful DecisionPoint Links:
DecisionPoint Shared ChartList and DecisionPoint Chart Gallery
Price Momentum Oscillator (PMO)
Swenlin Trading Oscillators (STO-B and STO-V)
**Don't miss DecisionPoint Commentary! Add your email below to be notified of new updates"**


