

Like yesterday, I ran my bullish PMO scan followed by the "inverse" Scan for Dogs. Yesterday, the results were 19 and 70, respectively. Today, I had only 11 bullish candidates and 111 bearish candidates. It seemed that it would be better to look at shorting opportunities. Yesterday, I shared one short, but today all five are shorting candidates. I personally do not short, so you're on your own there. These stocks have some great downside potential, but you should remember that when you buy a stock, the upside potential is limitless, whereas with a short, your reward is limited to how much downside a stock can take. Tread carefully.
Welcome to the "DecisionPoint Daily Diamonds", a newsletter in which we highlight five "diamonds in the rough," taken from the results of one of my DecisionPoint scans. Remember, these are not recommendations to buy or sell, but simply stocks that I found interesting. The objective is to save you the work of the initial, tedious culling process, but you need to apply your own analysis to see if these stocks pique your interest. There are no guaranteed winners here.
Current Market Outlook:
Market Trend: DP Trend Models are currently on BUY signals.
Market Condition: The market is overbought now that it has reached all-time highs. However, it is important to remember that the market can sustain overbought conditions for some time in a bull market.
Market Environment: It is important to consider the "odds" for success. Here are the current percentages on the Silver and Golden Cross Indexes, which are continuing to rise nicely:
- Silver Cross: 64.6% SPX ITTM Buy Signals
- Golden Cross: 64.4% SPX LTTM Buy Signals
Be sure to read Carl's Weekly Wrap and the DP Alert Mid-Week for more comprehensive coverage of the overall market including Dollar, Gold, Oil and Bonds.
Of the 111 results I got today from the Scan for Dogs, I narrowed it down to these five possible shorting opportunities:
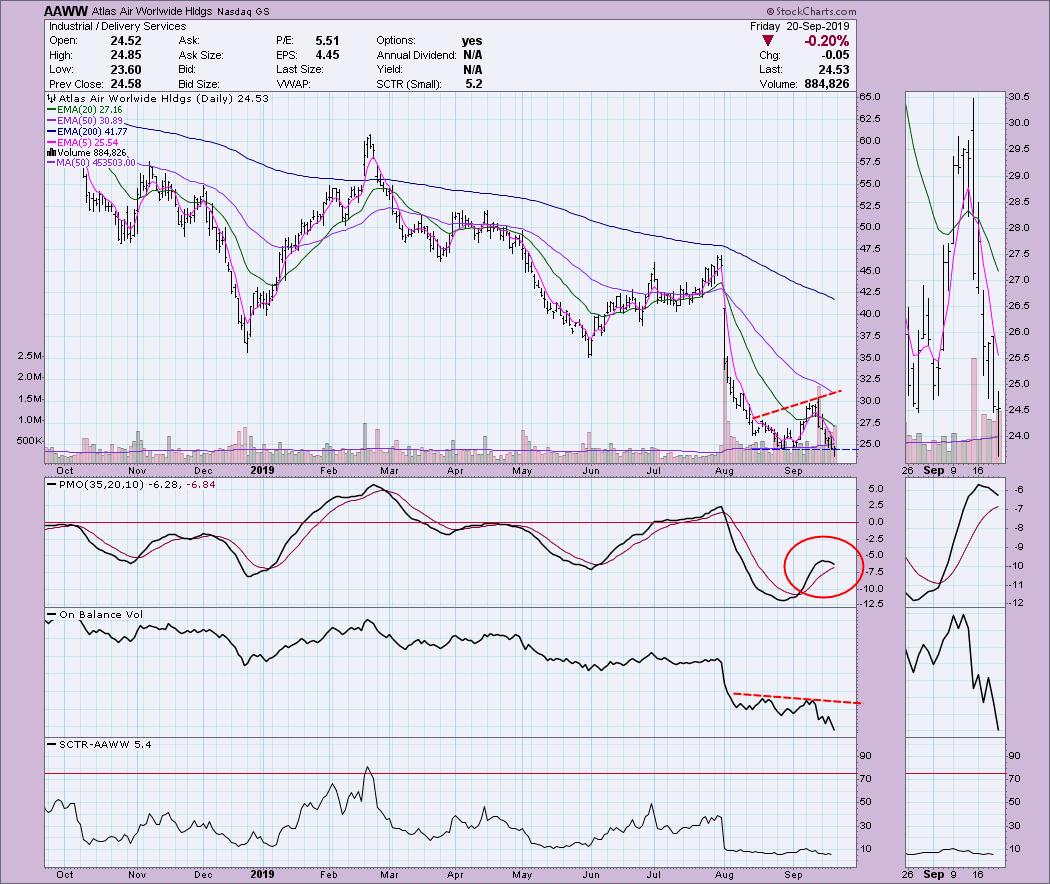
Atlas Air Worldwide Hldgs (AAWW) - Earnings: 10/30/19 - 11/4/19
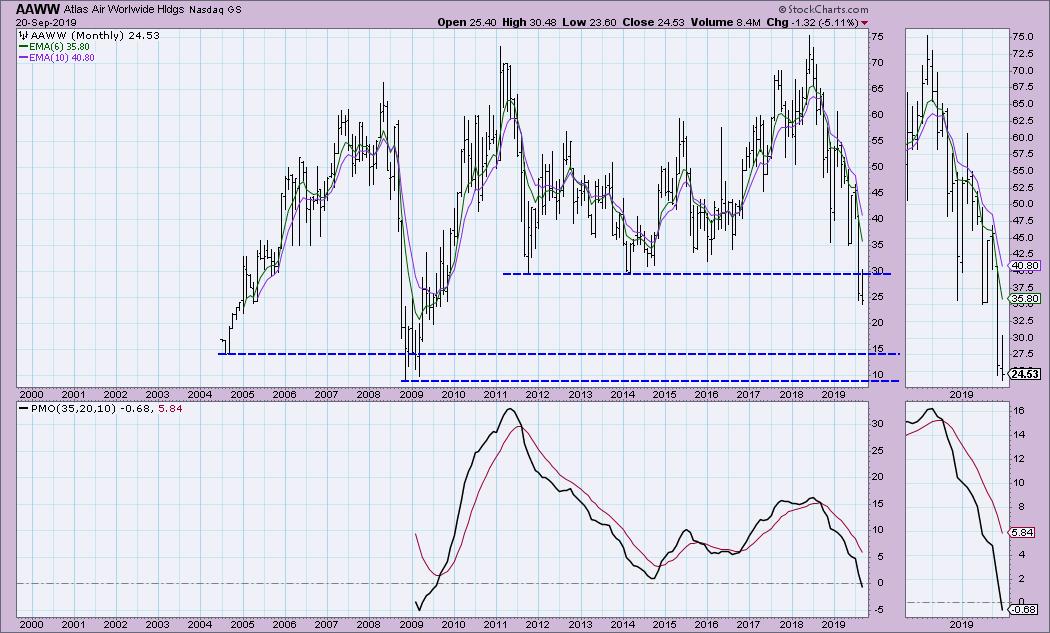
Atlas broke down today, but did close just on support. The PMO has turned over well beneath the zero line. The OBV has been declining and formed a negative divergence with price tops. Since we can't see the next support level on a daily chart OR a weekly chart, I've added the monthly chart below.
This breakdown looks even more severe on the monthly chart. The PMO has moved below zero and the first probably area of support is around $15, but the all-time low was below $10.
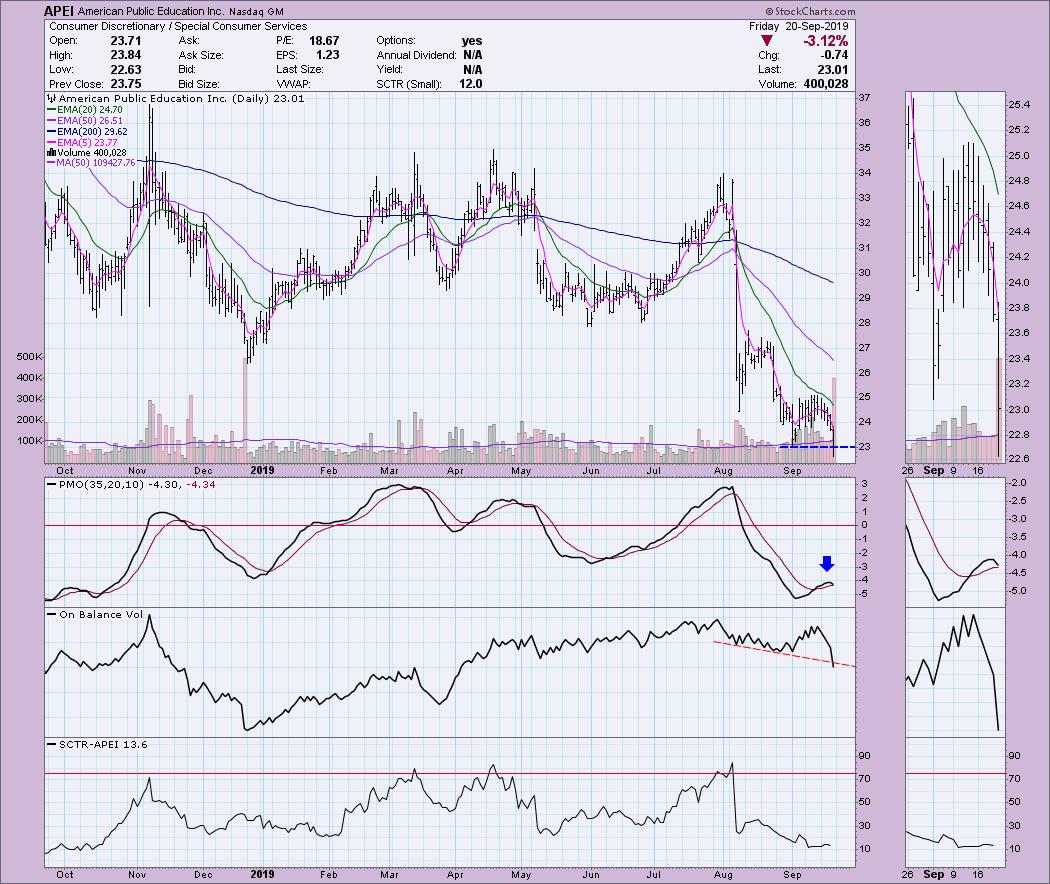
American Public Education Inc (APEI) - Earnings: 11/12/19
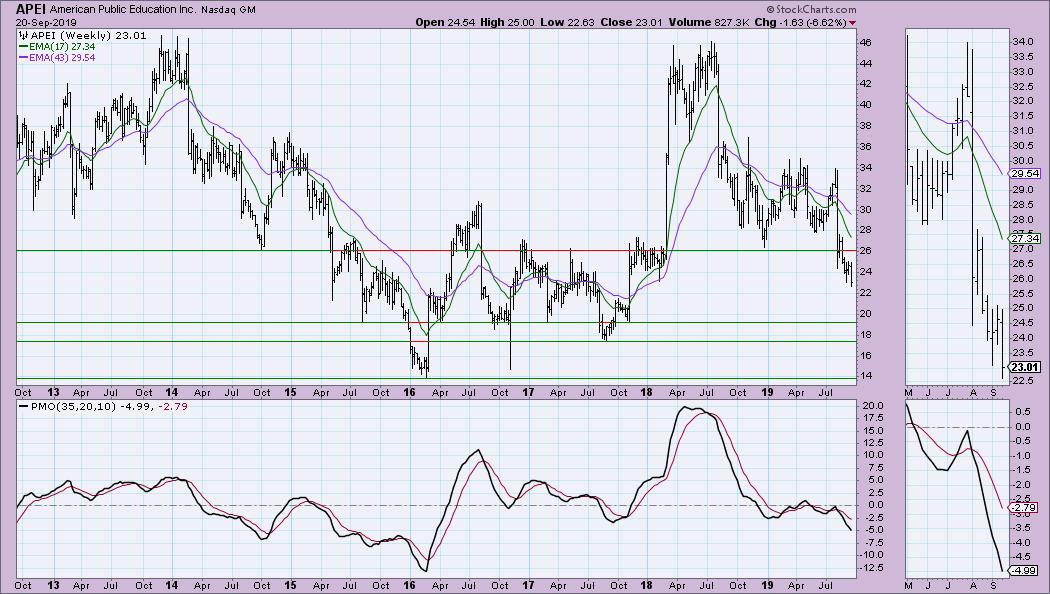
We see a similar breakdown on APEI. Looking in the thumbnail, we see that it closed below support on heavy volume. The PMO topped well below the zero line. I included the weekly chart below this one so you can see the support areas.
The big breakdown occurred earlier this summer, but there is lots of downside potential. My one caution would be that support could be found just under $22, where it bounced in the second quarter of 2015.
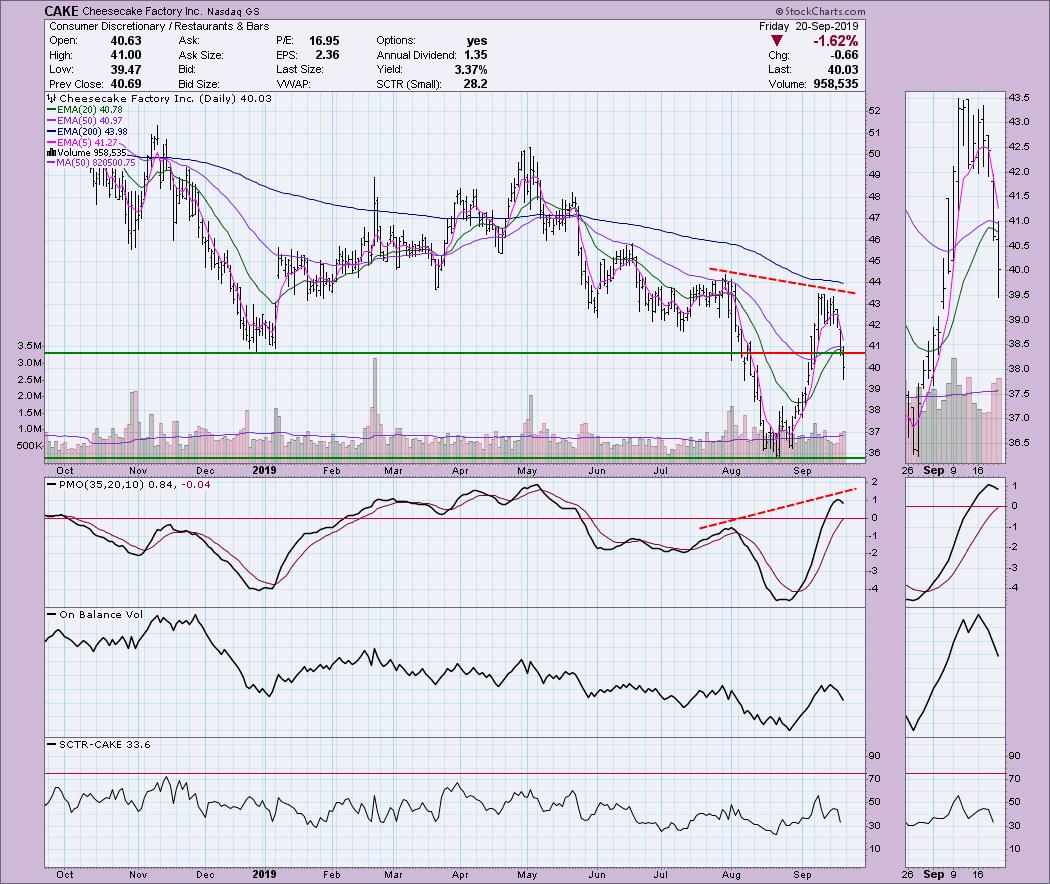
Cheesecake Factory Inc (CAKE) - Earnings: 10/28/19 - 11/1/19
The three days of decline already took CAKE down hard, but today support was finally lost. We have a reverse divergence between price tops and the PMO. Despite all of that upside momentum and the formation of a higher top, price couldn't even reach overhead resistance at the July top. I would look for CAKE to drop to $36.
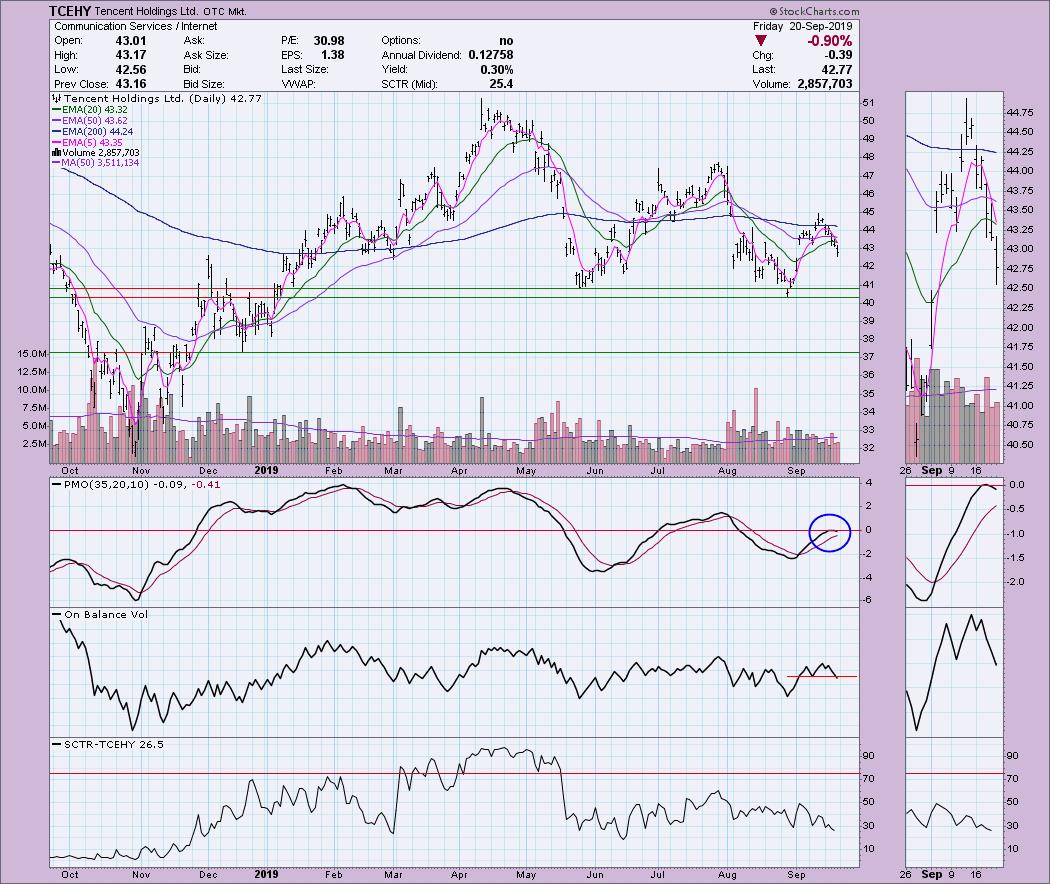
Tencent Holdings Ltd (TCEHY) - Earnings: N/A
I hesitated to include Tencent since they just blitzed news that they're changing up their business. But, since that "upbeat" story, price dropped nearly 1%. I don't like this one. It broke down below short-term support at $43.25 and it hasn't quite closed the gap it formed at the beginning of September. I am looking for that gap to close with a follow-on decline toward support at $40-$41. If it breaks that, the best area for support would be just above $37.
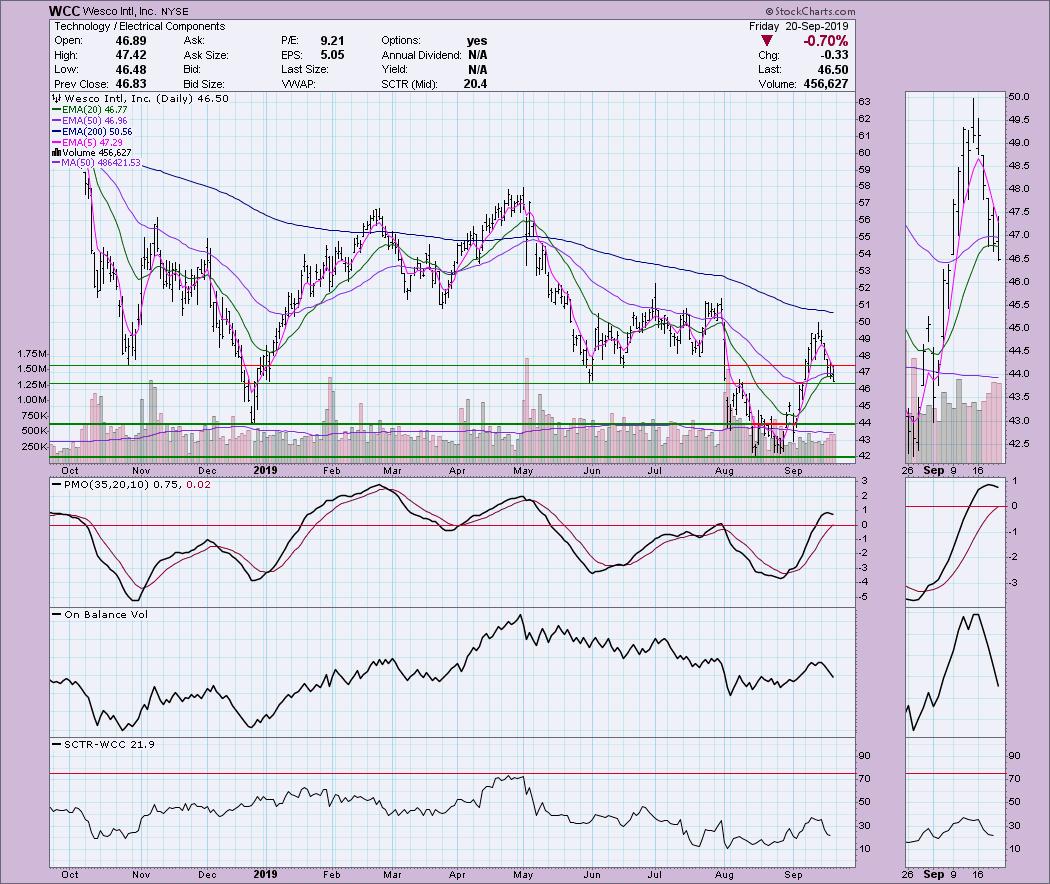
Wesco Intl Inc (WCC) - Earnings: 10/30/19 - 11/4/19
According to the thumbnail, price hasn't quite closed the small gap formed around 9/9. Like TCEHY above, I would expect to see the gap close given the arcing of the PMO and drop in the OBV. It has more distribution given the OBV hasn't reached the low from early August. Price is sitting on support right now, so we could see a dead cat bounce.
Full Disclosure: I do not own any of the stocks above and I am not planning on shorting any at this time. I'm currently about 60% in cash; I'm considering possible longs in defensive sectors, but haven't pulled the trigger just yet, mainly because of the upside-down nature of my bullish and bearish scans. It's hard to find a winner when you know there are so many losers lining up.
Watch the latest episode of DecisionPoint with Carl & Erin Swenlin LIVE on Mondays 5:00p EST or on the StockCharts TV YouTube channel here!
Technical Analysis is a windsock, not a crystal ball.
Happy Charting!
- Erin
erinh@stockcharts.com
NOTE: The stocks reported herein are from mechanical trading model scans that are based upon moving average relationships, momentum and volume. DecisionPoint analysis is then applied to get five selections from the scans. The selections given should prompt readers to do a chart review using their own analysis process. This letter is not a call for a specific action to buy, sell or short any of the stocks provided. There are NO sure things or guaranteed returns on the daily selection of "diamonds in the rough".
Helpful DecisionPoint Links:
DecisionPoint Shared ChartList and DecisionPoint Chart Gallery
Price Momentum Oscillator (PMO)
Swenlin Trading Oscillators (STO-B and STO-V)
**Don't miss DecisionPoint Commentary! Add your email below to be notified of new updates"**


