
The bullish results for my scans are thinning quite a bit. Today, the Diamond Scan produced 18 results while the Diamond Dog Scan produced 119. That's a small increase for the bulls (+8) and a slight decrease (-16) for bears. However, I got 16 results from the WealthWise Women Pink Line Scan, which uses a combination of a chandelier exit and the 50-SMA as the primary indicators. I liked some of those results and decided to post five stocks from it.
Welcome to "DecisionPoint Daily Diamonds", a newsletter in which we highlight five "diamonds in the rough" taken from the results of one of my DecisionPoint scans. Remember, these are not recommendations to buy or sell, but simply stocks that I found interesting. The objective is to save you the work of the initial, tedious culling process, but you need to apply your own analysis and to see if these stocks pique your interest. There are no guaranteed winners here.
Current Market Outlook:
Market Trend: DP Trend Models are currently on BUY signals.
Market Condition: The market is overbought and losing some ground. The PMO is falling on the SPX and is getting ready to trigger a SELL signal.
Market Environment: It is important to consider the "odds" for success. Here are the current percentages on the Silver and Golden Cross Indexes, which began to rise again after today's action:
- Silver Cross: 70% SPX ITTM Buy Signals (no change from yesterday)
- Golden Cross: 66.4% SPX LTTM Buy Signals (slight increase +0.4%)
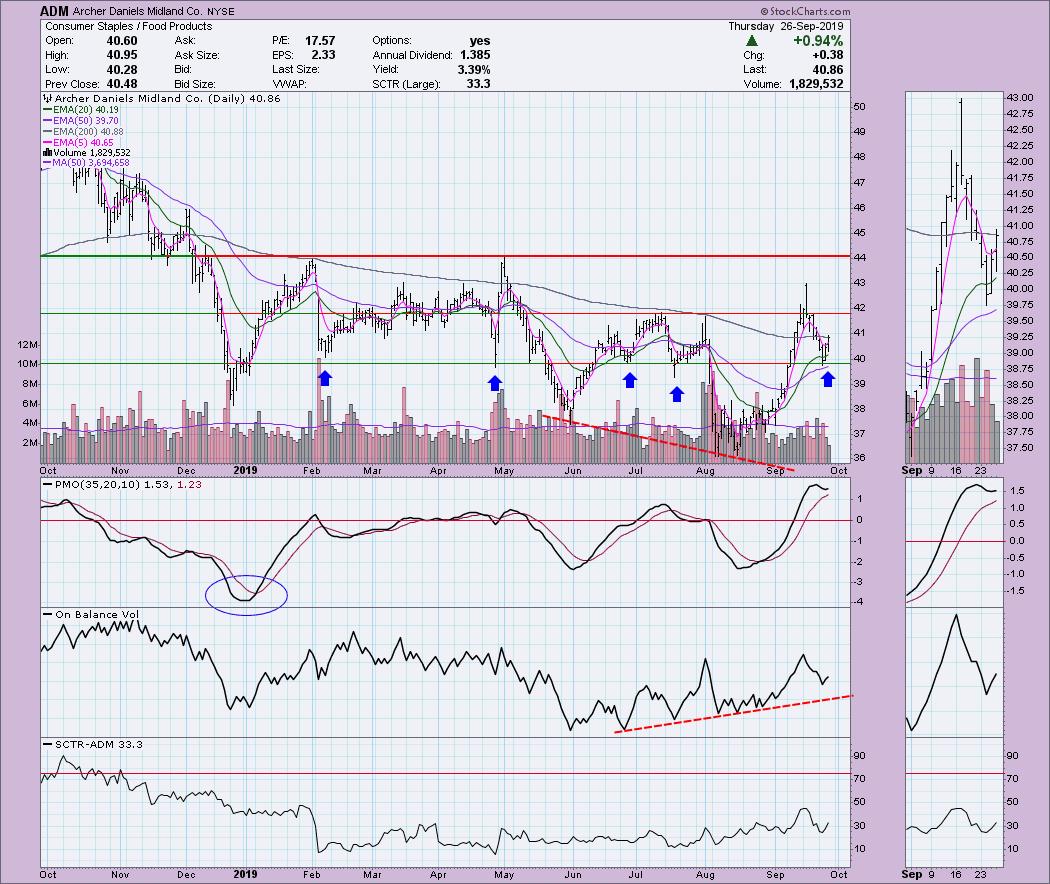
Archer Daniels Midland Co (ADM) - Earnings: 10/31/19
First up, ADM bounced nicely off support at $40. The PMO has turned up but appears to be overbought - except it isn't. Notice that, earlier in the year, we saw readings of -4. Typically, the PMO travels in a regular channel, so its "normal" range is more like -4 to +4. The PMO can move higher with no problem. ADM has been pretty beaten down this year. It is a Consumer Staple; typically, these are less than sexy investments, as this chart shows you. They tend to travel in a price range over time, never really making too much ground. I think this one is enticing in a weak market. The OBV shows a nice positive divergence with price bottoms.
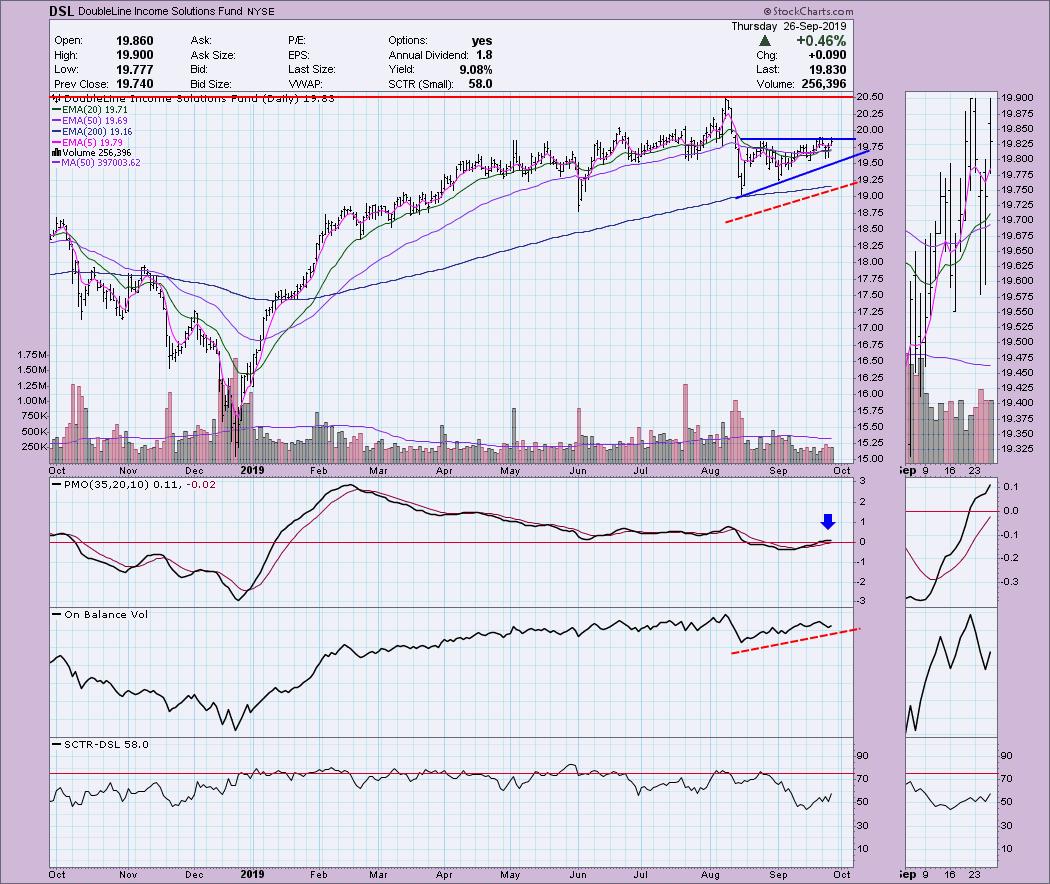
DoubleLine Income Solutions Fund (DSL) - Earnings: N/A
This one is still in need of a breakout from short-term overhead resistance. It is nearing that breakout; if we see it, I would look for price to test the August high. The PMO has just gotten above zero and the OBV is in line with price. The SCTR is starting to improve as well.
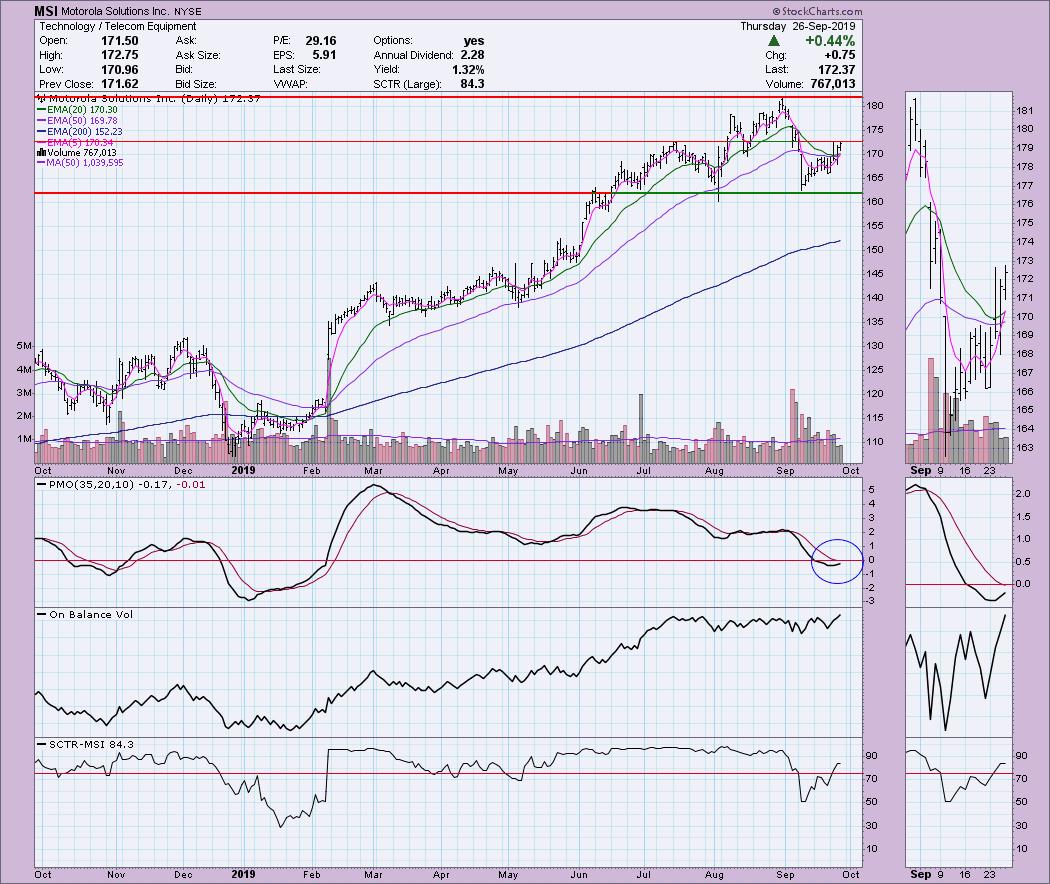
Motorola Solutions Inc (MSI) - Earnings: 10/30 - 11/4
This is another stock that is testing overhead resistance but hasn't quite broken above. The PMO is looking great on this move and you can see the accumulation taking place this week. Notice also that the 20-EMA is turning up before a negative crossover with the 50-EMA. Look for a breakout to take price to the August high.
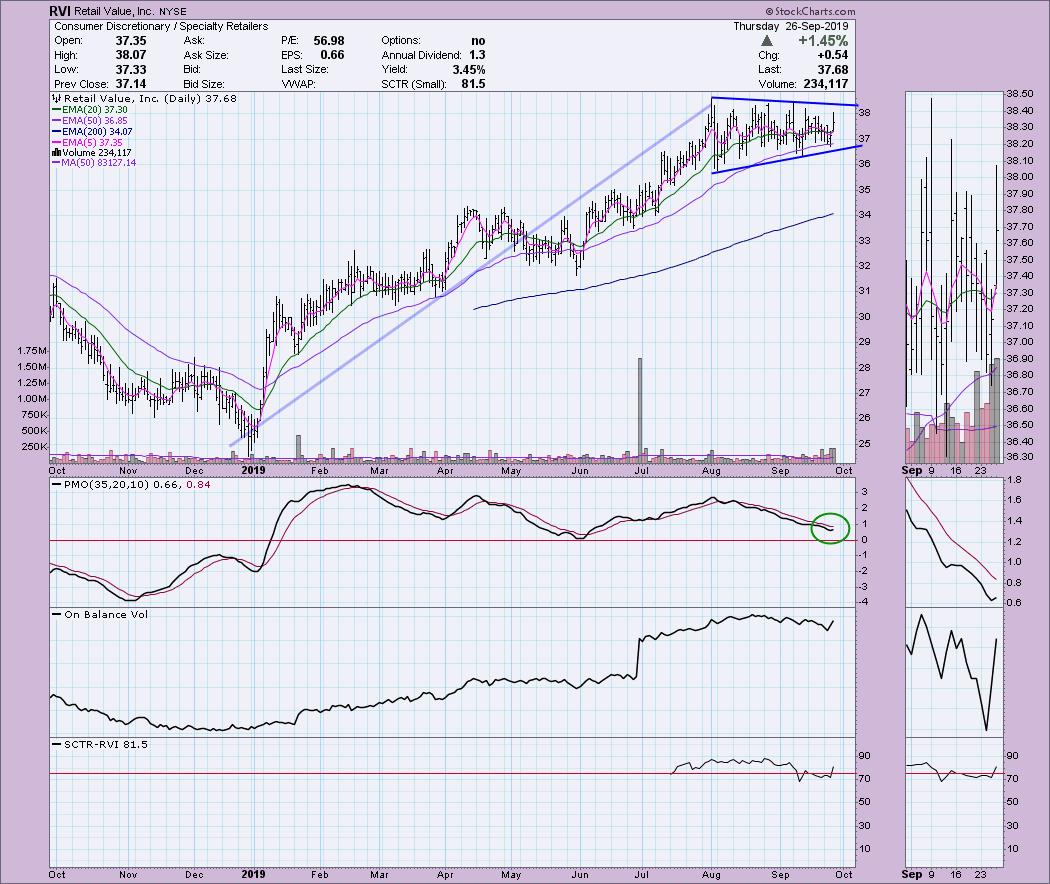
Retail Value Inc (RVI) - Earnings: N/A
This one is a little borderline in that it continues to consolidate sideways and not make a move. However, the PMO is trying to turn back up, which could be a flag formation. Or, rather than a flag, it could be a pennant, which could also be read as a symmetrical triangle. In all cases, the resolution is supposed to be to the upside. Volume is perking up, as you can see by the break in the declining trend of the OBV.
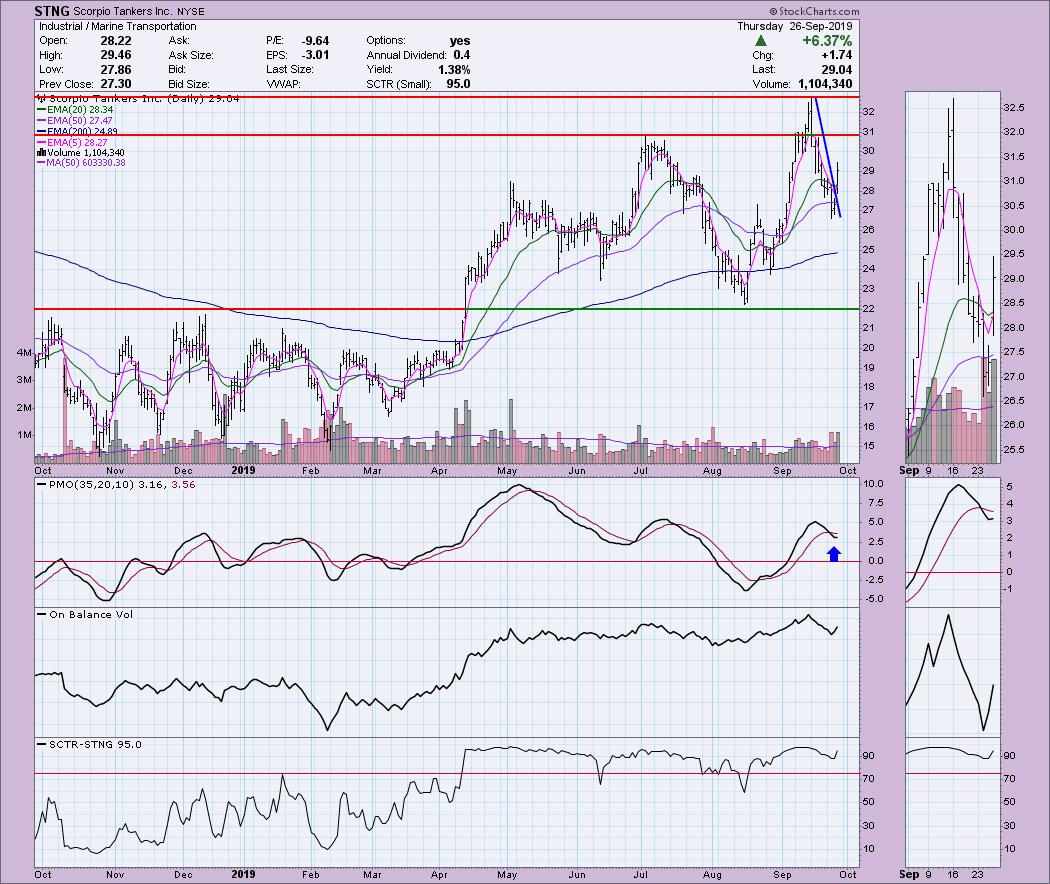
Scorpio Tankers Inc (STNG) - Earnings: 10/29 - 11/4
This one is in need of a pullback before entry. Of course, sometimes these do continue to run, but, after a 6.37% move, a pullback is highly likely. The PMO did just trigger a SELL signal, which is not a surprise given the steep decline. The PMO is turning up now. Typically the PMO on STNG doesn't wiggle, so there's not too many false PMO signals here. This move came on a lot of volume, so it looks like a buying initiation.
Full Disclosure: I do not own any of the stocks above and I am not planning on purchasing any at this time. I'm currently about 60% in cash.
Watch the latest episode of DecisionPoint with Carl & Erin Swenlin LIVE on Mondays 5:00p EST or on the StockCharts TV YouTube channel here!
Technical Analysis is a windsock, not a crystal ball.
Happy Charting!
- Erin
erinh@stockcharts.com
NOTE: The stocks reported herein are from mechanical trading model scans that are based upon moving average relationships, momentum and volume. DecisionPoint analysis is then applied to get five selections from the scans. The selections given should prompt readers to do a chart review using their own analysis process. This letter is not a call for a specific action to buy, sell or short any of the stocks provided. There are NO sure things or guaranteed returns on the daily selection of "diamonds in the rough."
Helpful DecisionPoint Links:
DecisionPoint Shared ChartList and DecisionPoint Chart Gallery
Price Momentum Oscillator (PMO)
Swenlin Trading Oscillators (STO-B and STO-V)
**Don't miss DecisionPoint Commentary! Add your email below to be notified of new updates"**


