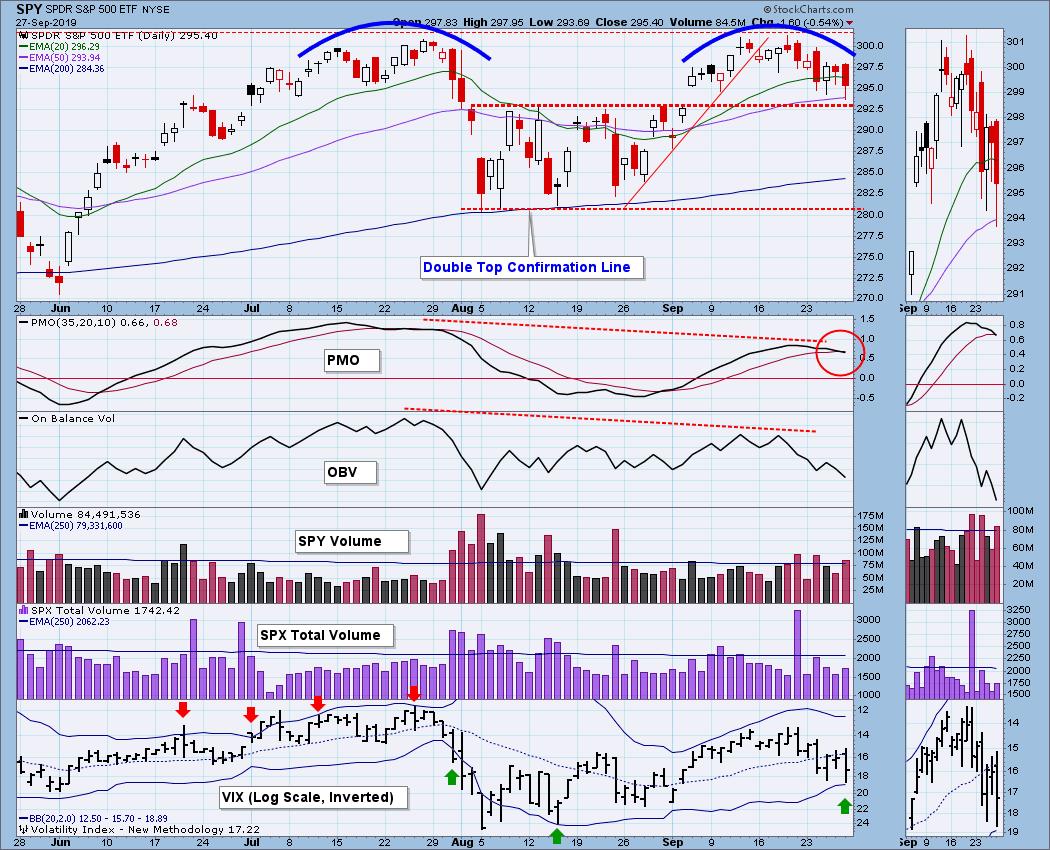
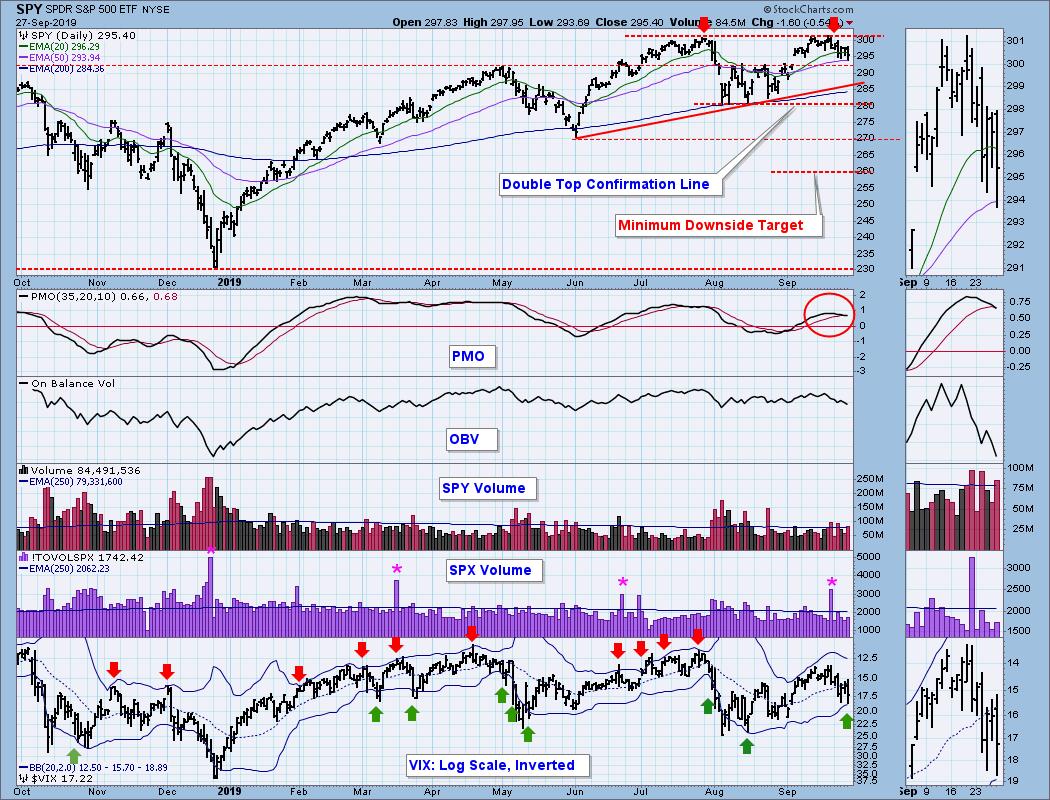
The July and September price tops are virtually identical, so I am assuming that a double top is in progress; however, it won't be a official double top until price drops below the confirmation line. That is a bit long to wait before taking appropriate action, so I will act upon the double top assumption until proven wrong. The minimum downside target is about 260, which is -11% from current levels. The PMO SELL signal Friday, and the negative divergences on the PMO and OBV provide additional evidence supporting my conclusion. The only positive notes at this point is that the VIX is about to touch the lower Bollinger Band, making it oversold, and there is a line of support immediately below.
The DecisionPoint Weekly Wrap presents an end-of-week assessment of the trend and condition of the stock market (S&P 500), the U.S. Dollar, Gold, Crude Oil, and Bonds.
Watch the latest episode of DecisionPoint on StockCharts TV's YouTube channel here!
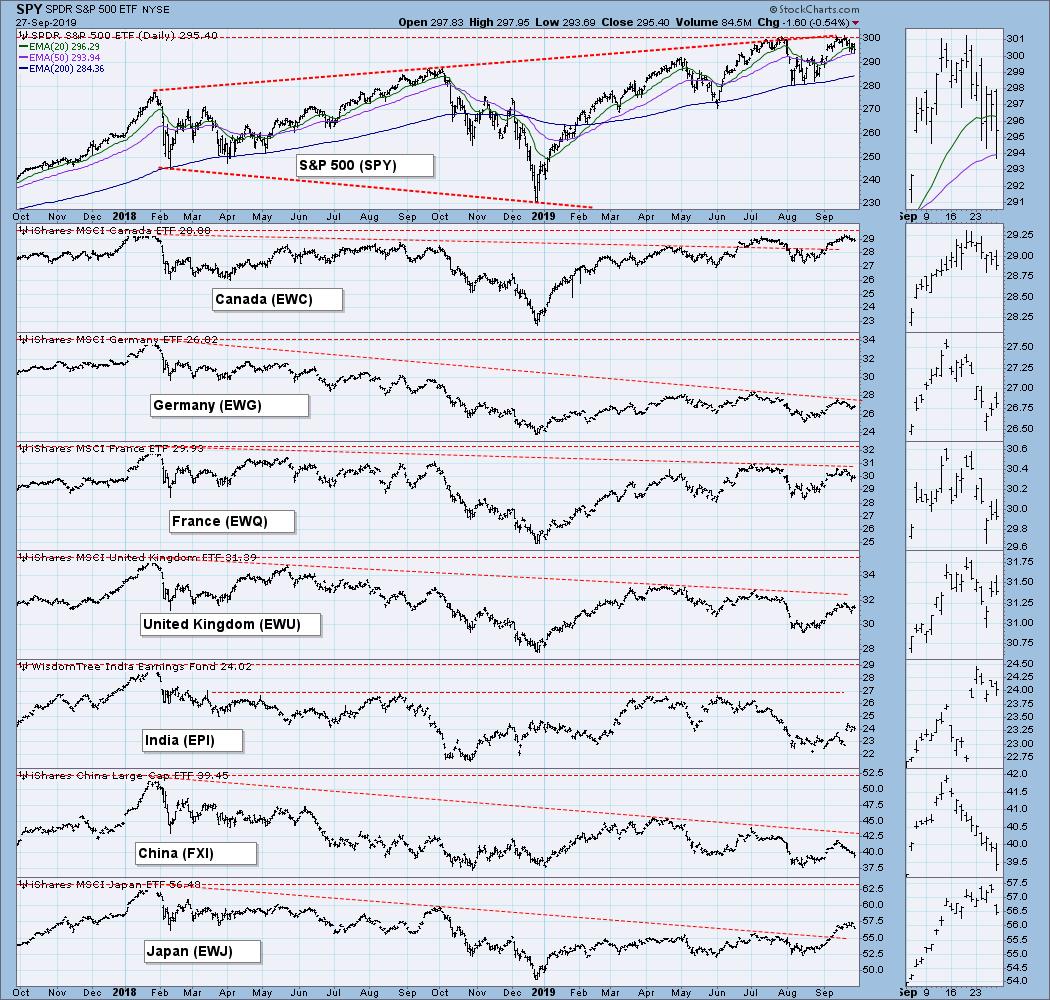
GLOBAL MARKETS
Only Canada is close to making all-time highs.
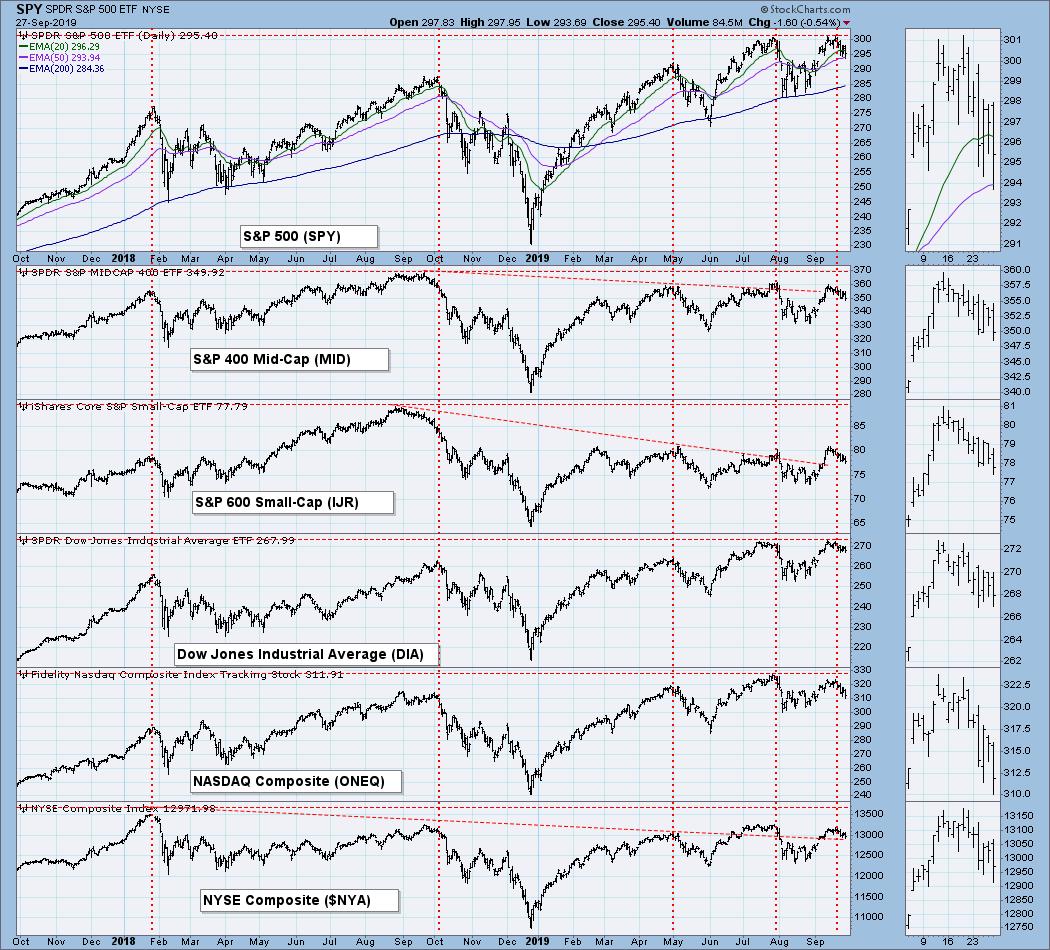
BROAD MARKET INDEXES
The S&P 400 and S&P 600 are especially weak.
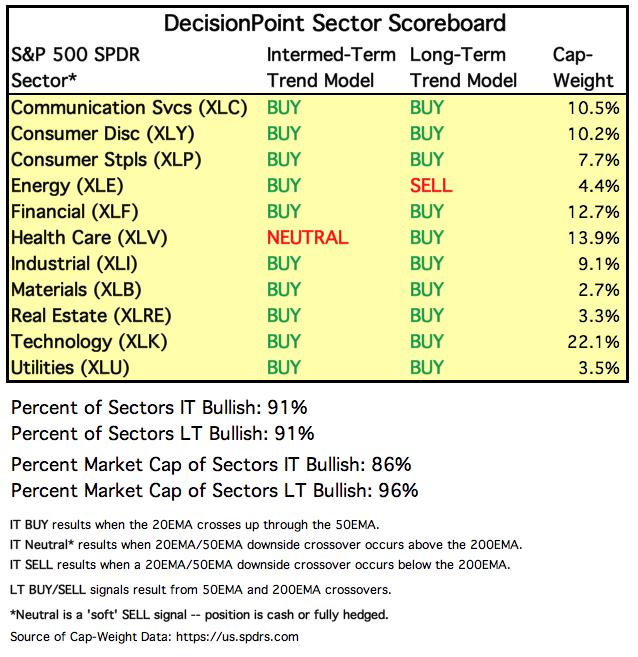
SECTORS
Each S&P 500 Index component stock is assigned to one, and only one, of 11 major sectors. This is a snapshot of the Intermediate-Term and Long-Term Trend Model signal status for those sectors.
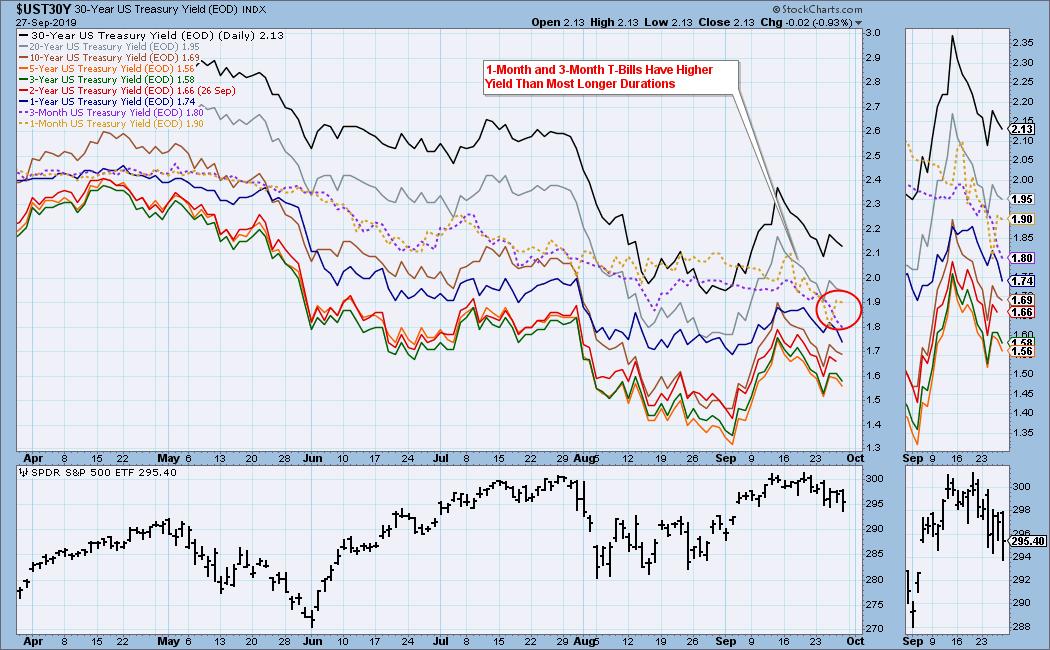
INTEREST RATES
Because some interest rates are currently inverted, I will be including a chart so we can monitor the situation. In normal circumstances the longer money is borrowed the higher the interest rate that must be paid. When rates are inverted, the reverse is true. It is generally believed that rate inversions result from "a flight to safety." On the chart below, notice that the one-month and three month T-Bills (dotted lines) pay a higher interest rate than the one year through the 10-year T-Bonds. This is a serious problem for the stock market.
STOCKS
IT Trend Model: NEUTRAL as of 9/6/2019
LT Trend Model: BUY as of 2/26/2019
SPY Daily Chart: I discussed most of what we see on this chart at the beginning of this article. Here we can see the minimum downside target at 260.
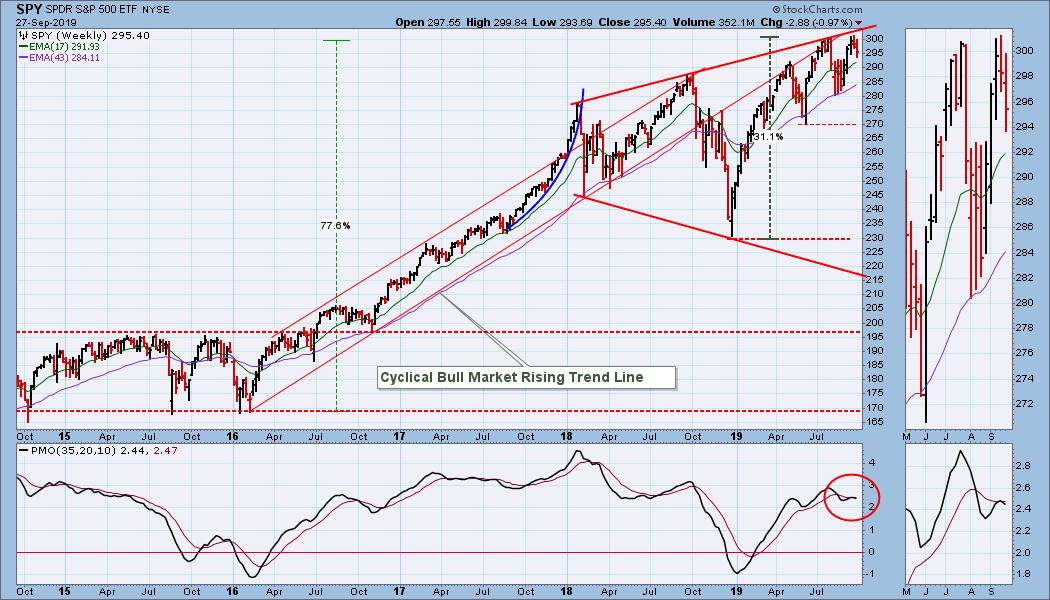
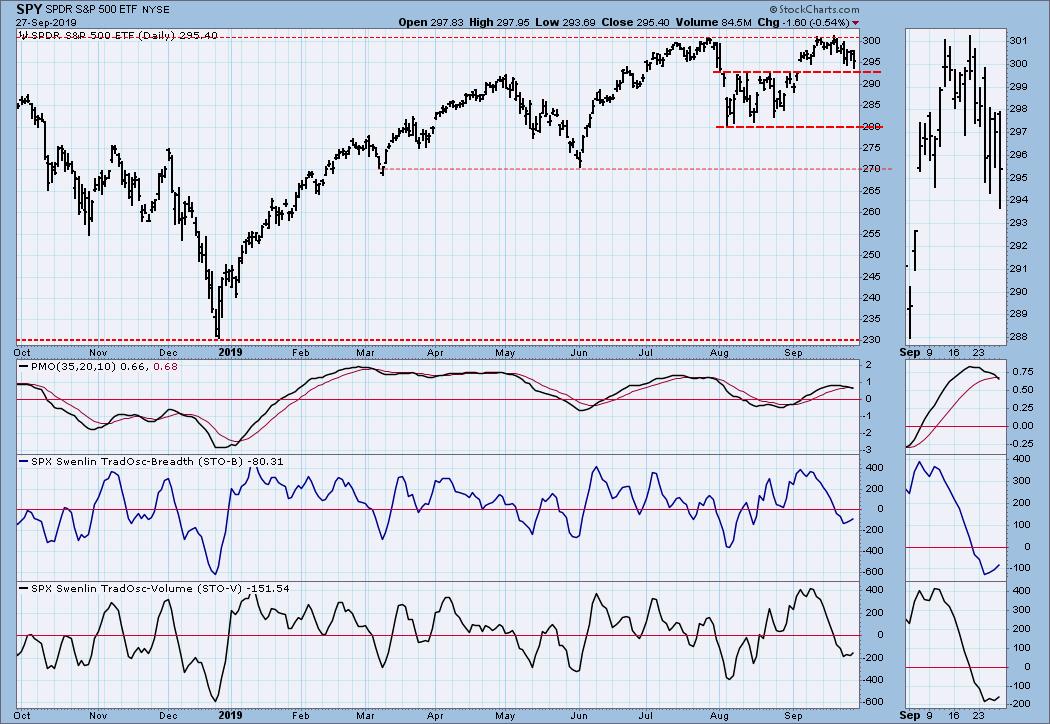
SPY Weekly Chart: The broadening top has negative implications, as does the weekly PMO being below the signal line and falling.
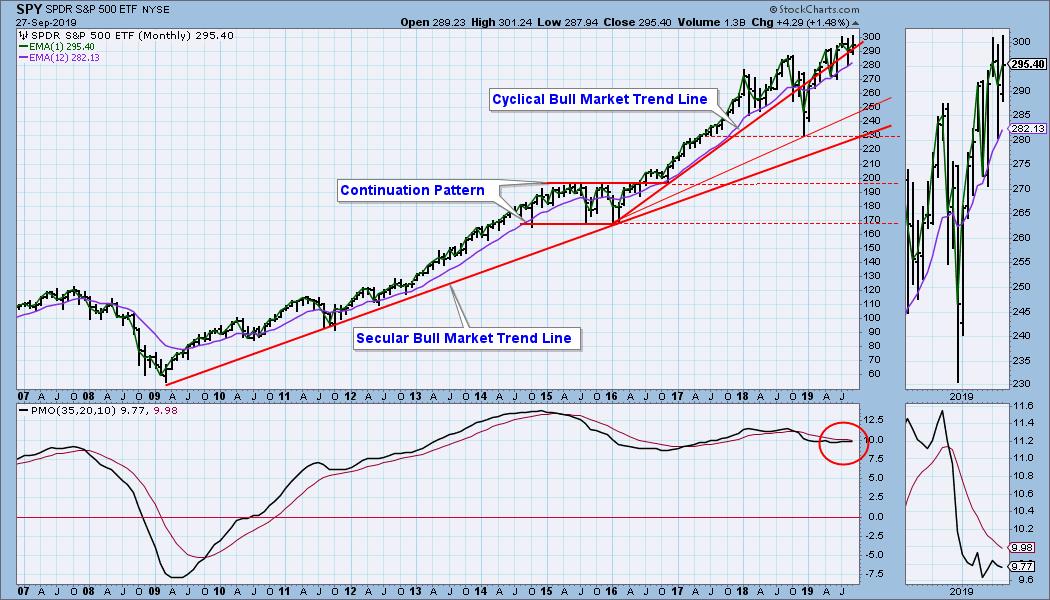
SPY Monthly Chart: The monthly charts won't finalize until the market close on Monday, but I think not much will change here in one trading day, so I'm going to include the monthly charts in this report. If something major happens to change the monthly outlook, we'll report it next week.
The monthly PMO is below the signal line and falling, which is negative; however, it has been relatively flat (the thumbnail chart exaggerates the trend) and positive for about four years. This chart doesn't worry me, but it would if the PMO accelerates to the downside.
Climactic Market Indicators: Not really any climactic activity this week.
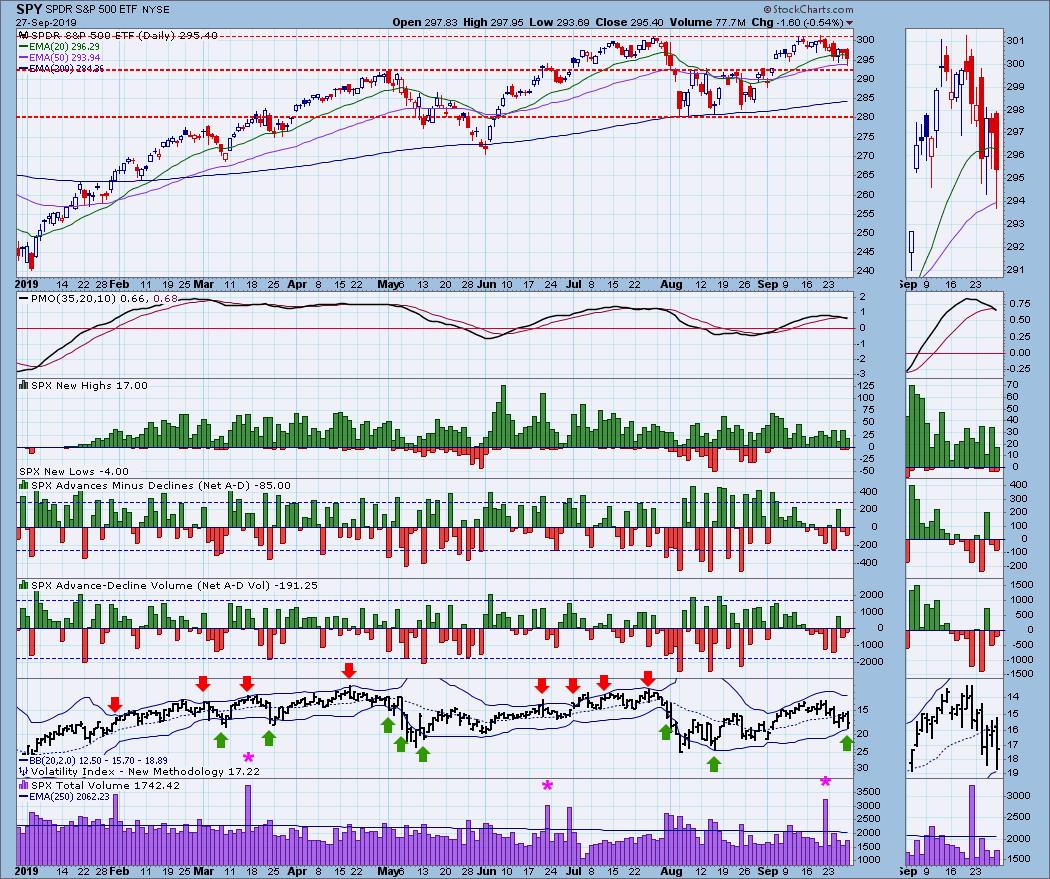
Short-Term Market Indicators: The STO-B and STO-V became slightly oversold, but they are not rising with any enthusiasm.
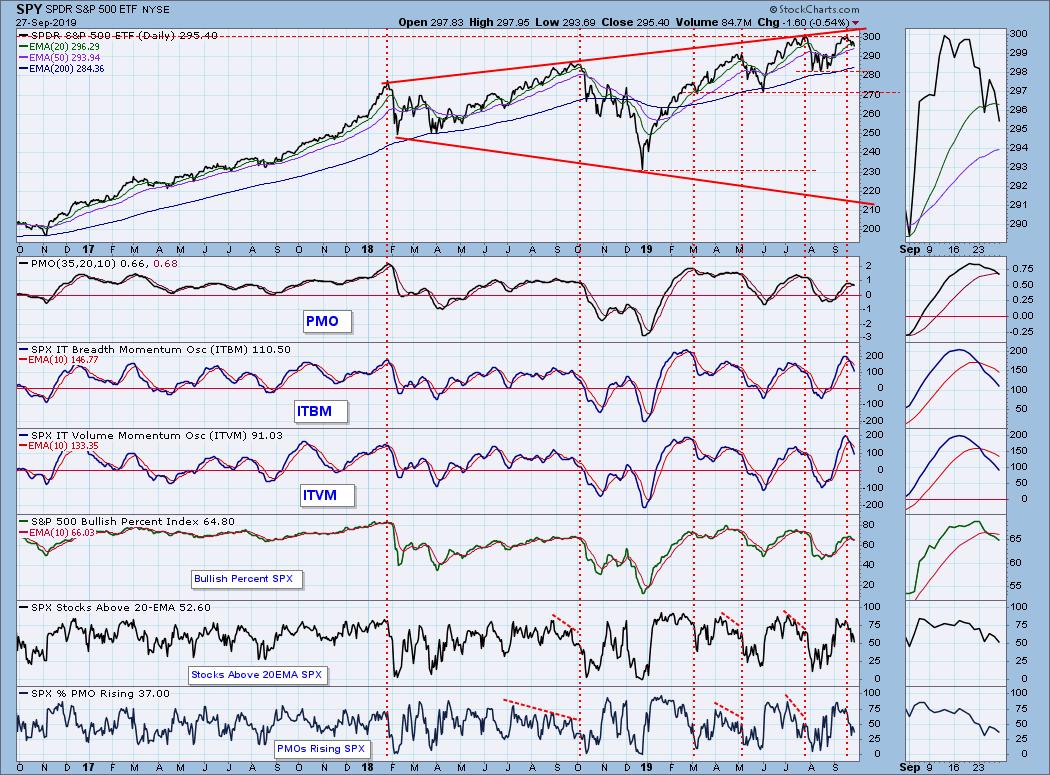
Intermediate-Term Market Indicators: All indicators have turned down from overbought levels, and they have plenty of room to fall before they are oversold.
CONCLUSION: The dominant feature on the SPY chart is the double top, and the internals are aligned to facilitate a continued market decline. There is support immediately below, and a further decline of -5% will bring the double top confirmation line into play. I expect the decline to continue, but, admittedly, there is a lot of work to do before the double top downside projection of SPY 260 is within reach.
Erin and I do a 30-minute show on StockCharts TV on Mondays at 5 pm ET. If you can't make that schedule, you can watch it on YouTube. Please check it out!
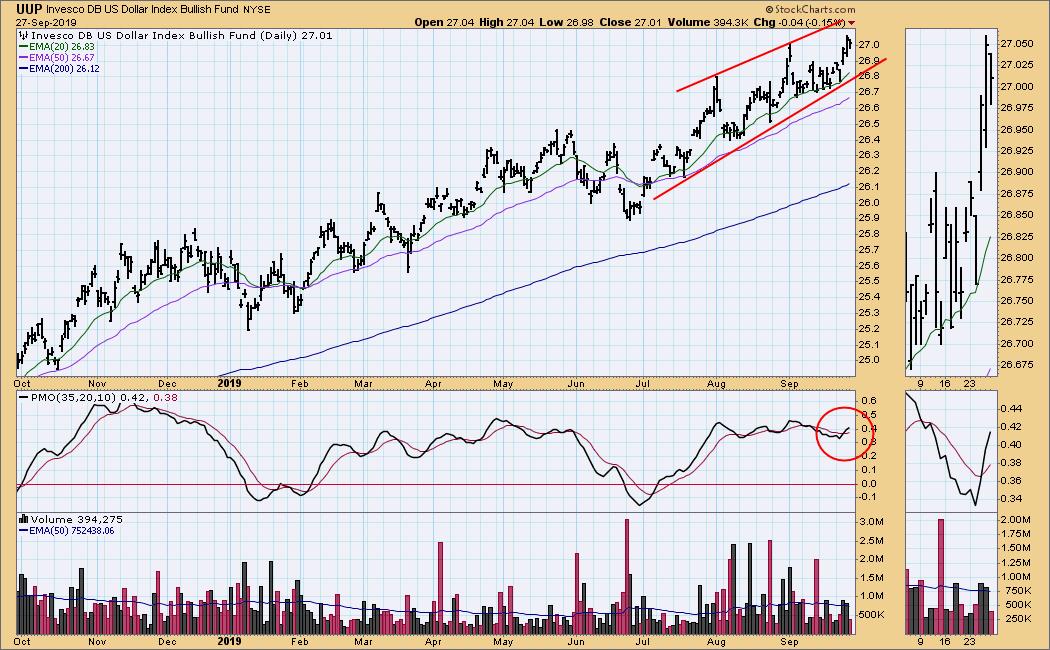
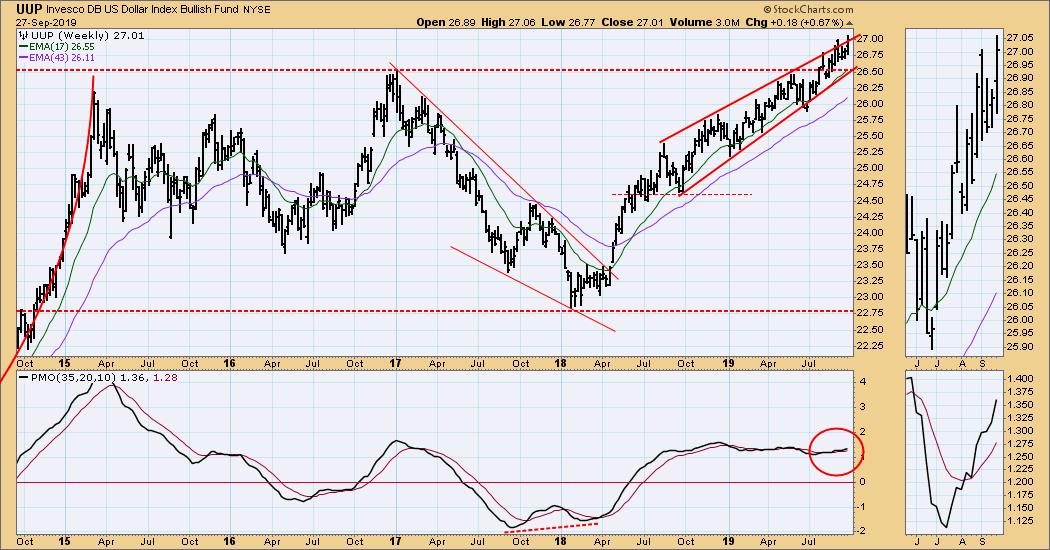
DOLLAR (UUP)
IT Trend Model: BUY as of 7/5/2019
LT Trend Model: BUY as of 5/25/2018
UUP Daily Chart: We can see a rising wedge, but it is not closing too quickly, so it could continue for some time. The daily PMO is bullish.
UUP Weekly Chart: The longer-term rising wedge looks viable in this time frame. The weekly PMO is flat and reflects the steady price rise.
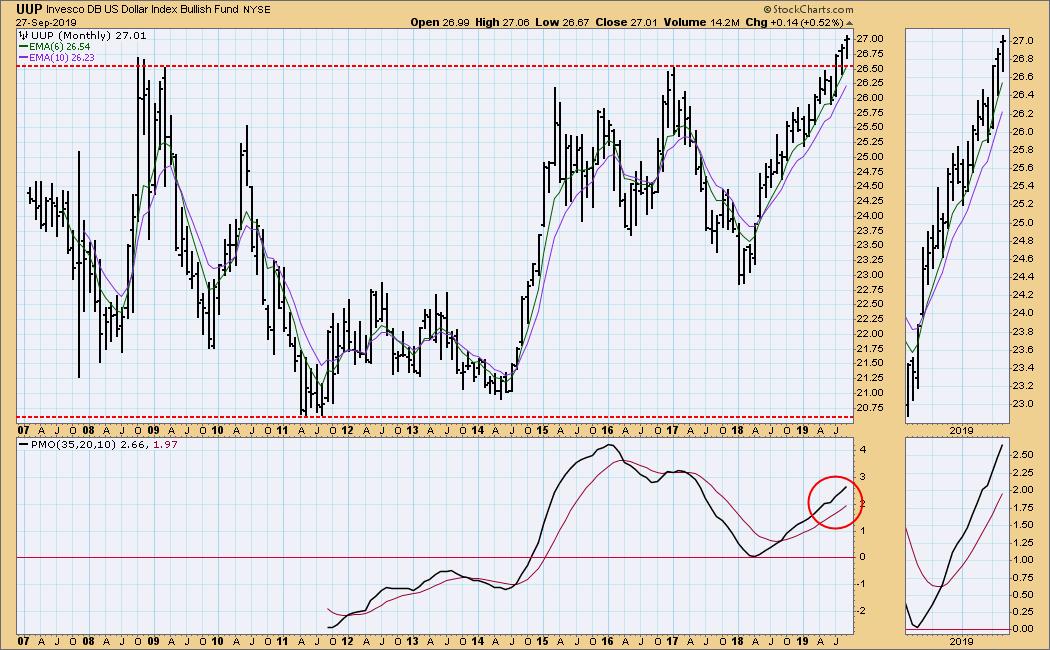
UUP Monthly Chart: The break above the line of resistance is not yet decisive, but it looks solid.
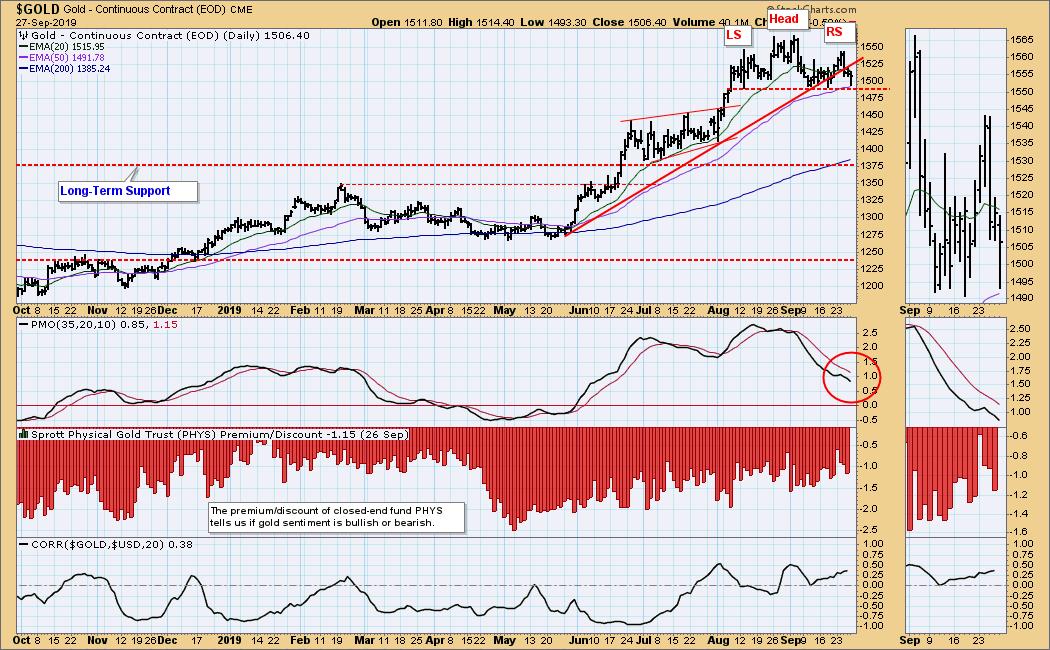
GOLD
IT Trend Model: BUY as of 6/3/2019
LT Trend Model: BUY as of 1/8/2019
GOLD Daily Chart: The head and shoulders formation is starting to look serious, and price is about to break down through the neckline. We could be in for a period of pullback, but as long as the support at 1375 is not broken, the bullish case for gold will hold.
GOLD Weekly Chart: We can see the next level of support is at 1450. The weekly PMO has topped, which is not a good sign. It may take several months of pullback/chop to consolidate the last 12 month's gains.
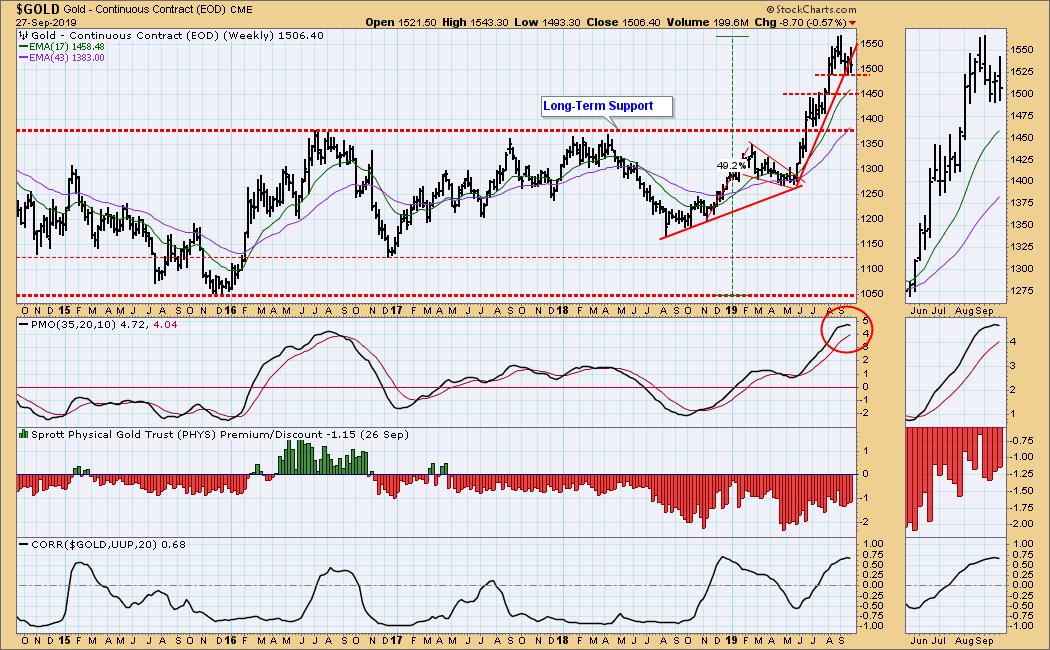
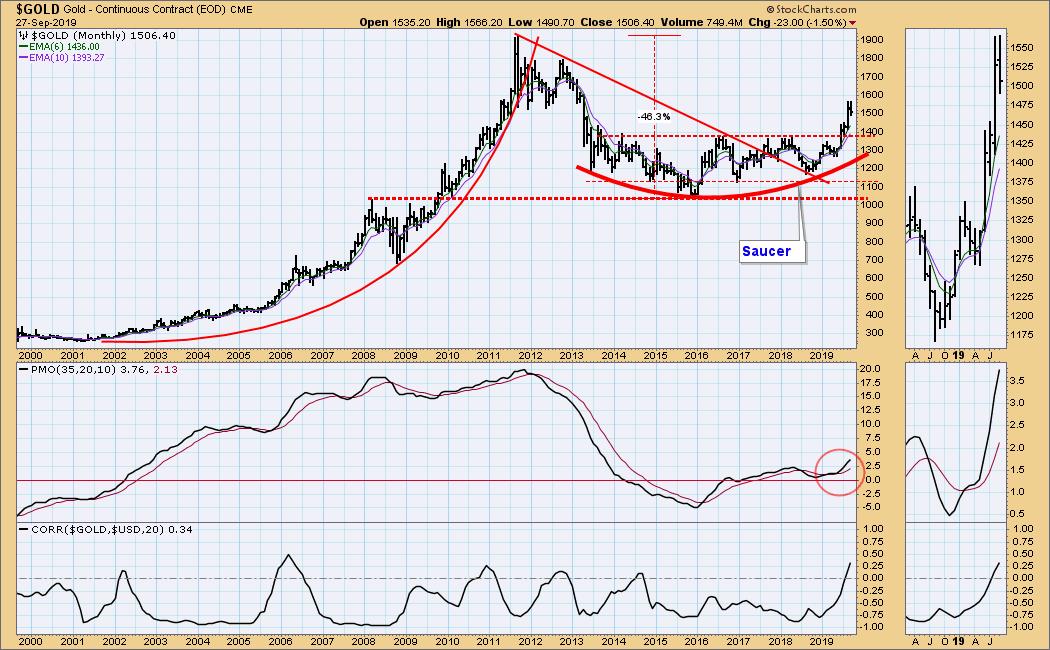
GOLD Monthly Chart: An important breakout took place this year. The extended period of chop I anticipate may put a handle on the saucer formation, which would be positive.
CRUDE OIL (USO)
IT Trend Model: BUY as of 9/16/2019
LT Trend Model: SELL as of 6/4/2019
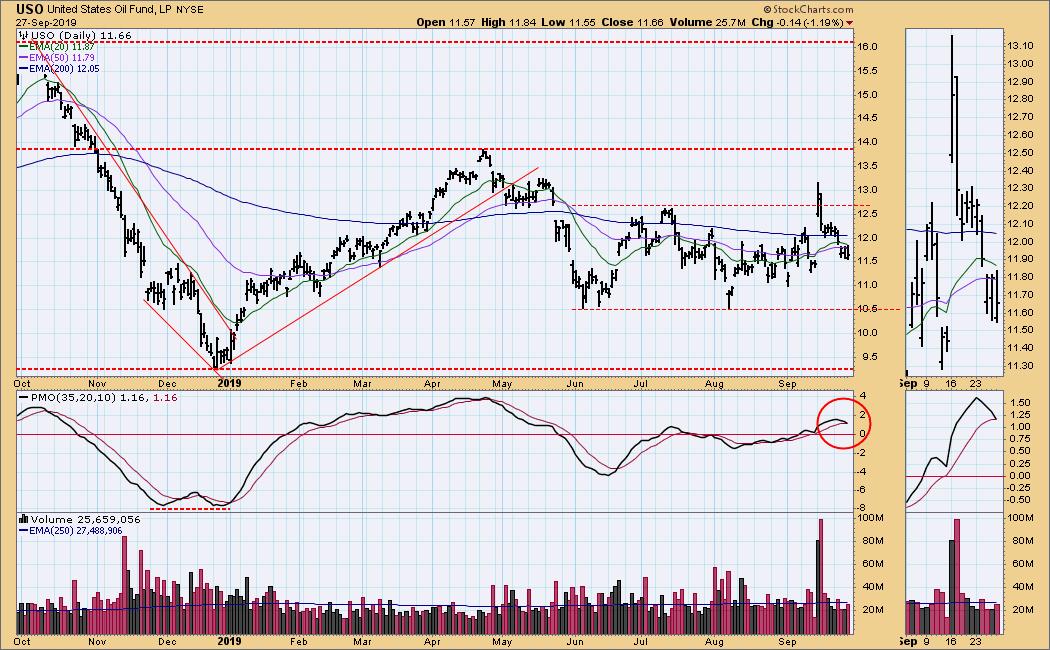
USO Daily Chart: Price is in the middle of the trading range and the daily PMO has topped. I would expect a decline to the bottom of the range (10.50).
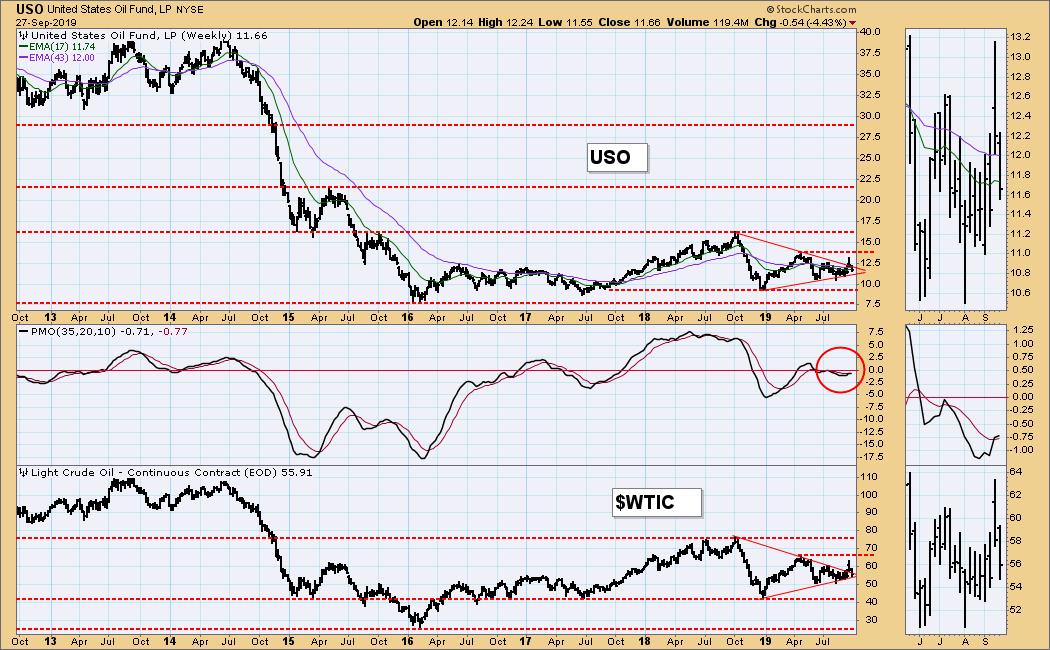
USO Weekly Chart: USO and WTIC are back inside the triangle formations, which are about to become irrelevant when price moves sideways through the apex.
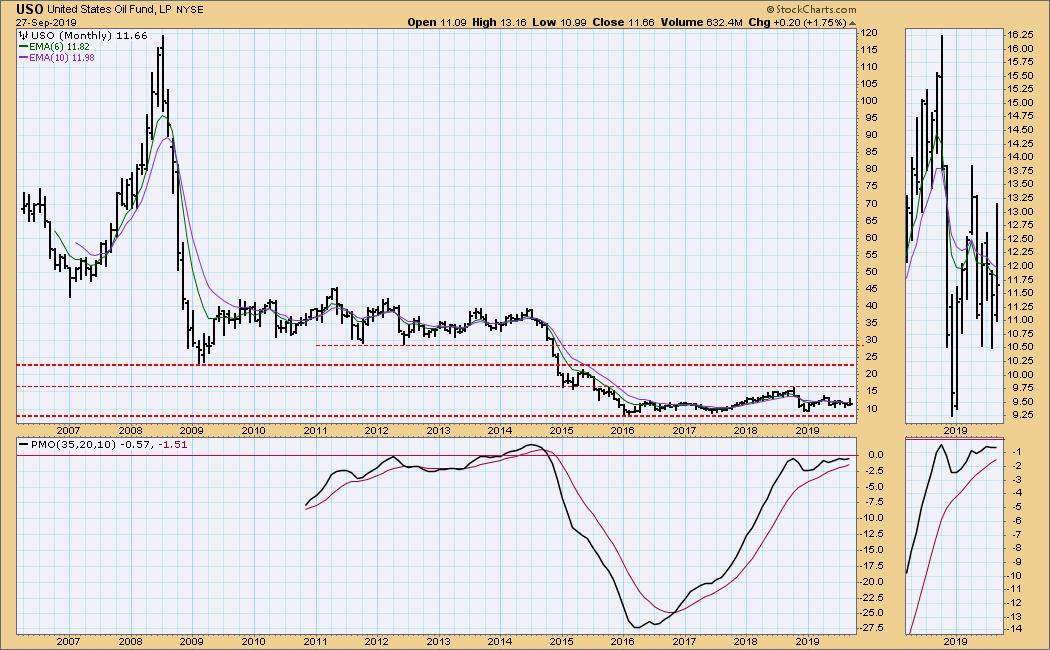
USO Monthly Chart: I think it will take unexpected bad news to get price above the basing range it has maintained for four years.
BONDS (TLT)
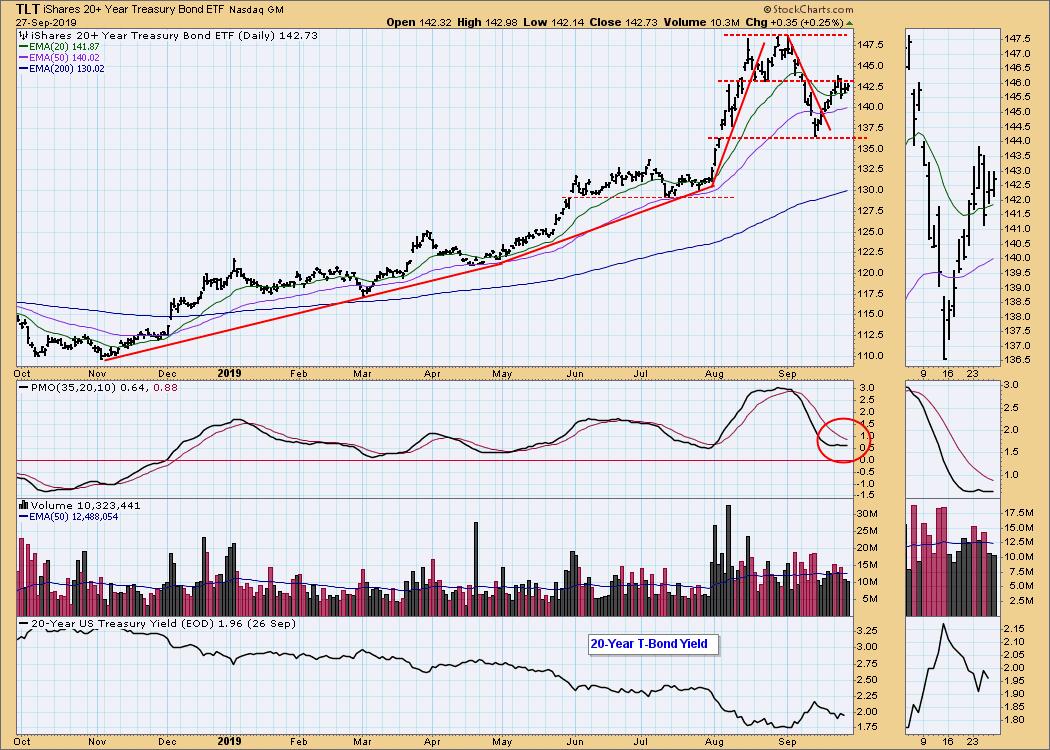
IT Trend Model: BUY as of 12/6/2018
LT Trend Model: BUY as of 1/2/2019
TLT Daily Chart: Until the Fend cuts rates again, I think TLT will be holding within the range established in the last two weeks.
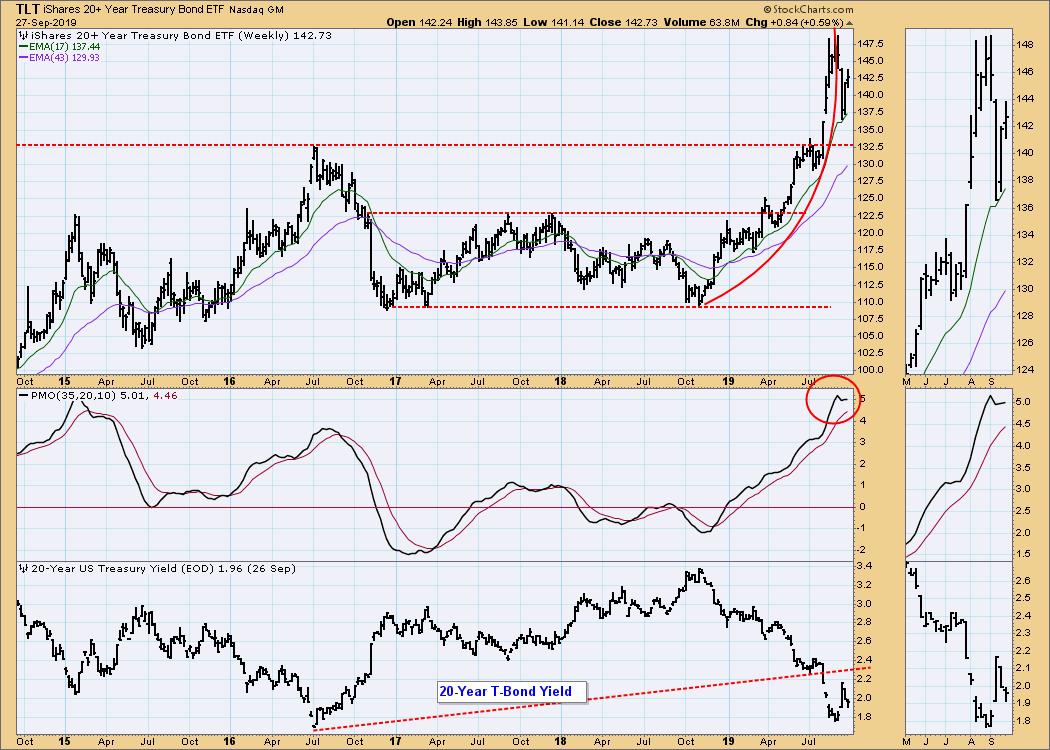
TLT Weekly Chart: The parabolic advance was doomed to fail, but I think that a consolidation is starting.
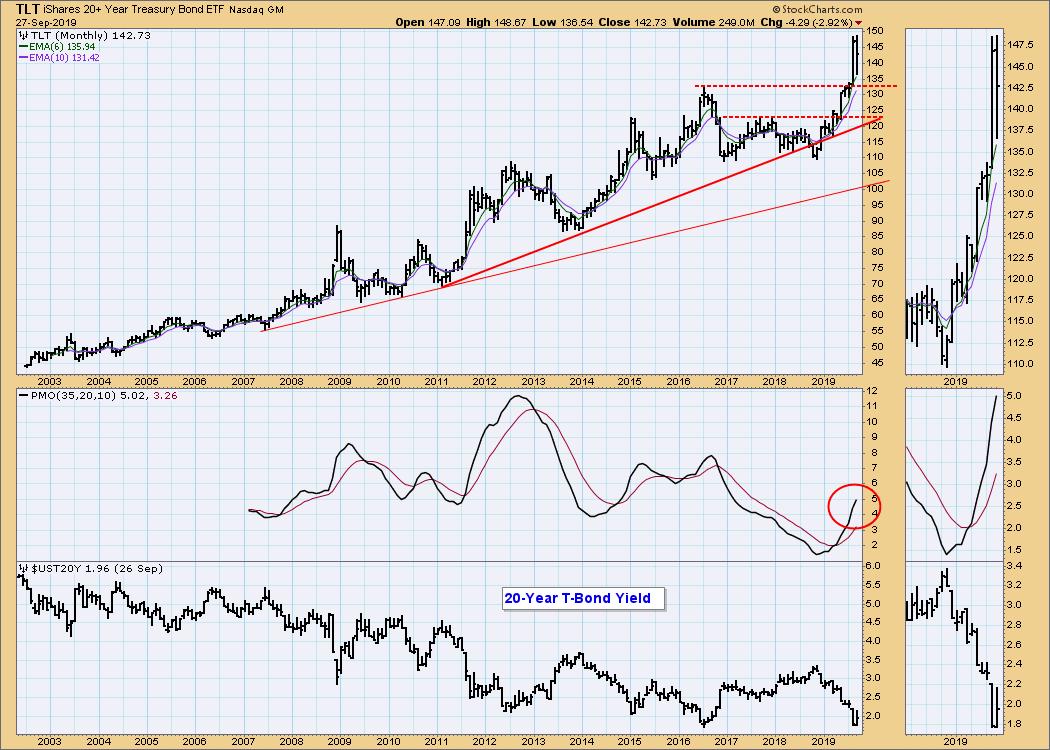
TLT Monthly Chart: In this time frame the support at 133 is obvious, but another rate cut will be needed to get a break above the recent tops.
**Don't miss any of the DecisionPoint commentaries! Go to the "Notify Me" box toward the end of this blog page to be notified as soon as they are published.**
Technical Analysis is a windsock, not a crystal ball.
Happy Charting! - Carl
NOTE: The signal status reported herein is based upon mechanical trading model signals, specifically, the DecisionPoint Trend Model. They define the implied bias of the price index based upon moving average relationships, but they do not necessarily call for a specific action. They are information flags that should prompt chart review. Further, they do not call for continuous buying or selling during the life of the signal. For example, a BUY signal will probably (but not necessarily) return the best results if action is taken soon after the signal is generated. Additional opportunities for buying may be found as price zigzags higher, but the trader must look for optimum entry points. Conversely, exit points to preserve gains (or minimize losses) may be evident before the model mechanically closes the signal.
Helpful DecisionPoint Links:
DecisionPoint Shared ChartList and DecisionPoint Chart Gallery
Price Momentum Oscillator (PMO)
Swenlin Trading Oscillators (STO-B and STO-V)


