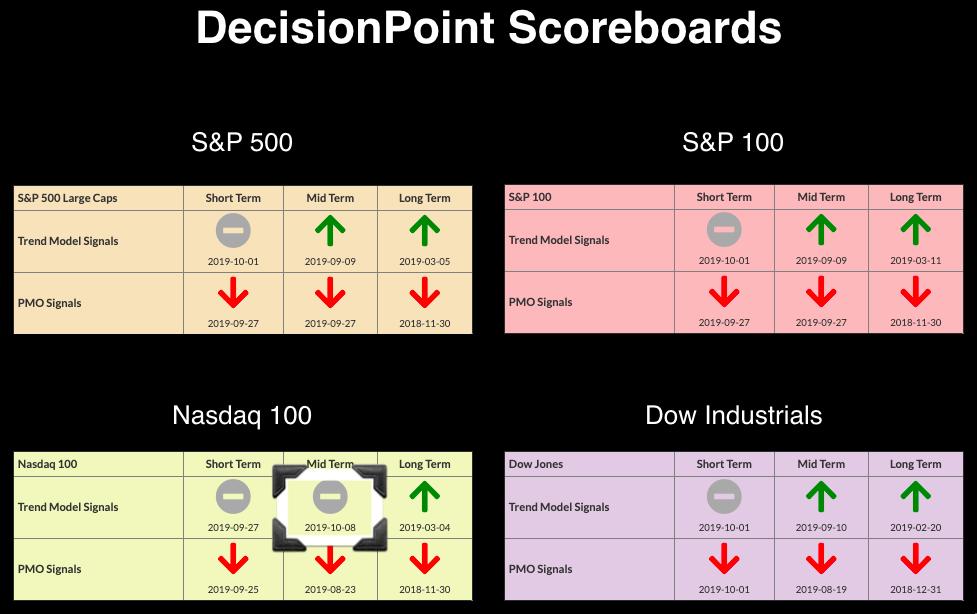
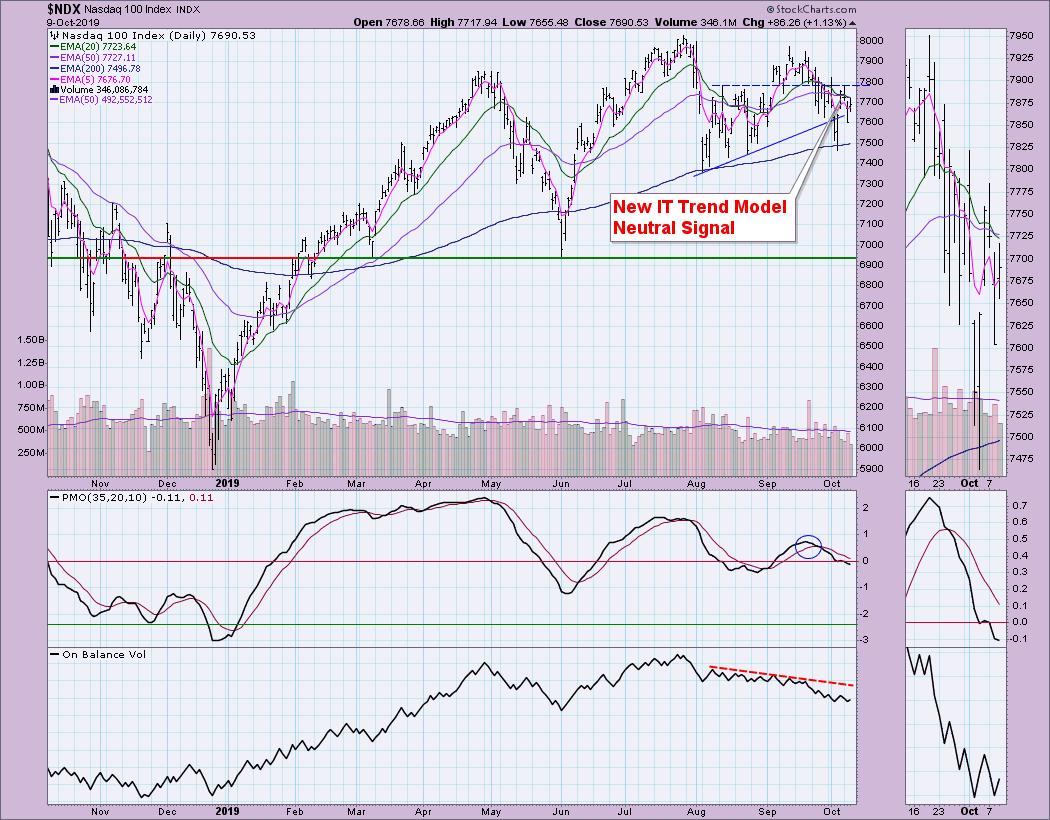
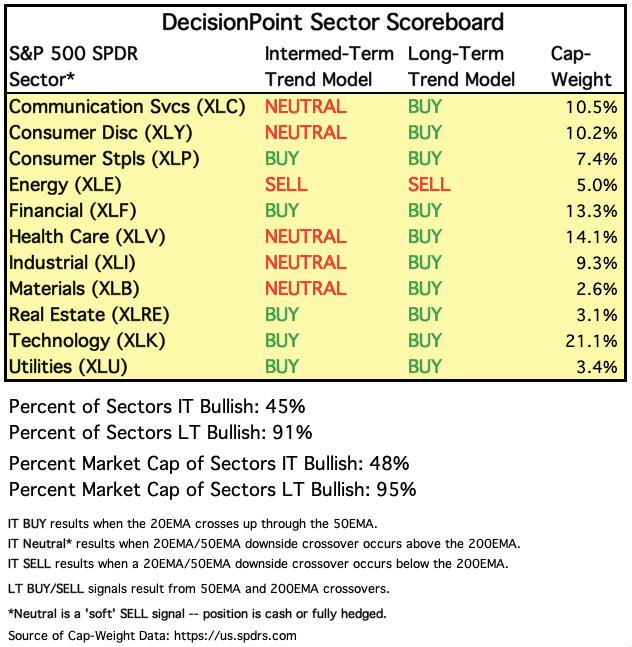
We had a great rally in the markets today, but the DP Scoreboards clearly tell the tale that problems remain. In fact, yesterday we got an Intermediate-Term Trend Model Neutral signal on the NDX - and we will see the same signals on the other three shortly. These signals are triggered when the 20-EMA crosses below the 50-EMA while they are above the 200-EMA. Momentum is clearly negative in all timeframes. Further down, the DP Sector Scoreboard has been losing IT Trend Model BUY signals quickly in the intermediate term. I highly doubt the bottom is in. This is one of the reasons I've analyzed the Gold chart more closely and have determined that we should expect Gold to rise strongly again soon.
The DecisionPoint Alert presents a mid-week assessment of the trend and condition of the stock market (S&P 500), the U.S. Dollar, Gold, Crude Oil and Bonds.
Watch the latest episode of DecisionPoint on StockCharts TV's YouTube channel here!
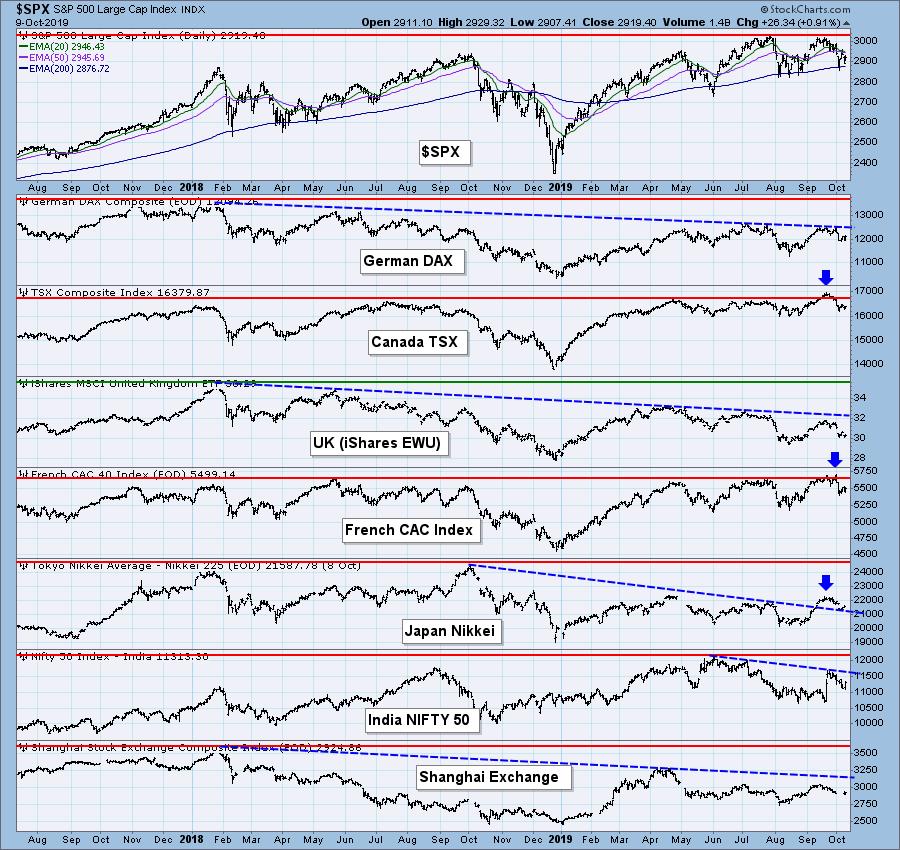
GLOBAL MARKETS
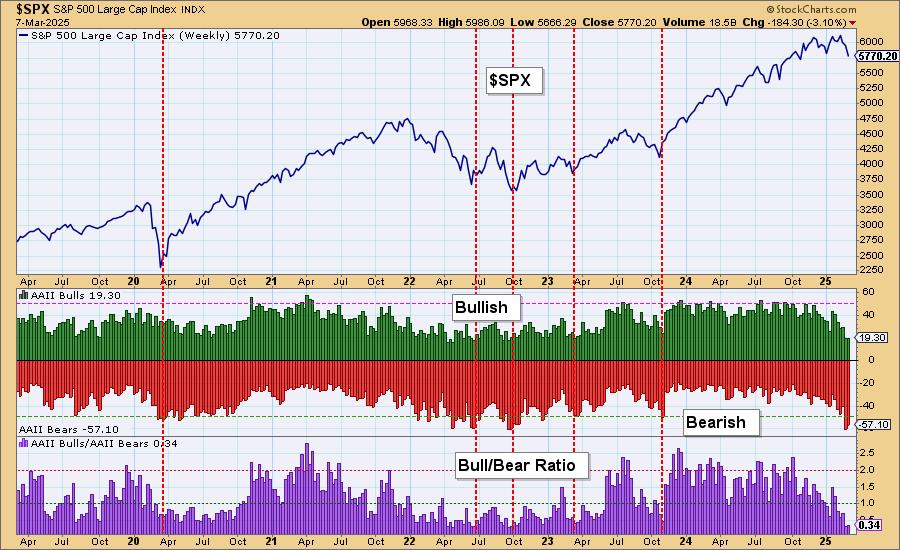
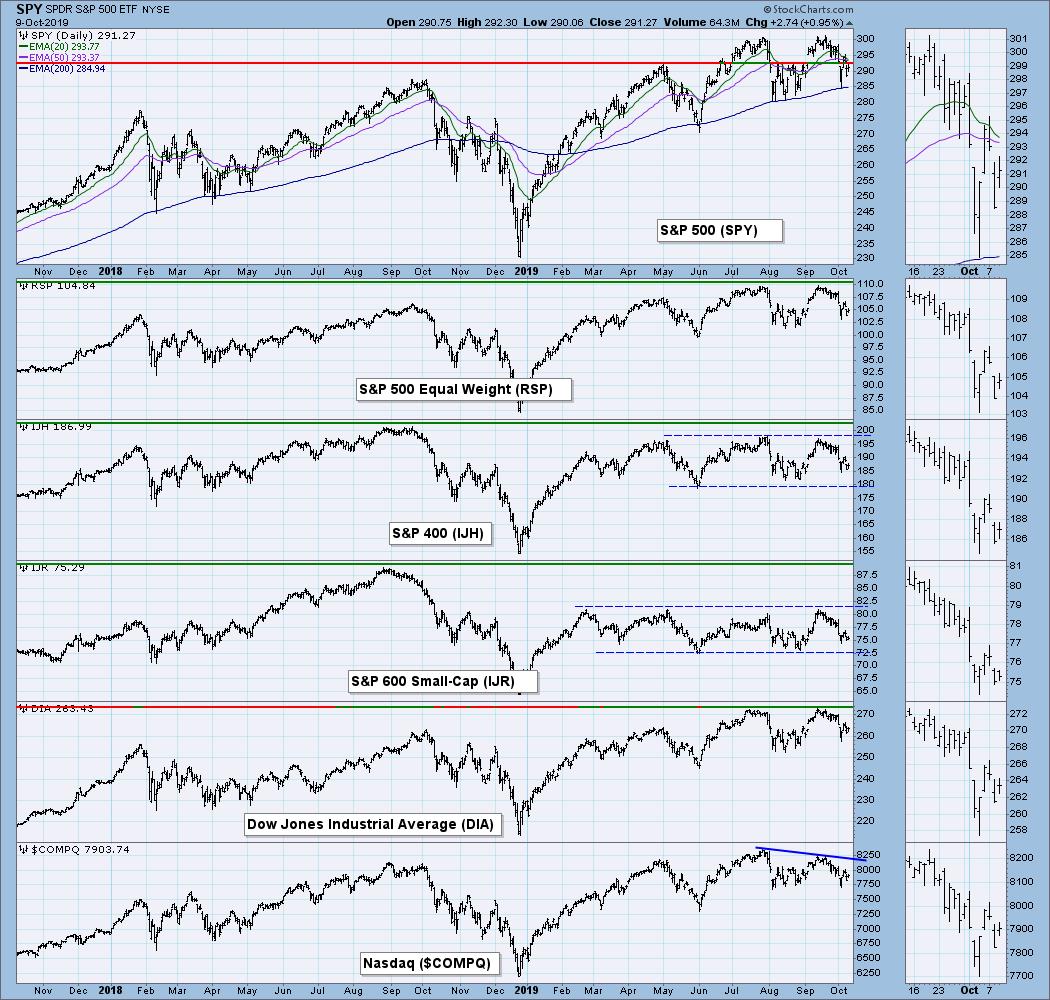
BROAD MARKET INDEXES
The important thing to note on this chart is the declining tops trend line on the Nasdaq.
SECTORS
Each S&P 500 Index component stock is assigned to one, and only one, of eleven major sectors. This is a snapshot of the Intermediate-Term and Long-Term Trend Model signal status for those sectors.
STOCKS
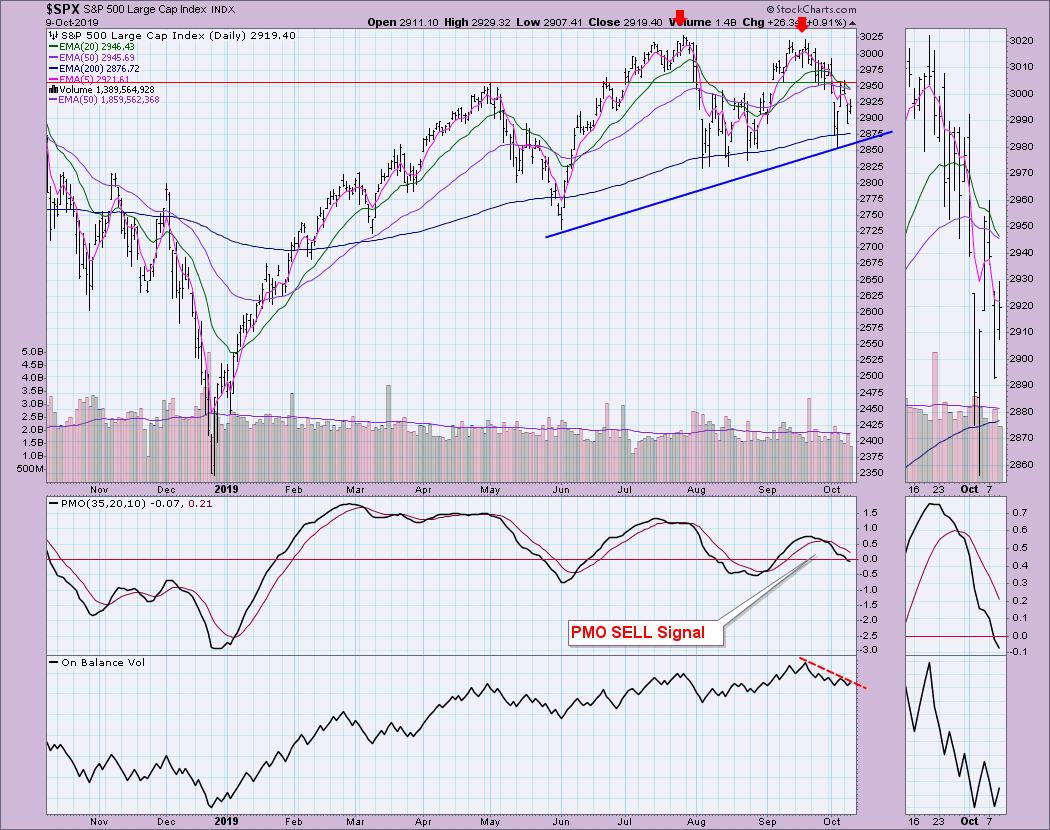
IT Trend Model: BUY as of 9/4/2019
LT Trend Model: BUY (SPY) as of 2/26/2019
SPX Daily Chart: The IT Trend Model nearly triggered an IT Trend Model Neutral signal. It is clear in the thumbnail that this signal will change tomorrow. The only way for the SPX to prevent this signal is to close above the 20-EMA. That's certainly possible if we see a strong follow-on rally tomorrow, but I'm not convinced when I review the indicator charts. Also, note that we have a very large double-top formation, visible on most charts that follow the broad markets closely. I did an article last Friday in the ChartWatchers blog on the very real bearish formations on the weekly charts of the FAANG stocks.
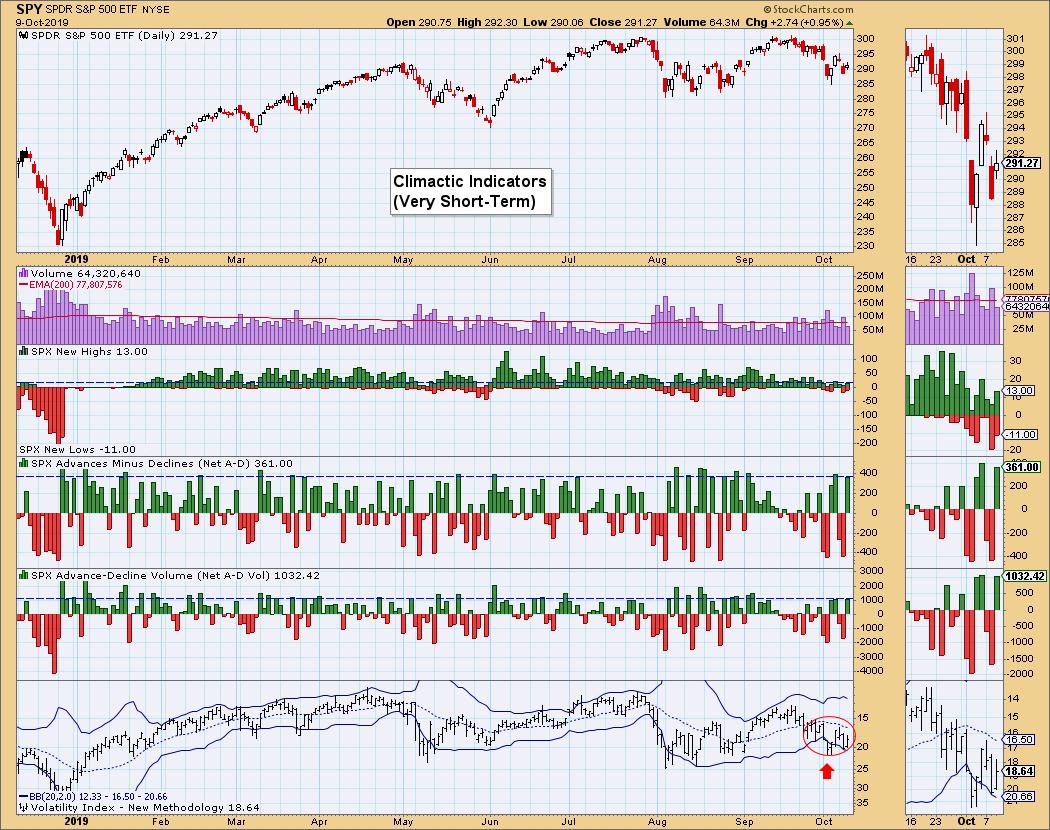
Climactic Market Indicators: We did see some climactic readings on the Net A-D breadth windows and the VIX is near the bottom of the Bollinger Band. Generally, I might look at this as a buying initiation, but given the VIX's oscillation below its moving average (on the inverted scale), I see too much weakness for this rally to culminate in anything spectacular. Notice the lack of volume on this move as well. I'm not impressed.
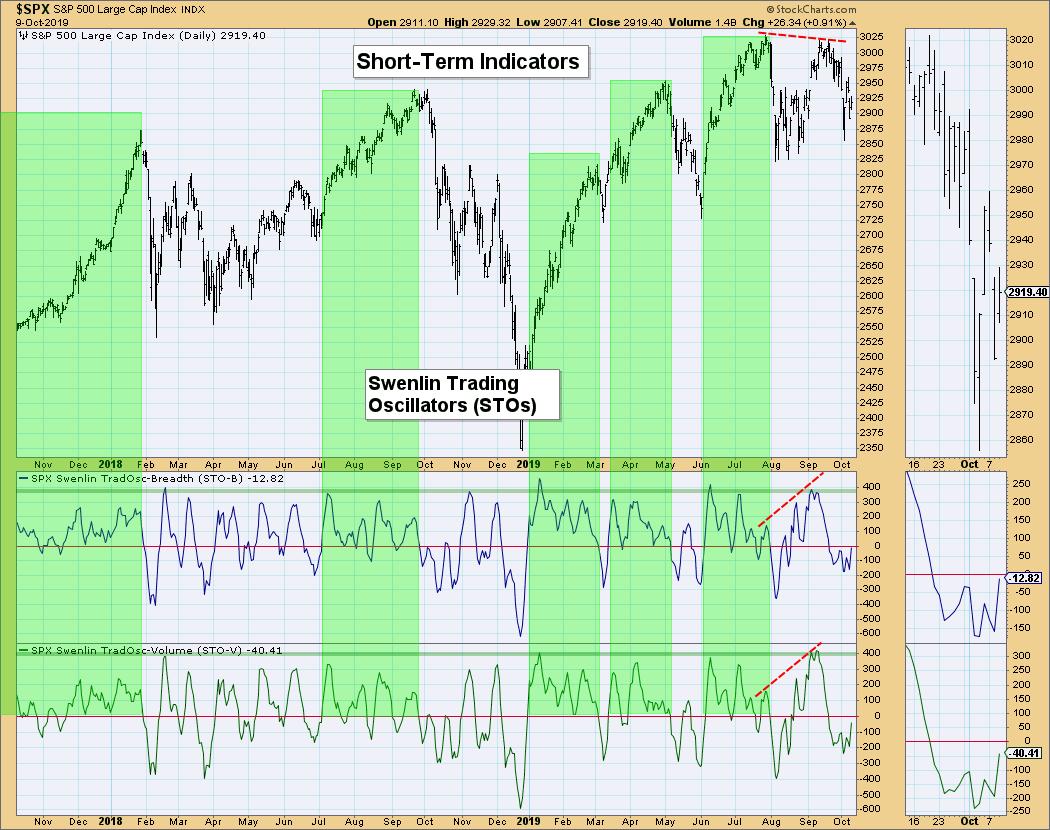
Short-Term Market Indicators: It is generally a good thing to see these oscillators making their way higher, but both have been unable to get back above the zero line. We could certainly see that this time around if this rally does see a continuation. This has the feel of October readings where we saw oscillation below the zero line. While we did see a rally, it proved short-lived once the readings got above the zero line.
Intermediate-Term Market Indicators: Nothing good here. The ITBM has now joined its sister ITVM under the zero line. Both indicators are careening lower with little hesitation or deceleration. This tells me there is more downside to look forward to.

Conclusion: The market is trying to recuperate from the latest correction. Indicators suggest we will see more downside. Additionally, when I look at that DP Sector Scoreboard losing all of those BUY signals, it screams broad market weakness. Keep an eye on those DecisionPoint Scoreboards (you'll find them on your Dashboard if you select them from the drop-down on one of your "tiles"). Those IT BUY signals are not going to be there at the end of the week.
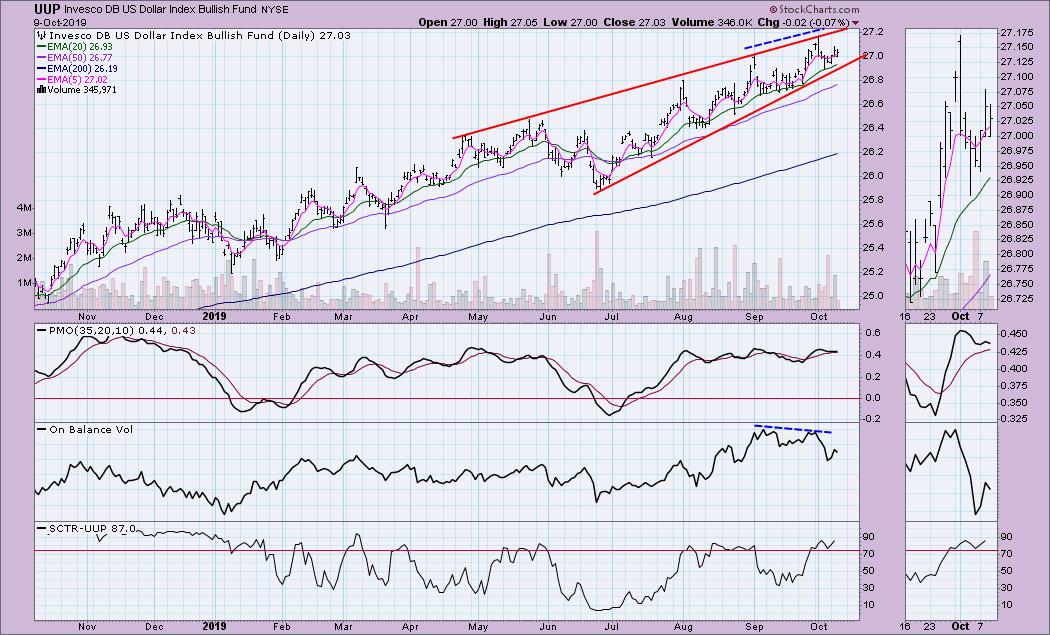
DOLLAR (UUP)
IT Trend Model: BUY as of 2/7/2019
LT Trend Model: BUY as of 5/25/2018
UUP Daily Chart: This is getting old. That rising wedge has yet to execute and I'm becoming impatient. If it doesn't resolve soon, price will simply drift out of the pattern. The PMO has flattened because the acceleration of the rising trend has been steady. A PMO negative crossover seems imminent, but it is taking its sweet time. The OBV certainly suggests a breakdown is on its way. The SCTR is in the "hot zone," but I'm not impressed with the rest of the chart. I'm still looking for a breakdown.
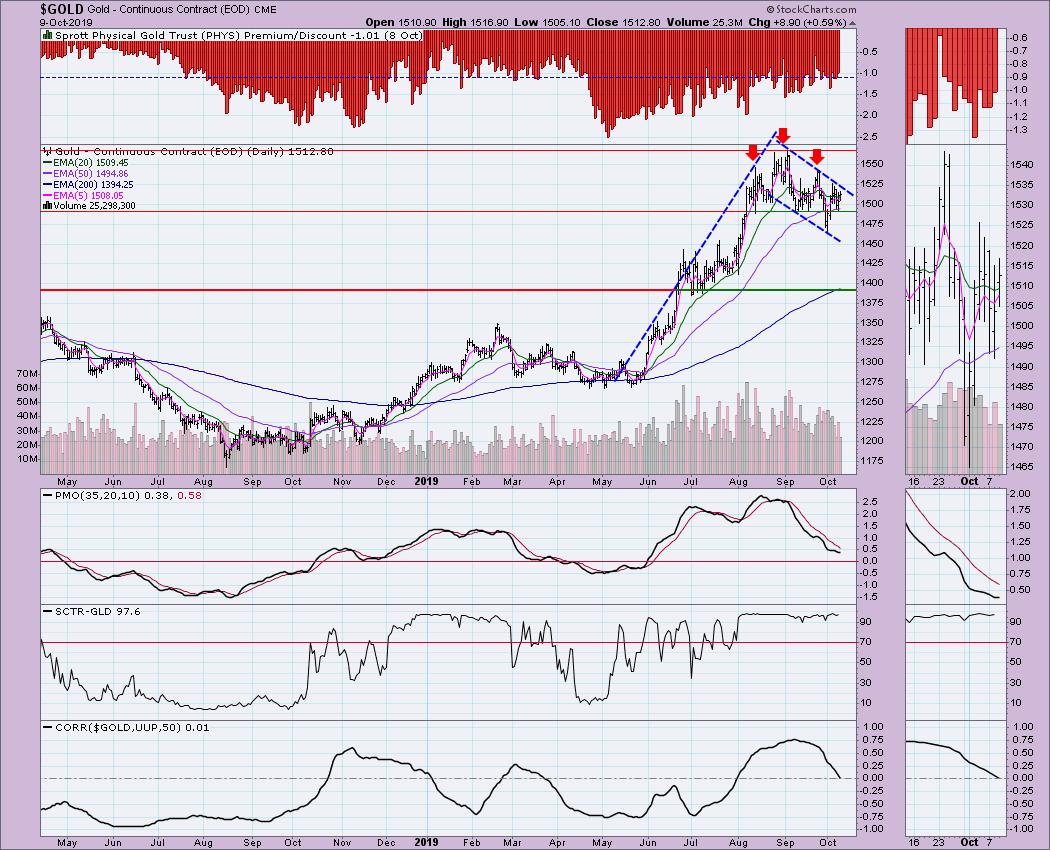
GOLD
IT Trend Model: BUY as of 6/3/2019
LT Trend Model: BUY as of 1/8/2019
GOLD Daily Chart: I left the red arrows above what I had originally thought was a head-and-shoulders pattern. It executed somewhat, then immediately turned back up and above the "neckline." At this point, I'm seeing a bullish flag formation. The expectation of this pattern is a breakout from the declining trend channel and a move higher that equals the height of the flagpole. That's a $300 move to the upside. I'm not that bullish on Gold, but a breakout and move higher makes sense to me given the weakness in the markets overall. Right now, the 50-MA of the correlation between Gold and the Dollar is near zero, meaning there is no correlation at all at the moment. Typically, if the Dollar drops, Gold rises (and vice versa). With a correlation near zero, they aren't currently tied that tightly. I do expect the Dollar to fall; in doing so, it will naturally help Gold (which is denominated in dollars), but I suspect there will be an excess of buyers as well. Take a look at the info below from this Kitco.com link. It tells you how much the dollar influenced Gold trading for the day. The goldbugs are fired up!
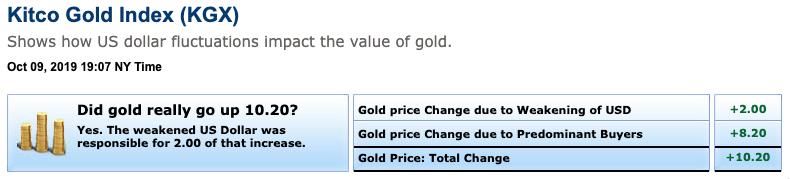
I'm looking for Gold to test overhead resistance at the August top.
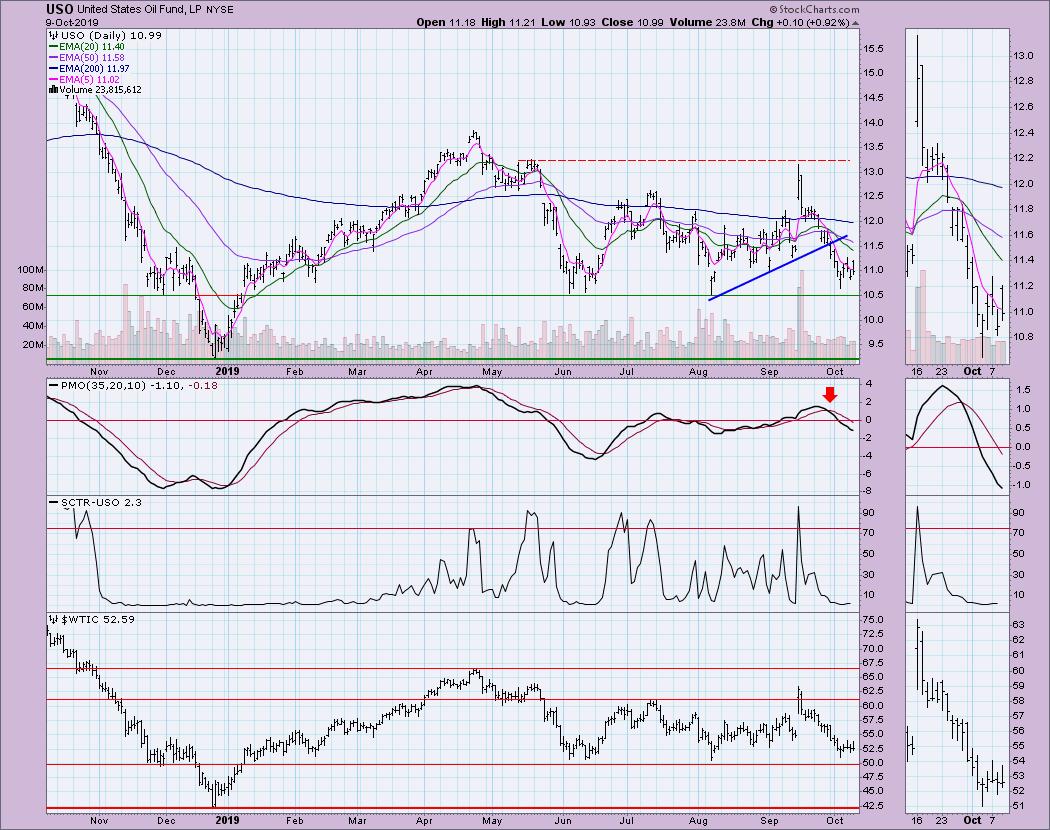
CRUDE OIL (USO)
IT Trend Model: BUY as of 9/16/2019
LT Trend Model: SELL as of 6/4/2019
USO Daily Chart: Not much to say here. The PMO has reached near-term "oversold" levels, but it isn't decelerating. The trading range is well-defined between $10.50 and $13.25. I don't see anything earth-shaking that would send USO below the $10.50 support level at this time.
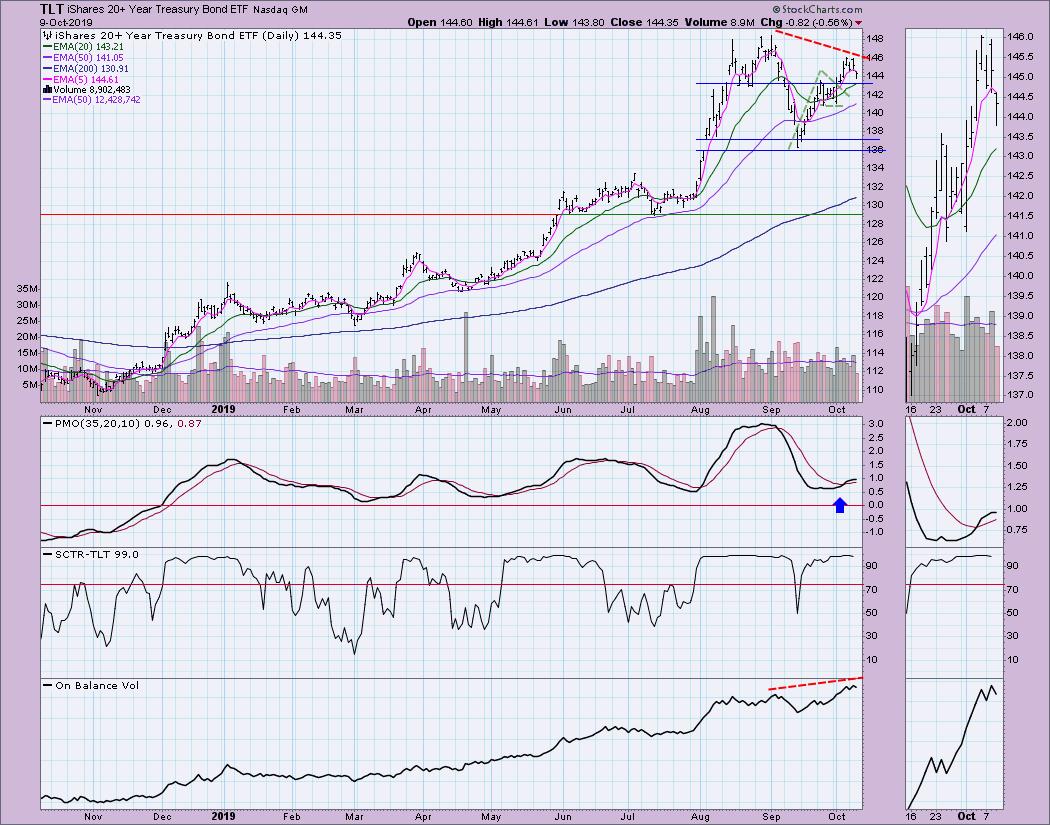
BONDS (TLT)
IT Trend Model: BUY as of 12/6/2018
LT Trend Model: BUY as of 1/2/2019
TLT Daily Chart: We got a new PMO BUY signal on TLT last week. The SCTR is very healthy. The only negative is that we have a reverse divergence between OBV tops and Price tops. Typically, price should follow volume. Note that the OBV has pushed above the level it was at during the September top. This tells us that, despite an influx of volume, price was unable to test those highs. I still see the flag pattern that formed in September and an overall rising trend. I expect we will see the August highs tested before long.
Technical Analysis is a windsock, not a crystal ball.
Happy Charting! - Erin
Email: erinh@stockcharts.com
**Don't miss any of the DecisionPoint commentaries! Go to the "Notify Me" box toward the end of this blog page to be notified as soon as they are published.**
NOTE: The signal status reported herein is based upon mechanical trading model signals, specifically the DecisionPoint Trend Model. These define the implied bias of the price index based upon moving average relationships, but they do not necessarily call for a specific action. They are information flags that should prompt chart review. Further, they do not call for continuous buying or selling during the life of the signal. For example, a BUY signal will probably (but not necessarily) return the best results if action is taken soon after the signal is generated. Additional opportunities for buying may be found as price zigzags higher, but the trader must look for optimum entry points. Conversely, exit points to preserve gains (or minimize losses) may be evident before the model mechanically closes the signal.
Helpful DecisionPoint Links:
DecisionPoint Shared ChartList and DecisionPoint Chart Gallery
Price Momentum Oscillator (PMO)
Swenlin Trading Oscillators (STO-B and STO-V)