About two weeks ago, my dad, Carl, pointed out that the FAANG stocks were forming some "impressive" bearish topping formations. I took a look and I have to agree. Despite a blow-out rally today, we both believe there is still trouble ahead. These charts in particular concern us, given the influence these stocks have on the broader markets; a few are especially bearish.
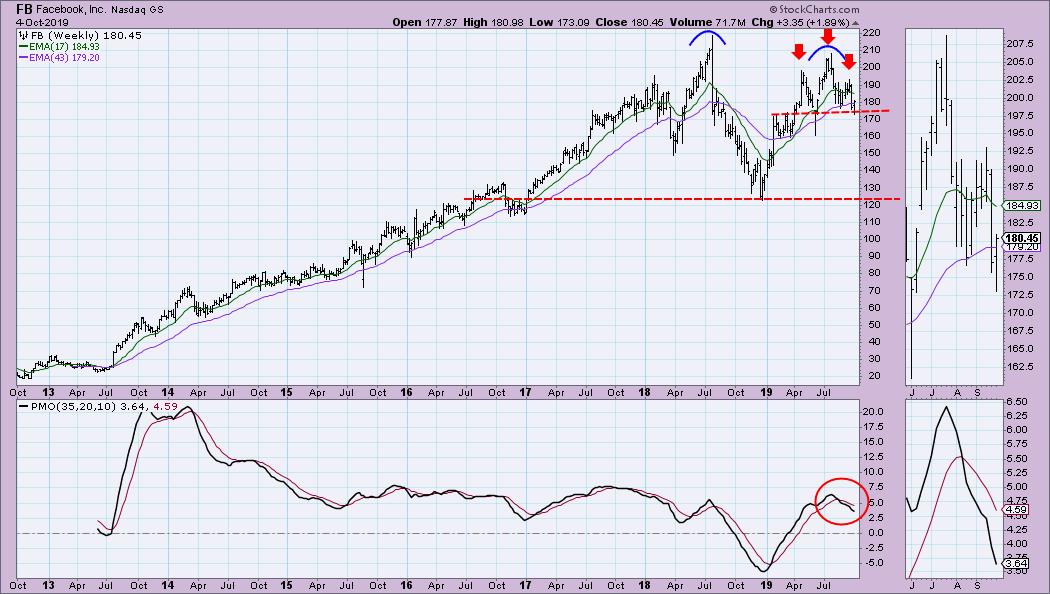
So, in their "FAANG" order, let's start with the weekly chart of Facebook (FB). This is one of the "especially" bearish weekly charts. Interestingly, we see a smaller head-and-shoulders pattern, with a minimum downside target that measures just above the confirmation line for the larger double-top pattern. The weekly PMO is in decline after a clean SELL signal.
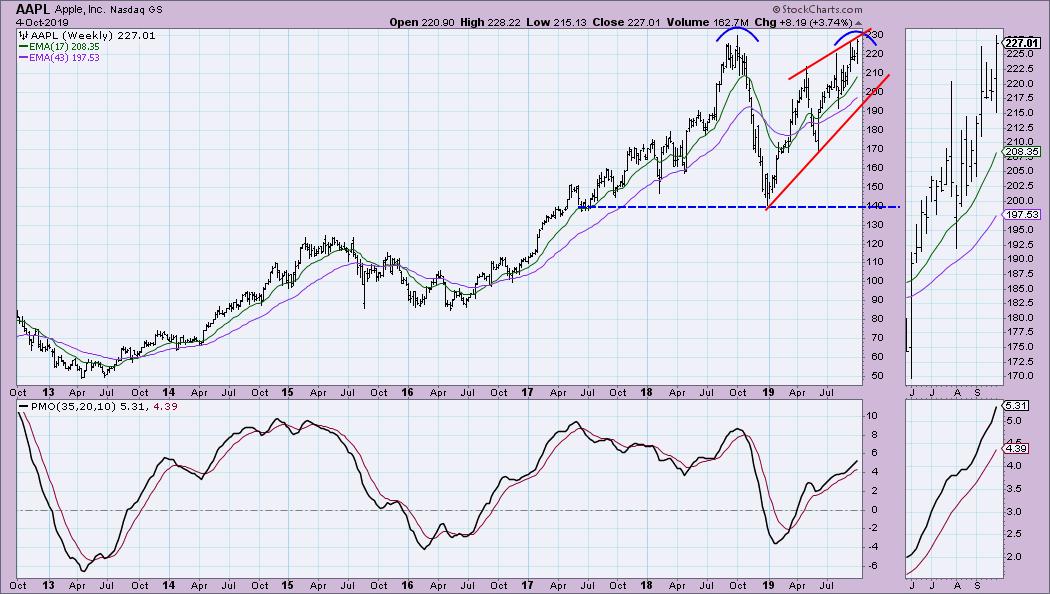
Apple (AAPL) is one of the charts that isn't horribly bearish, having not quite formed the second top of a possible double-top bearish pattern. The weekly PMO is rising, but... this last move toward a second top is a bearish rising wedge, which suggests a breakdown below the rising bottoms trend line. So, even though a large double-top has not formed, the rising wedge is a problem.
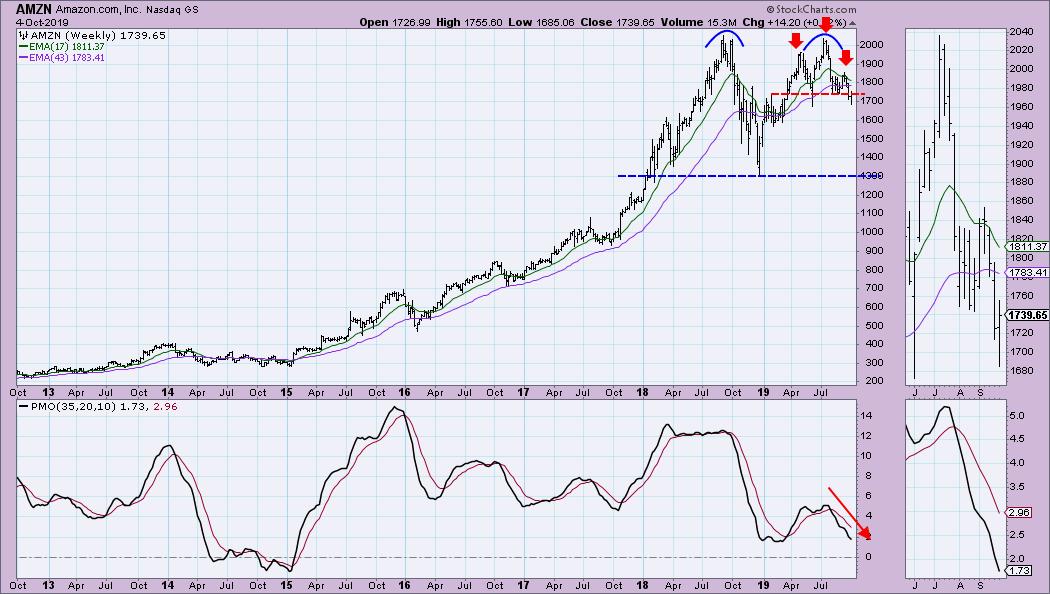
On Amazon (AMZN), we see a smaller head-and-shoulders pattern, just like Facebook. The minimum downside target would not take it down to the confirmation line of the bigger double-top, but I suspect that, if we saw that kind of move downward, it would eventually reach it.
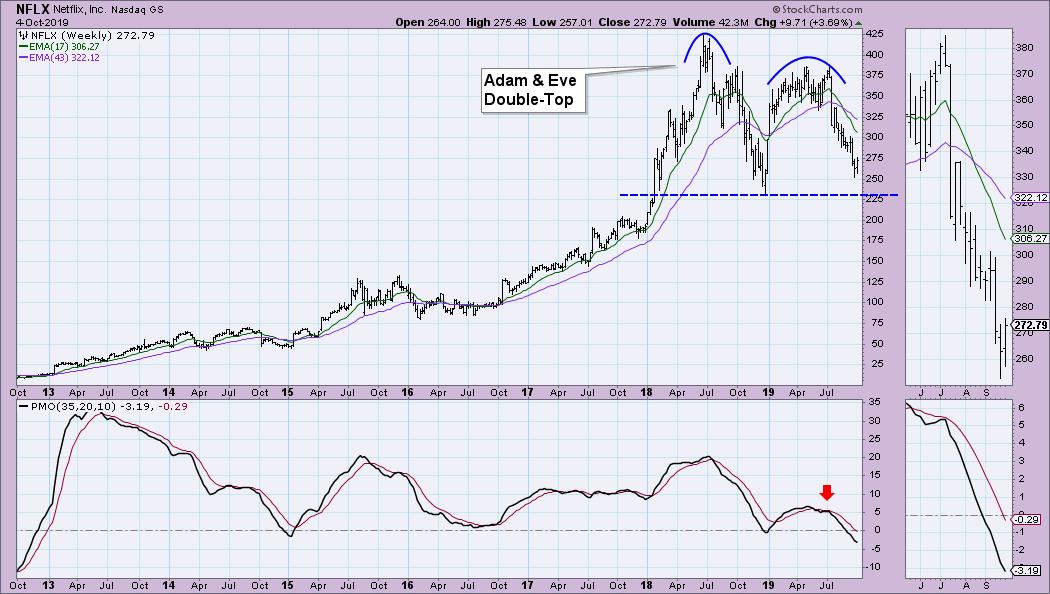
One of my favorite named double-top patterns, the Adam & Eve Double-Top, has clearly formed on Netflix (NFLX) and price is nearing the confirmation line. Should it execute this pattern, the minimum downside target would be, conservatively, $75. We already have a PMO that has delved farther below the zero line, all the way to a level we haven't seen since 2012.
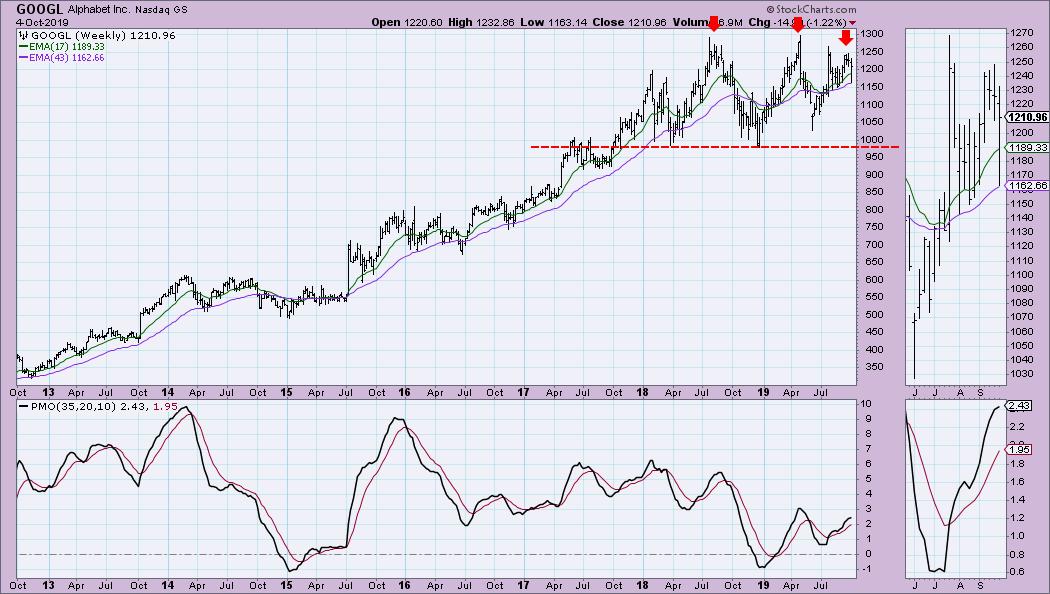
Google (GOOGL) is fairly healthy in comparison to the others, but I still see a multi-top bearish pattern. The PMO is decelerating. I would look for a move down to the $1000 level.
Conclusion: Not everyone will agree with my and Carl's assessment of these weekly charts, but it is hard to think bullish thoughts when you look closely at these charts. These stocks can shape how the broader markets move because of their capitalization and the volume they trade. They have led both rallies and downturns in the markets. I'm not suggesting these double-tops will fully execute, but price certainly seems ready to test confirmation lines on some of these stocks.
Watch the latest episode of DecisionPoint with Carl & Erin Swenlin LIVE on Fridays 4:30p EST or on the StockCharts TV YouTube channel here!
Technical Analysis is a windsock, not a crystal ball.
Happy Charting! - Erin
erinh@stockcharts.com
Helpful DecisionPoint Links:
DecisionPoint Shared ChartList and DecisionPoint Chart Gallery
Price Momentum Oscillator (PMO)
Swenlin Trading Oscillators (STO-B and STO-V)
**Don't miss DecisionPoint Commentary! Add your email below to be notified of new updates"**


