 It was a new top on the SPX as today's intraday was below yesterday's. This makes the third top of a possible triple-top, but, whether that pattern appears or not, this last price top is lower than the previous two. I am still considering the possibility of an ascending triangle on the SPX, which is bullish, but, with another lower top, I don't think we will see all-time highs this month. Oil rallied strongly today, so it wasn't surprising to see a new Price Momentum Oscillator (PMO) BUY signal. Read on for more complete analysis.
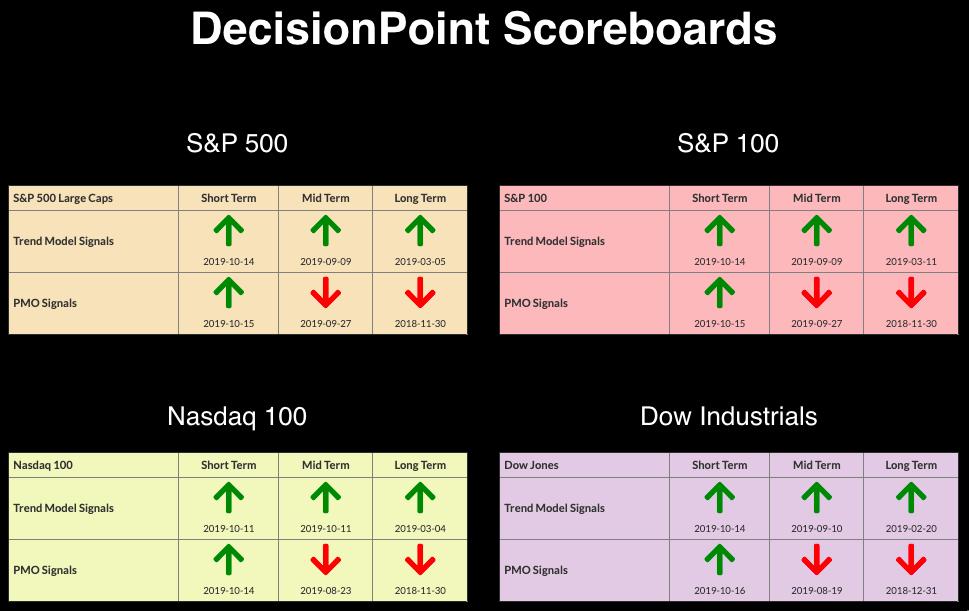
The DecisionPoint Alert presents a mid-week assessment of the trend and condition of the stock market (S&P 500), the U.S. Dollar, Gold, Crude Oil and Bonds.
Watch the latest episode of DecisionPoint on StockCharts TV's YouTube channel here!
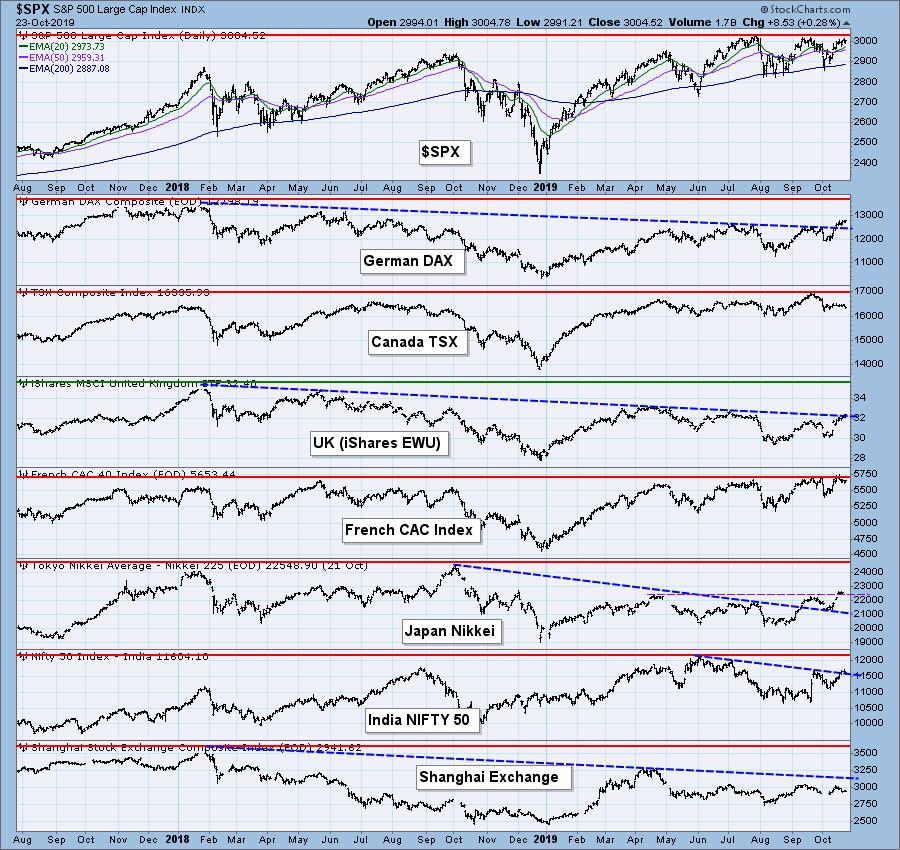
GLOBAL MARKETS
The Nikkei has broken above its 2019 high, but is still quite far from the all-time high back in 2018.
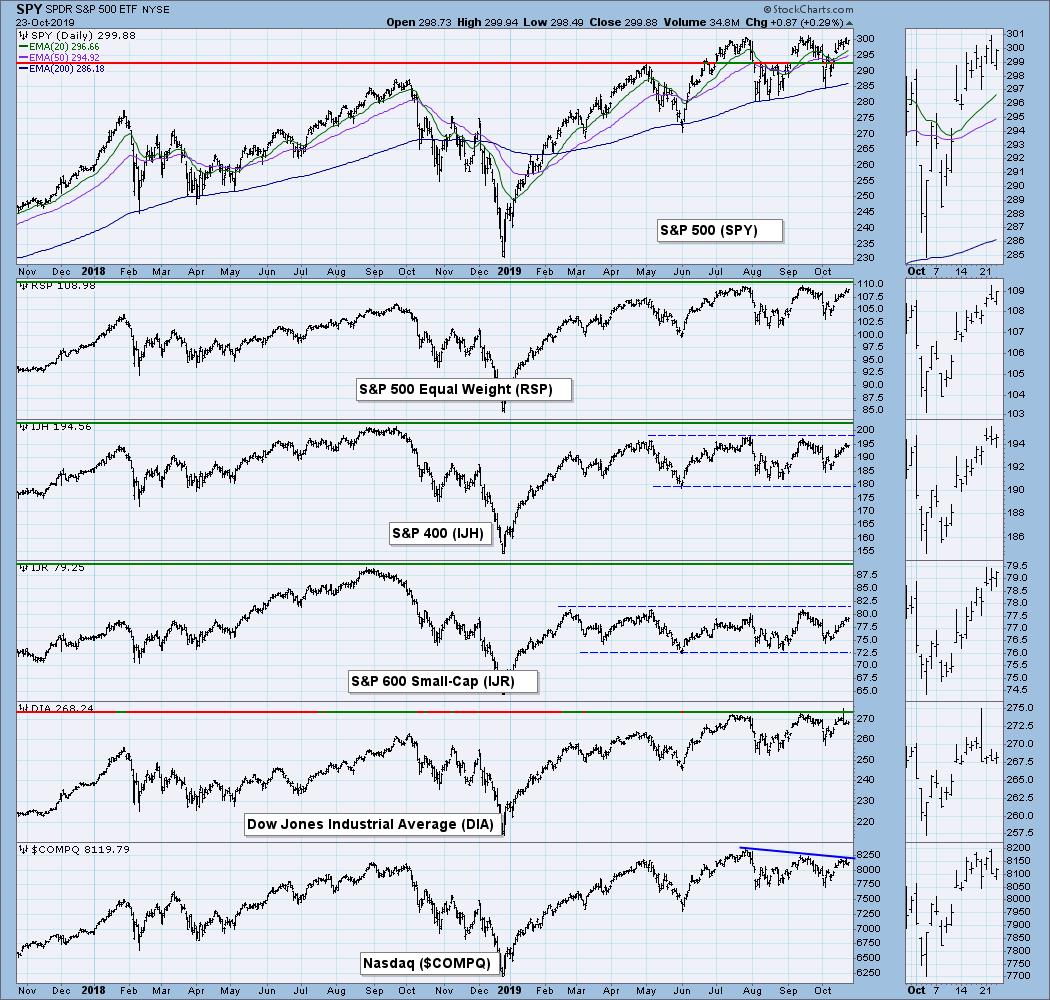
BROAD MARKET INDEXES
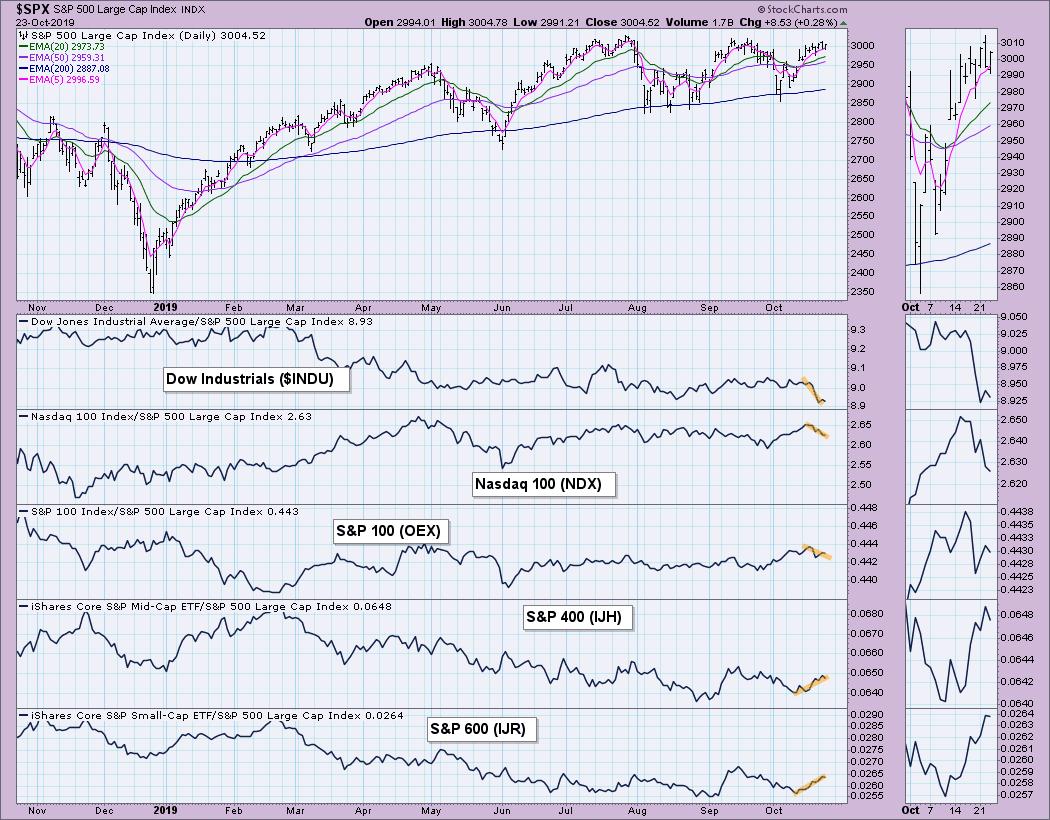
MARKET INDEXES PRICE RELATIVE TO SPX
I continue to be encouraged by the outperformance of small- and mid-cap indexes.
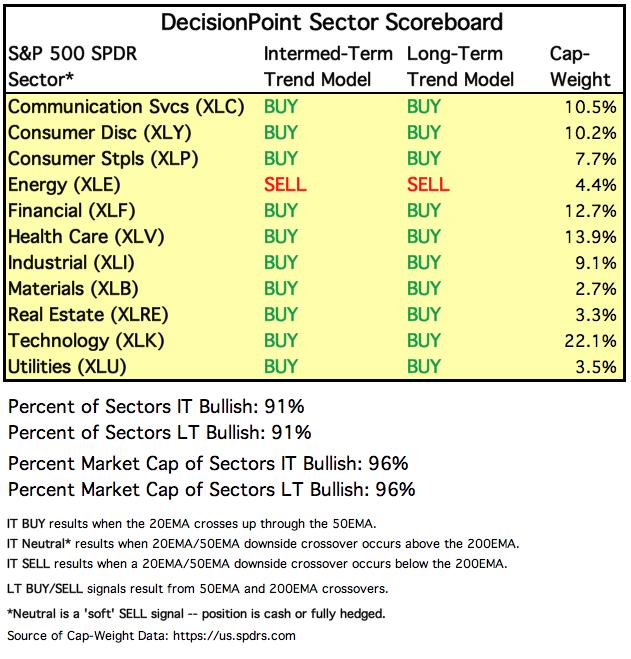
SECTORS
Each S&P 500 Index component stock is assigned to one, and only one, of eleven major sectors. This is a snapshot of the Intermediate-Term and Long-Term Trend Model signal status for those sectors.
STOCKS
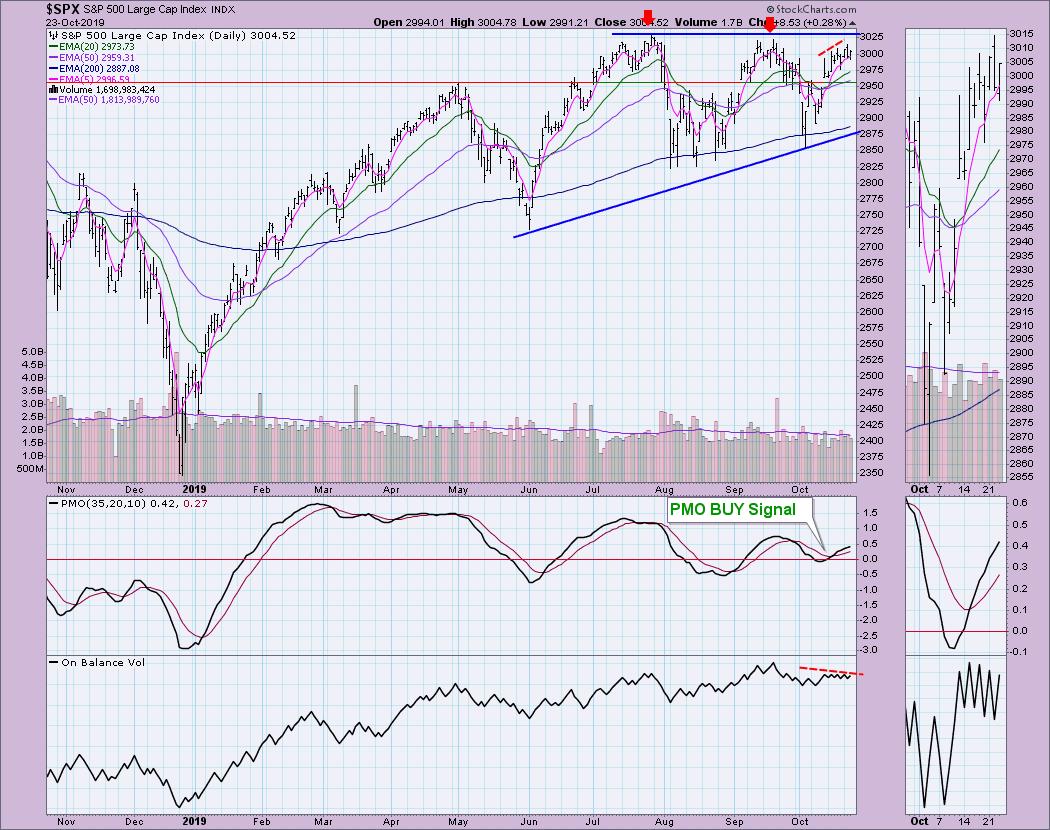
IT Trend Model: BUY as of 9/4/2019
LT Trend Model: BUY (SPY) as of 2/26/2019
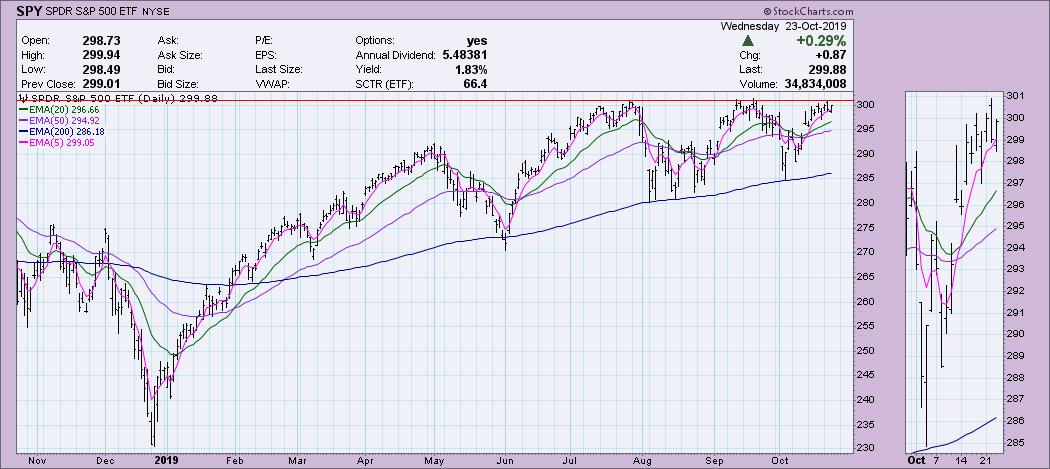
SPX Daily Chart: As you can see, we do technically have a declining tops trend line versus horizontal resistance, but, if you look at a chart of the SPY (2nd chart below), it did reach an all-time intraday high on that second top. The OBV is showing a negative divergence (declining OBV tops and rising price tops) that is most visible in the thumbnail.
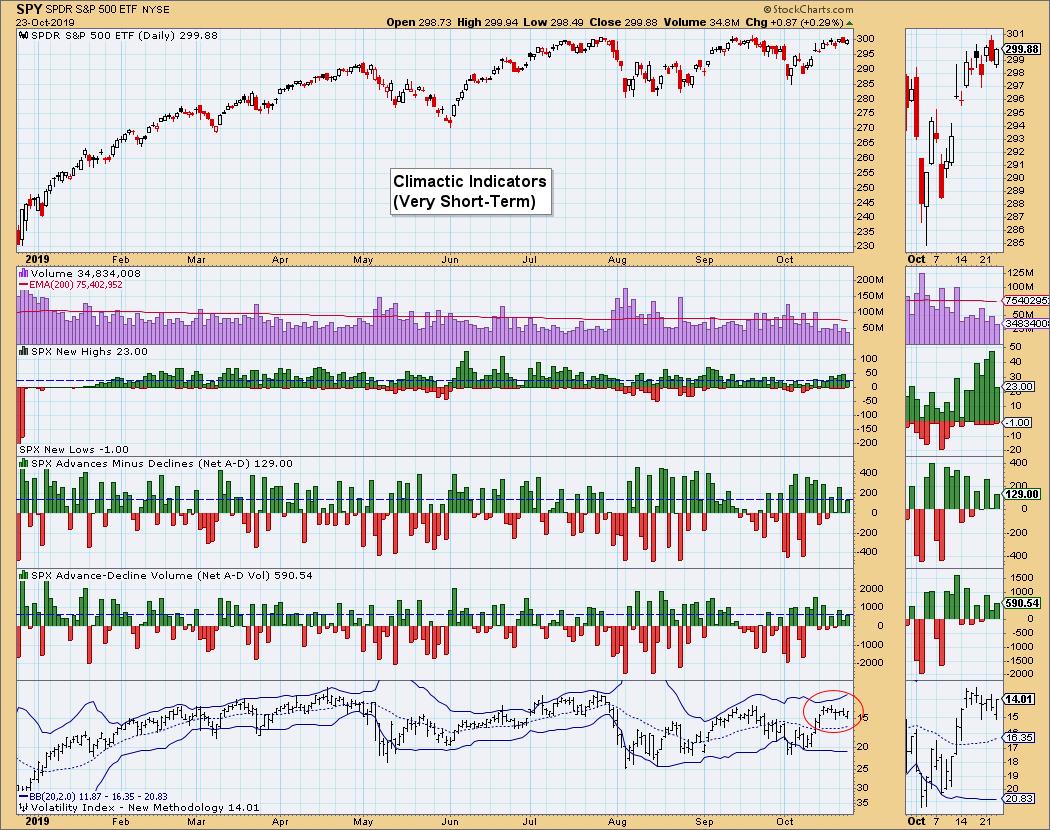
Climactic Market Indicators:
The VIX is oscillating above its average on the inverted scale. Unfortunately, it is trending lower, which generally turns into lower prices. No other climactic activity to note. SPX volume is continuing to trend lower.
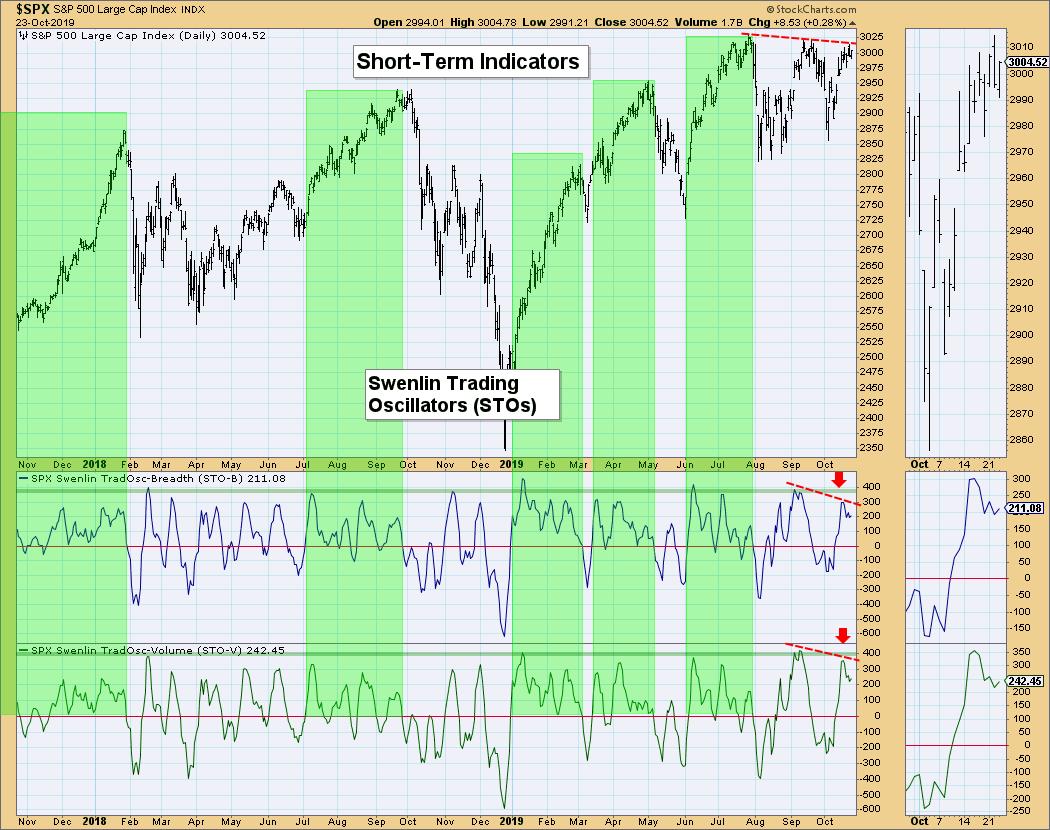
Short-Term Market Indicators: These indicators have been twitching and in decline, despite price moving higher since the gap up. That is bearish.
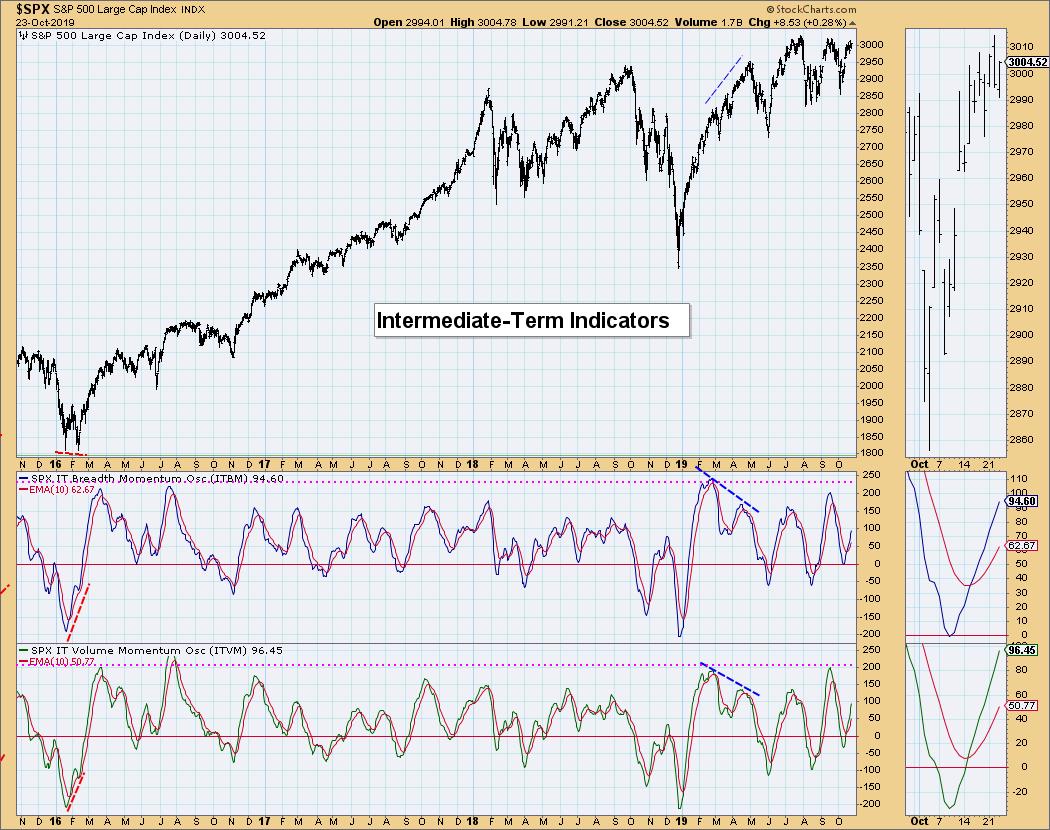
Intermediate-Term Market Indicators: The rosy chart right now is the chart of our DecisionPoint indicators, ITBM and ITVM. There isn't any twitch to be seen here and they are rising strongly. This does suggest the ascending triangle that I annotated on the SPX chart could be accurate and hints at a move to all-time highs.
Conclusion: Looking at the possible intermediate-term ascending triangle on the SPX/SPY, combined with the rising intermediate-term indicators (ITBM/ITVM), I have to consider price breaking to new all-time highs. However, seeing the current struggle price is having to even reach all-time highs, I have to remain cautious.
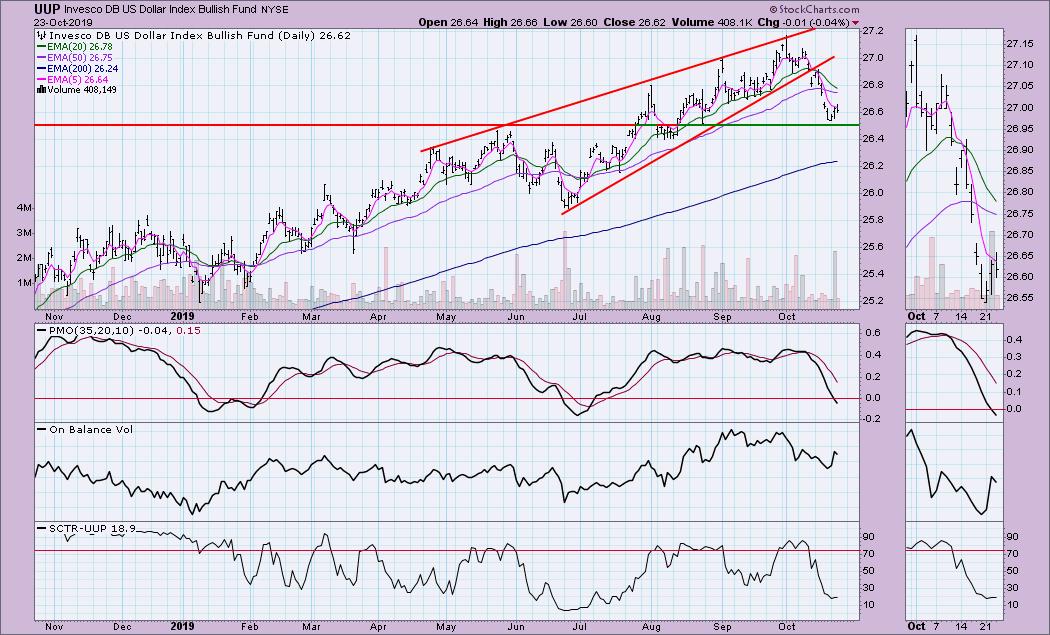
DOLLAR (UUP)
IT Trend Model: BUY as of 2/7/2019
LT Trend Model: BUY as of 5/25/2018
UUP Daily Chart: We FINALLY got the breakdown from the rising wedge on UUP. It has now bounced on support formed by the May high. The PMO is now in near-term oversold territory, so this bounce off support could turn into more.
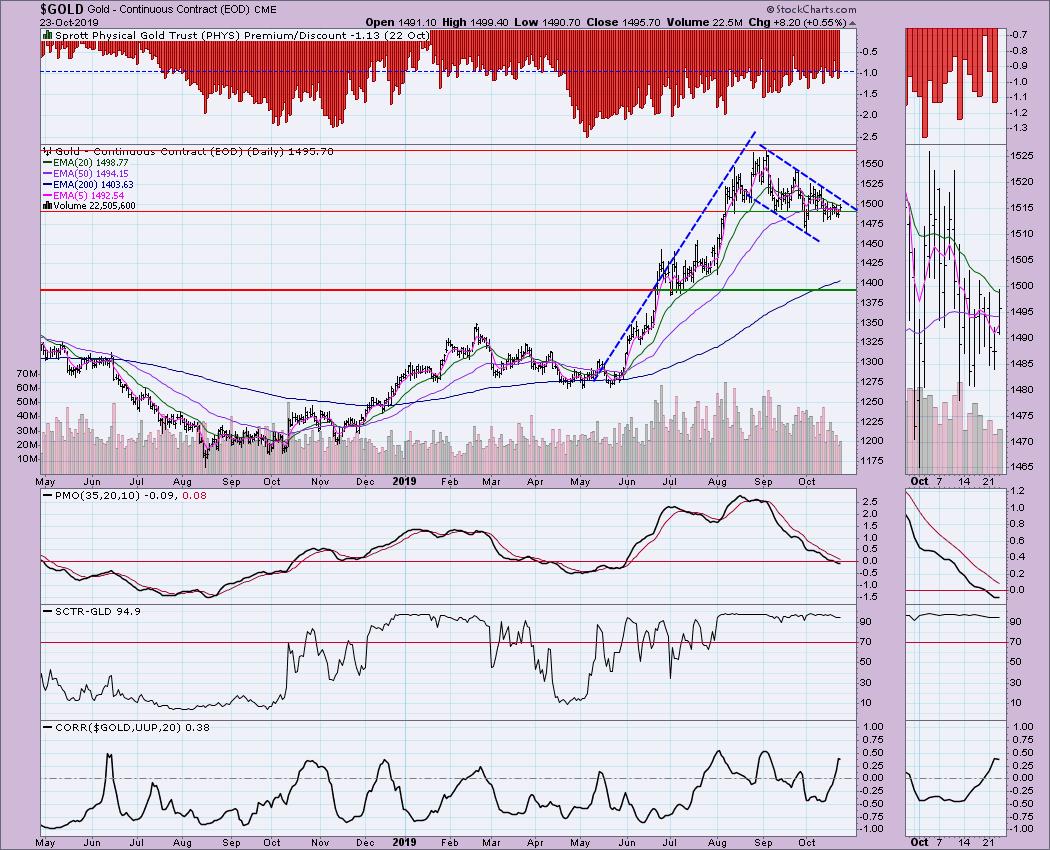
GOLD
IT Trend Model: BUY as of 6/3/2019
LT Trend Model: BUY as of 1/8/2019
GOLD Daily Chart: Gold has been in a declining trend channel the past few months. I've annotated it as a flag. While I don't expect it to reach the minimum upside target of around $1800, should it execute on a breakout, I am looking for price to resolve to the upside and make a run for $1575.
CRUDE OIL (USO)
IT Trend Model: SELL as of 10/2/2019
LT Trend Model: SELL as of 6/4/2019
USO Daily Chart: The nearly 2.75% rally on Oil today easily pushed the PMO over its signal line. I like that volume is rising with price (which is easier to see in thumbnail). Today, rally pushed price well above the 50-EMA. The next challenge will be the 200-EMA. It is likely we will see a pullback tomorrow, but price remains in a nice rising trend channel, so I expect to see it continue to rise.
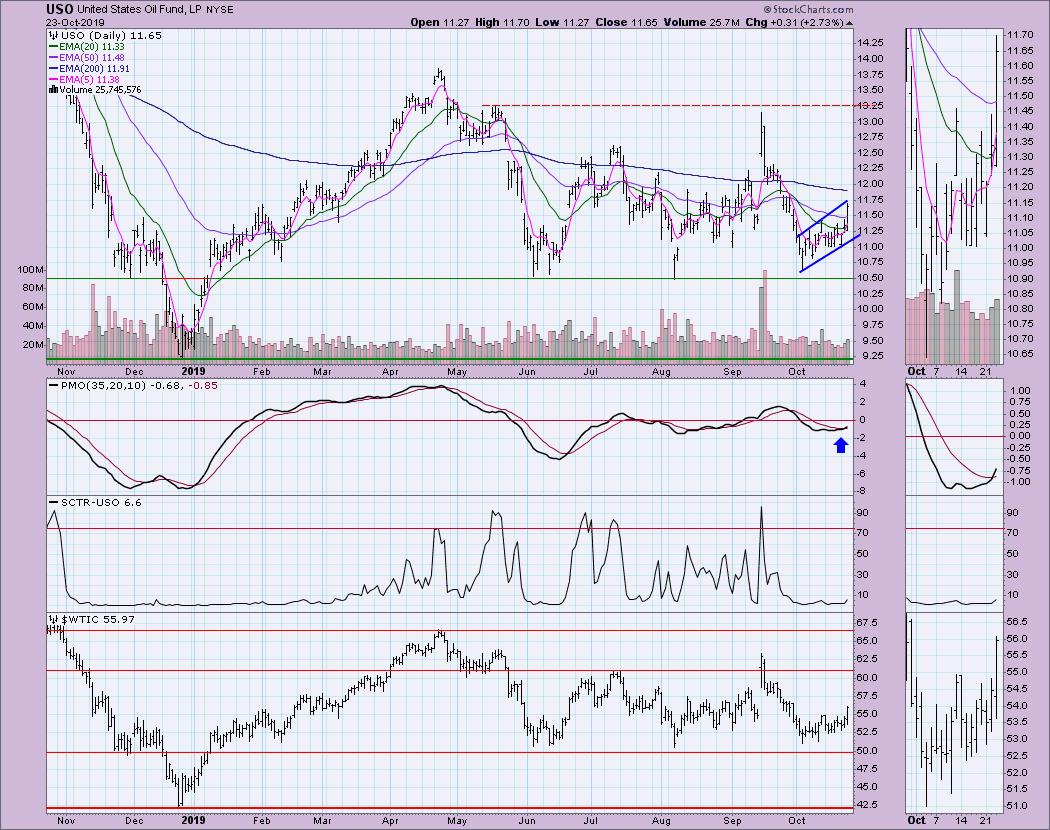
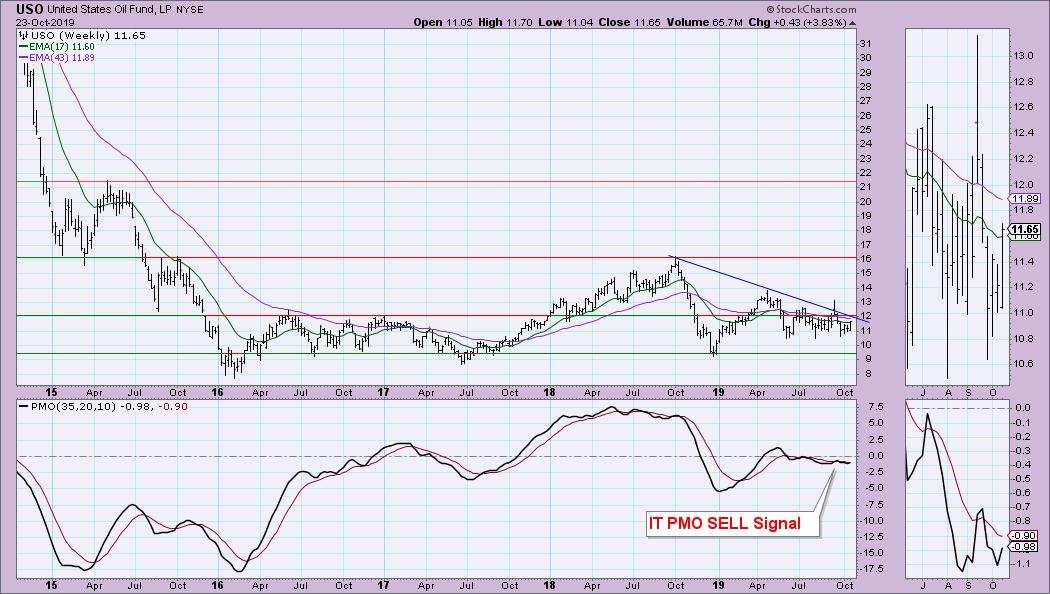
Price hasn't broken the intermediate-term declining tops trend line, but the PMO is trying to move to a BUY signal.
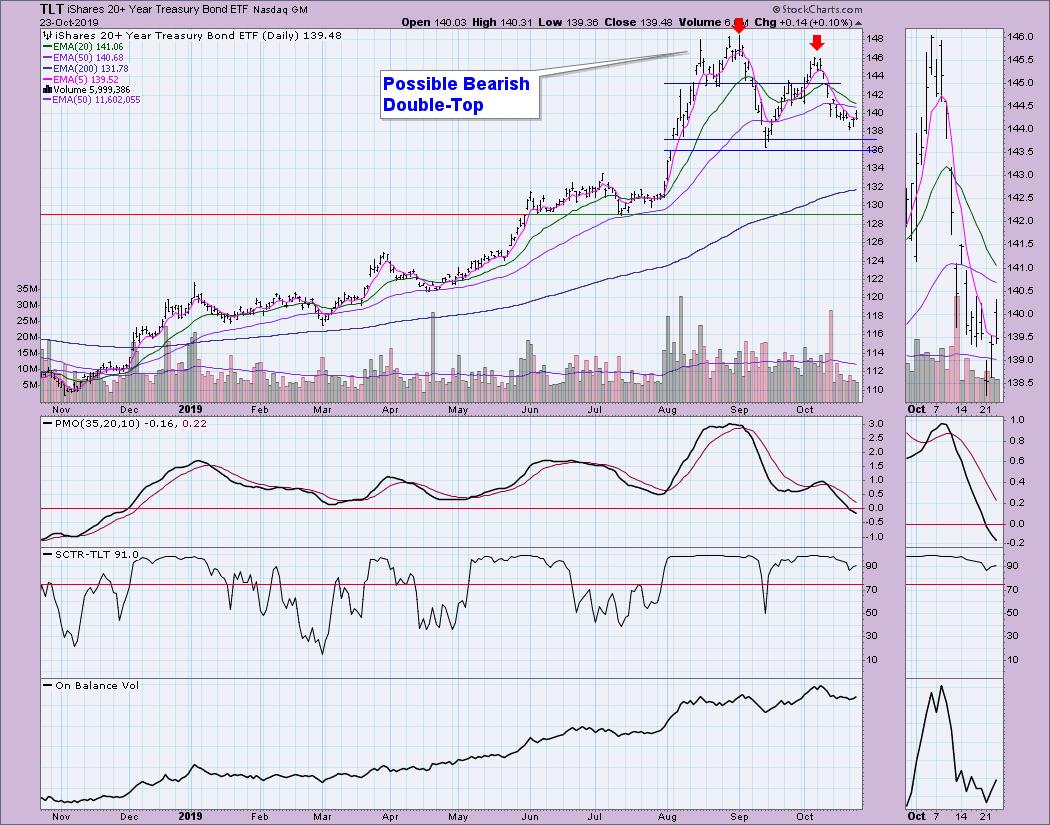
BONDS (TLT)
IT Trend Model: BUY as of 12/6/2018
LT Trend Model: BUY as of 1/2/2019
TLT Daily Chart: The double-top is still in play but, with price bouncing higher before it really tested the confirmation line, I'm not so sure it will resolve to the downside yet. Price closed near the lows on the day, so this rally could already be exhausted. The 20-EMA is reaching down toward the 50-EMA. A negative crossover would trigger an IT Trend Model Neutral signal.
Technical Analysis is a windsock, not a crystal ball.
Happy Charting! - Erin

SAVE THE DATE!!
Erin Swenlin will be presenting at the TradersExpo in New York City on March 15-17, 2020! You'll have an opportunity to meet Erin and discuss the latest DecisionPoint news and Diamond Scans. The conference is free to attend or view online!
Email: erinh@stockcharts.com
**Don't miss any of the DecisionPoint commentaries! Go to the "Notify Me" box toward the end of this blog page to be notified as soon as they are published.**
NOTE: The signal status reported herein is based upon mechanical trading model signals, specifically the DecisionPoint Trend Model. These define the implied bias of the price index based upon moving average relationships, but they do not necessarily call for a specific action. They are information flags that should prompt chart review. Further, they do not call for continuous buying or selling during the life of the signal. For example, a BUY signal will probably (but not necessarily) return the best results if action is taken soon after the signal is generated. Additional opportunities for buying may be found as price zigzags higher, but the trader must look for optimum entry points. Conversely, exit points to preserve gains (or minimize losses) may be evident before the model mechanically closes the signal.
Helpful DecisionPoint Links:
DecisionPoint Shared ChartList and DecisionPoint Chart Gallery
Price Momentum Oscillator (PMO)
Swenlin Trading Oscillators (STO-B and STO-V)


