
I found more "Momentum Sleepers" today with the scan of the same name. Quite a few have weekly charts that are encouraging. So, even though the stocks on this scan are "beat down" and likely best for shorter-term investors, I found stocks with bullish weekly charts that the intermediate-term investor might be interested find interesting too. Enjoy!
I love to get your feedback on these reports, so shoot me an email at erinh@stockcharts.com. I read every one of them!
Welcome to "DecisionPoint Daily Diamonds," a newsletter in which I highlight five "diamonds in the rough" taken from the results of one of my DecisionPoint scans. Remember, these are not recommendations to buy or sell, but simply stocks that I found interesting. The objective is to save you the work of the initial, tedious culling process, but you need to apply your own analysis to see if these stocks pique your interest as well. There are no guaranteed winners here!
Current Market Outlook:
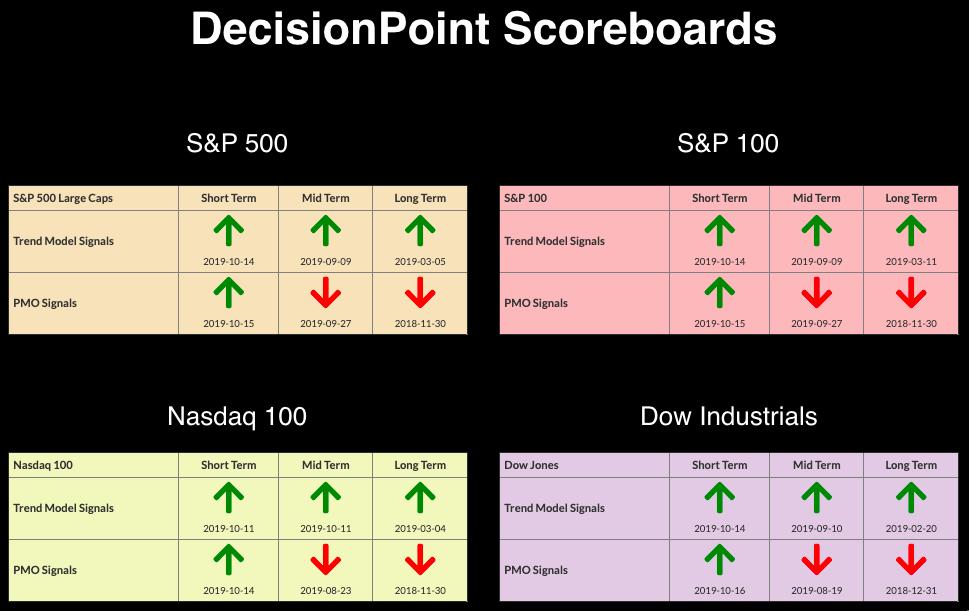
Market Trend: Currently, we have Trend Model BUY signals in all three timeframes on the DP Scoreboard Indexes.
Market Condition: The market is overbought and struggling to reach all-time highs, despite Price Momentum Oscillator (PMO) BUY signals on the DP Scoreboards. Caution is still warranted.
Market Environment: It is important to consider the odds for success. Here are the current percentages on the Silver and Golden Cross Indexes:
- Silver Cross: 61.4% SPX ITTM Buy Signals (20-EMA > 50-EMA)
- Golden Cross: 66.4% SPX LTTM Buy Signals (50-EMA > 200-EMA)
Diamond Index:
- Diamond Scan Results: 14
- Diamond Dog Scan Results: 15
- Diamond Bull/Bear Ratio: 0.93
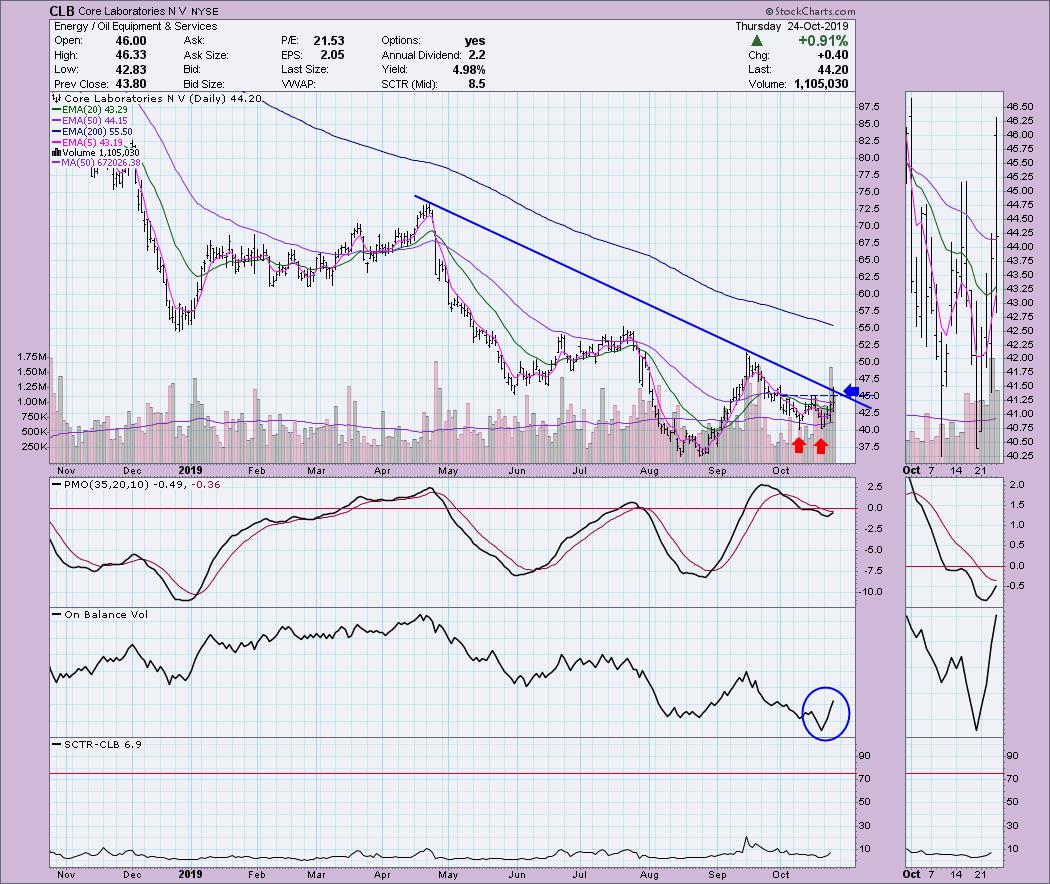
Core Laboratories (CLB) - Earnings: 10/23/2019
I see a short-term double-bottom that executed intraday, but price fell below that confirmation line at the close. It nearly broke its declining trend today as well. CLB only just reported earnings, so you're safe from price shocks that sometimes occur on earnings. The volume has been coming in strongly, which is clear when you see the OBV spike. Because these "Momentum Sleepers" are beat down, you won't likely see great SCTR rankings.
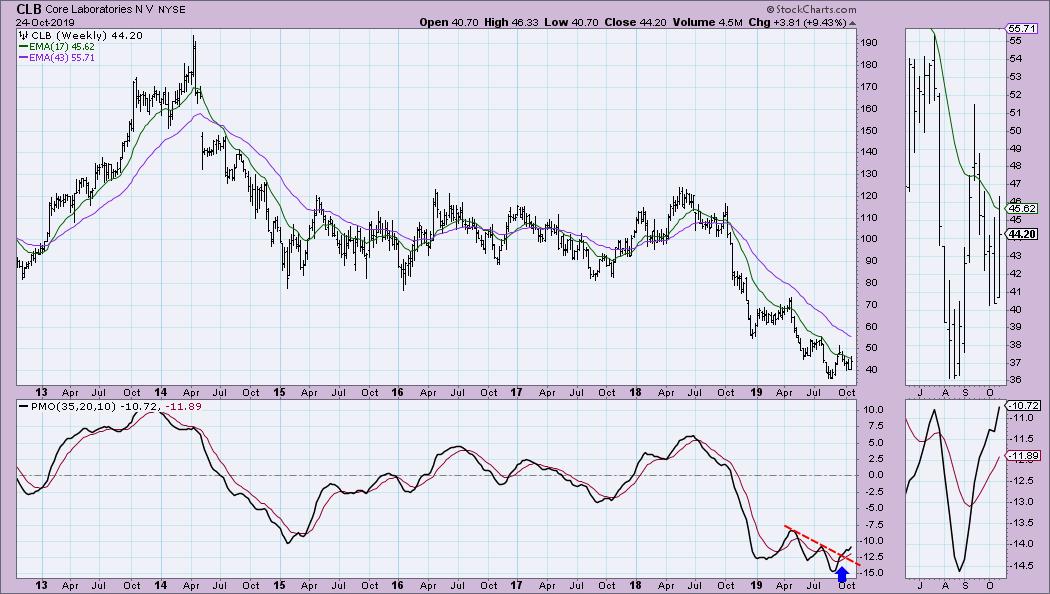
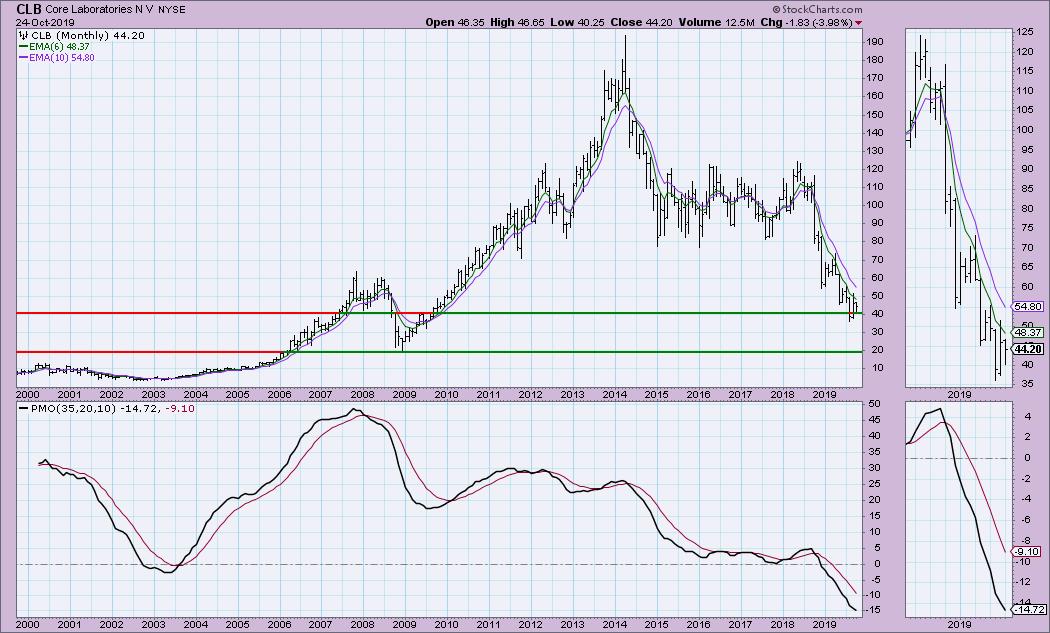
The weekly PMO is rising, having not only surpassed its previous top but also breaking a declining trend. I have the monthly chart below the weekly to display that support is actually lower that the low on the weekly chart. Thus, I would drop this one quickly if it fails to hold the low on the weekly chart.
Dropbox Inc (DBX) - Earnings: 11/7/2019
The dominant chart pattern here is a bullish descending triangle, which executed on Tuesday. Price has been pausing since. The PMO just gave a new BUY signal. The OBV set up a positive divergence with price bottoms right before this breakout, which is good to see. Upside target or overhead resistance would likely hit around $21 based on the lows from April and June. It would have another area of resistance trying to break above the September top. Price closed above the 20-EMA, which I also like.
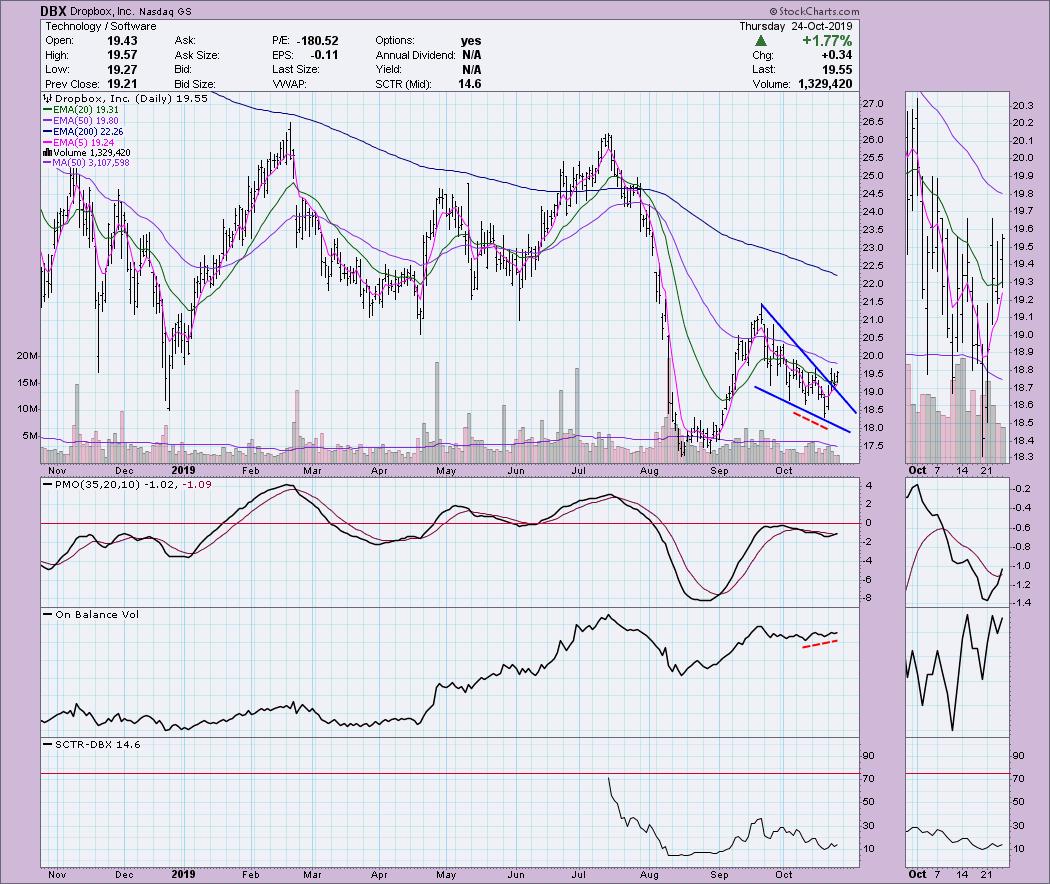
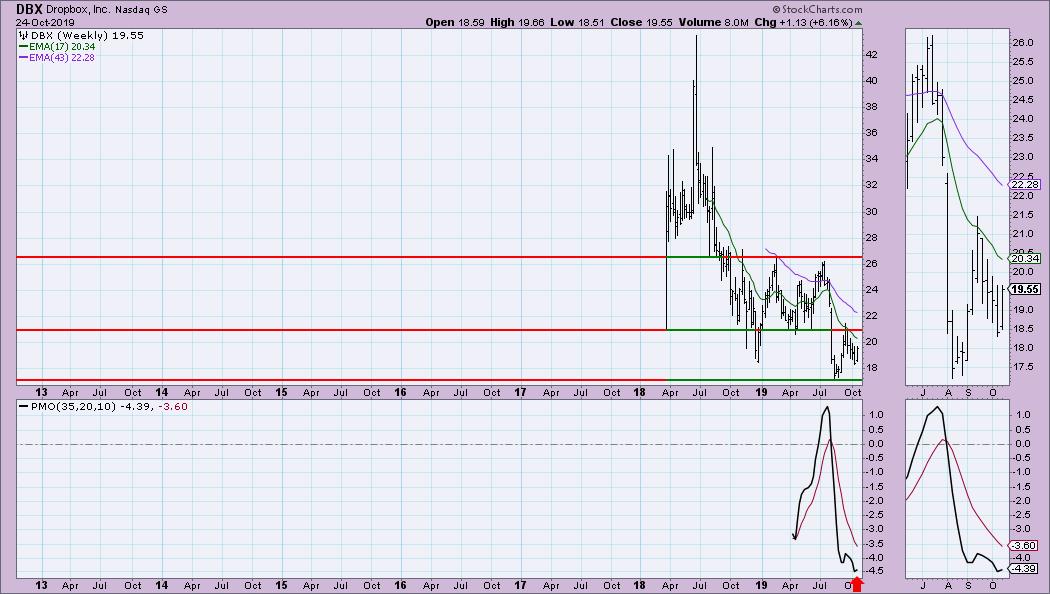
$18 looks like reasonable support on the weekly chart. If I did get in, I would set a tight stop at that point, since the floor on this chart is lower than where we just bounced. The PMO is turning up, so it may not need to hit the floor of the August low.
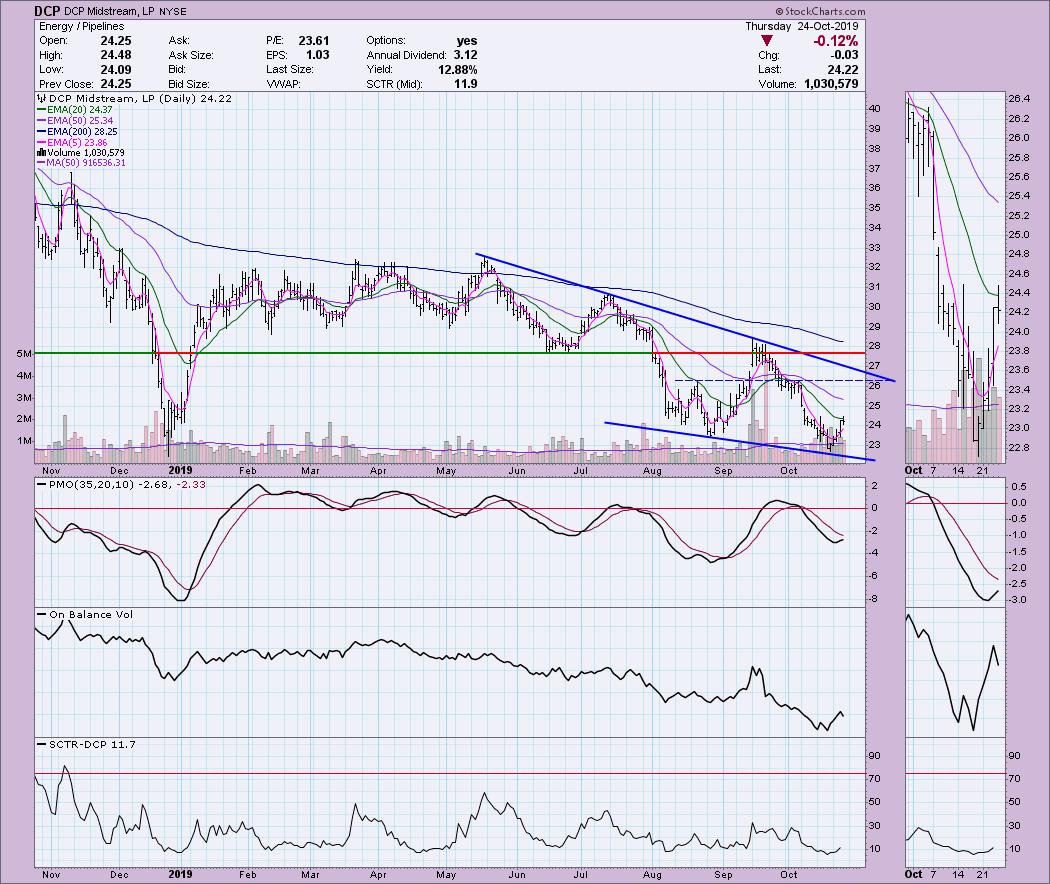
DCP Midstream LP (DCP) - Earnings: 11/4/2019
There is a large bullish falling wedge on the chart. Price popped above the 20-EMA but couldn't manage a close above it. I'll forgive that as the PMO is moving higher, which suggests it will close above the 20-EMA soon. Volume is coming in so the OBV has broken its declining trend.
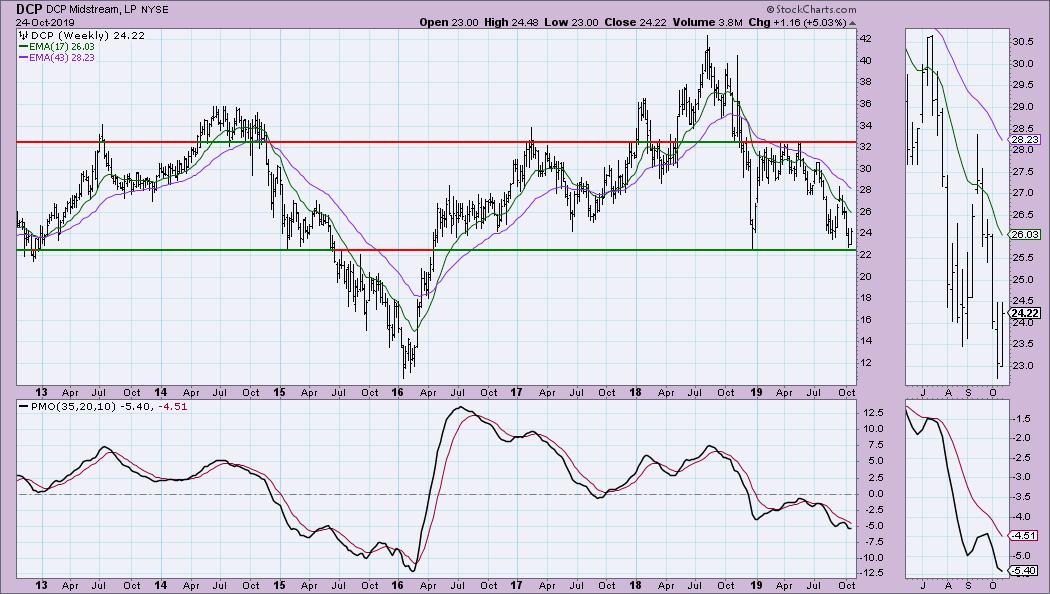
I really liked the weekly chart because price has decided to bounce off a strong support line. The weekly PMO has begun to decelerate, which is positive. I'd prefer to be rising, but, on a beat-down stock like this, I'm willing to forgive that. With long-term support in play here, it's easy to set a tight stop.
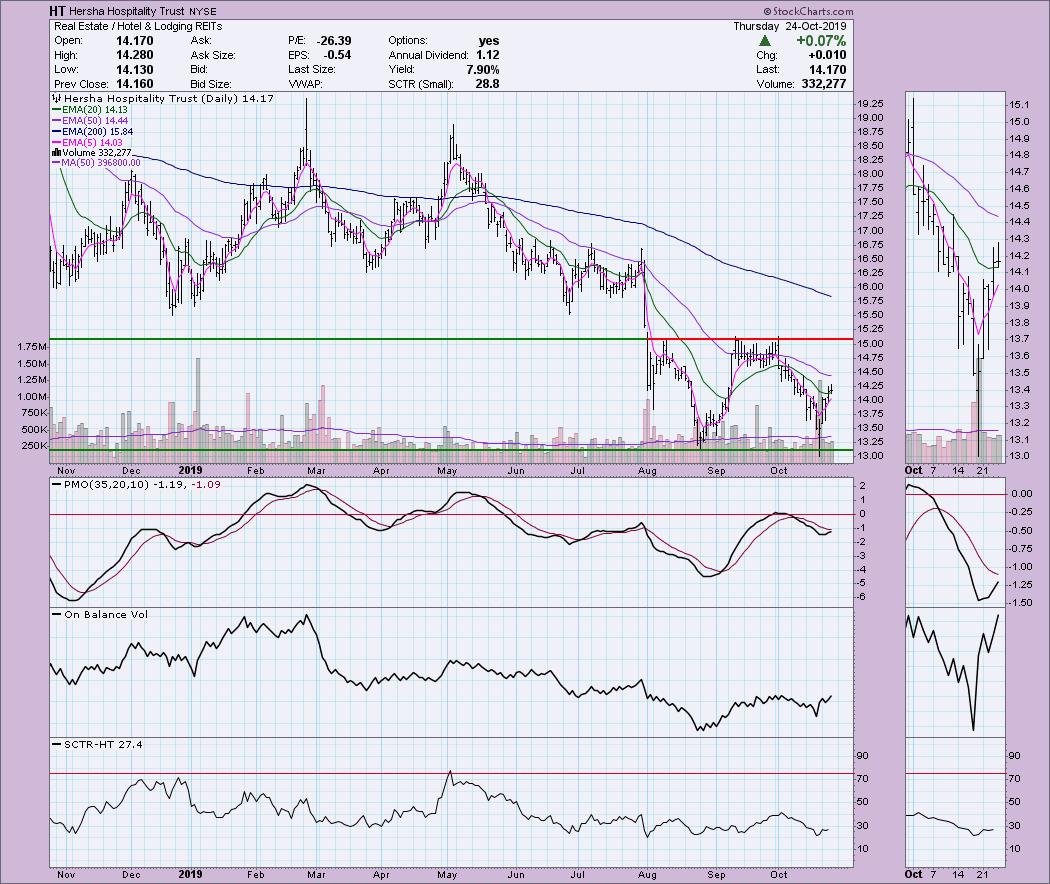
Hersha Hospitality Trust (HT) - Earnings: 11/5/2019
This one has managed to hold above the 20-EMA for two days now and the PMO is rising nicely. The OBV is confirming the move in the short term with rising bottoms. I'm not thrilled that all that volume didn't push price higher, but this is a solid bounce off strong support at the August low.
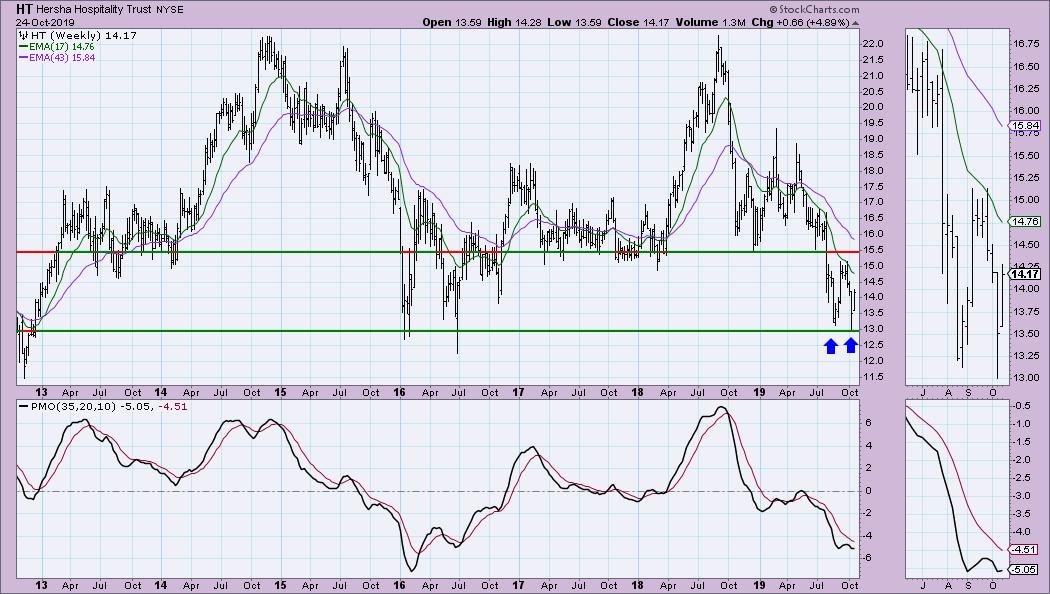
The weekly chart highlights the importance of this support line. I also see a possible double-bottom forming with this week's bounce. The weekly PMO has turned up.
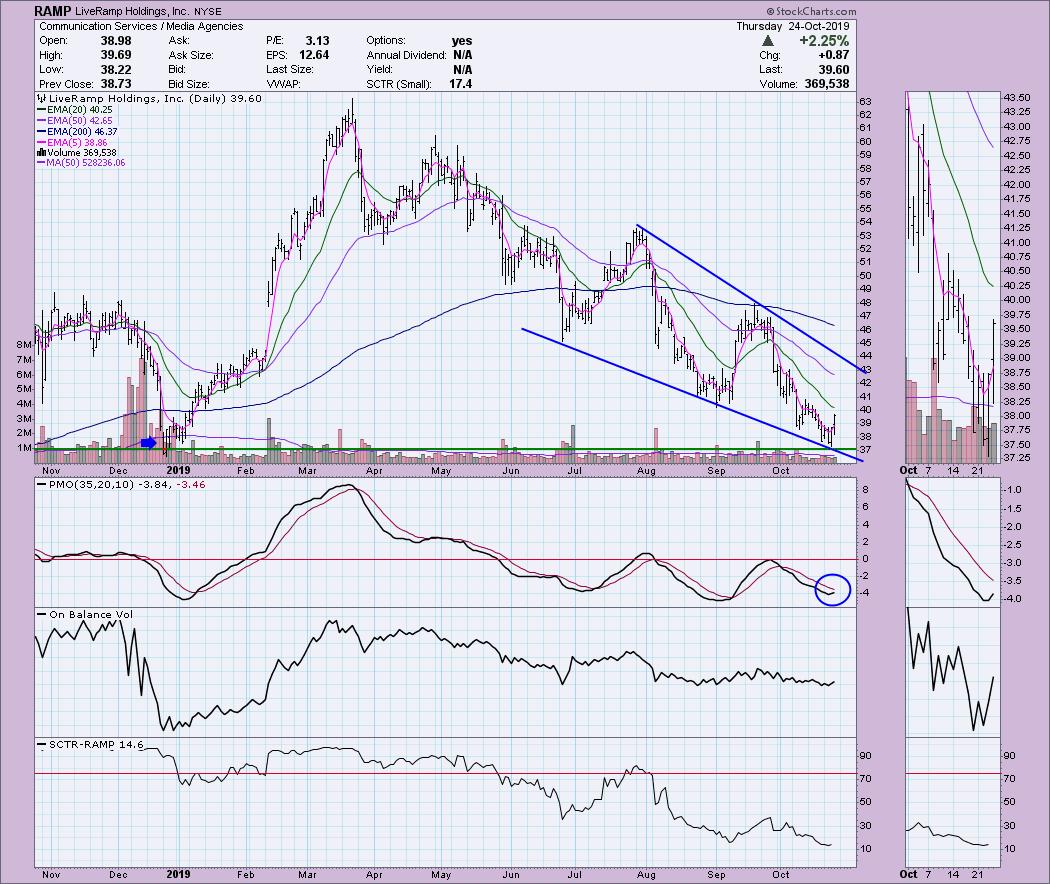
LiveRamp Holdings Inc (RAMP) - Earnings: Last reported 8/5/2019, no future date listed
I like this falling wedge formation. It is far from executing with a breakout from the declining trend line, but I think it will make a move to test that line in any case. Notice that this last bounce came off support from the low in December 2018. Price still has some work to do, but the rising PMO is good to see. Observe how this stock's PMO doesn't really "twitch" around; the signals are made with clean crossovers, so, if we see something similar, it could be the mark of a new rally.
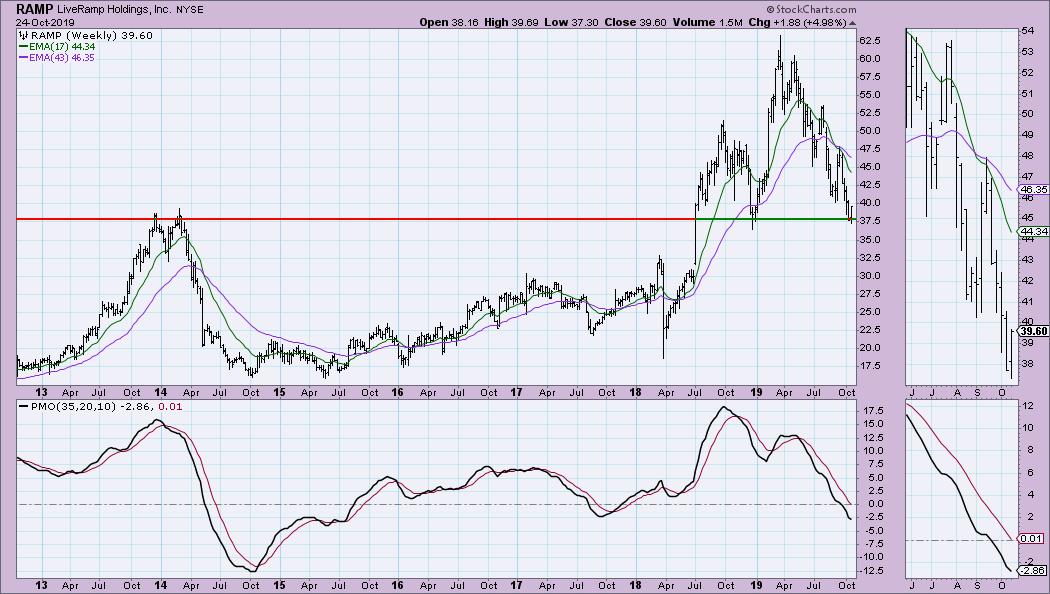
The weekly PMO is oversold when you note the low from 2017, but it hasn't turned up yet. I think it will. Note that price is bouncing off important support. Again, this is great for setting stops on a beat-down stock like this.
Full Disclosure: I do not own any of the stocks above and won't be adding them to my portfolio. I'm being patient as the market is reaching toward all-time highs and has previously failed there. I'm currently about 60% in cash.

SAVE THE DATE!!
Erin Swenlin will be presenting at the TradersExpo in New York City on March 15-17, 2020! You'll have an opportunity to meet Erin and discuss the latest DecisionPoint news and Diamond Scans. The conference is free to attend or view online!
Watch the latest episode of DecisionPoint with Carl & Erin Swenlin LIVE on Mondays 5:00p EST or on the StockCharts TV YouTube channel here!
Technical Analysis is a windsock, not a crystal ball.
Happy Charting!
- Erin
erinh@stockcharts.com
NOTE: The stocks reported herein are from mechanical trading model scans that are based upon moving average relationships, momentum and volume. DecisionPoint analysis is then applied to get five selections from the scans. The selections given should prompt readers to do a chart review using their own analysis process. This letter is not a call for a specific action to buy, sell or short any of the stocks provided. There are NO sure things or guaranteed returns on the daily selection of "diamonds in the rough."
Helpful DecisionPoint Links:
DecisionPoint Shared ChartList and DecisionPoint Chart Gallery
Price Momentum Oscillator (PMO)
Swenlin Trading Oscillators (STO-B and STO-V)
**Don't miss DecisionPoint Commentary! Add your email below to be notified of new updates"**


