
Scan results were a mixed bag of different sectors today. The charts that I found the most interesting were those that had some bullish flag formations. Not every stock today is showing that bull flag formation, but the others still look enticing. I'm personally holding off on adding to my current investments and remain in 60% cash. I didn't pull the trigger last week on Western Digital (WDC), as I mentioned at the end of Thursday's Diamond Report, since it opened well below the confirmation line of the double-bottom pattern. My readers told me that they figured as much. I love to get your feedback on these reports, so shoot me an email at erinh@stockcharts.com. I read every one of them!
Welcome to "DecisionPoint Daily Diamonds," a newsletter in which I highlight five "diamonds in the rough" taken from the results of one of my DecisionPoint scans. Remember, these are not recommendations to buy or sell, but simply stocks that I found interesting. The objective is to save you the work of the initial, tedious culling process, but you need to apply your own analysis to see if these stocks pique your interest as well. There are no guaranteed winners here!
Current Market Outlook:
Market Trend: Currently, we have Trend Model BUY signals in all three timeframes on the DP Scoreboard Indexes.
Market Condition: The market is overbought and struggling to reach all-time highs, despite Price Momentum Oscillator (PMO) BUY signals on the DP Scoreboards. Caution is still warranted.
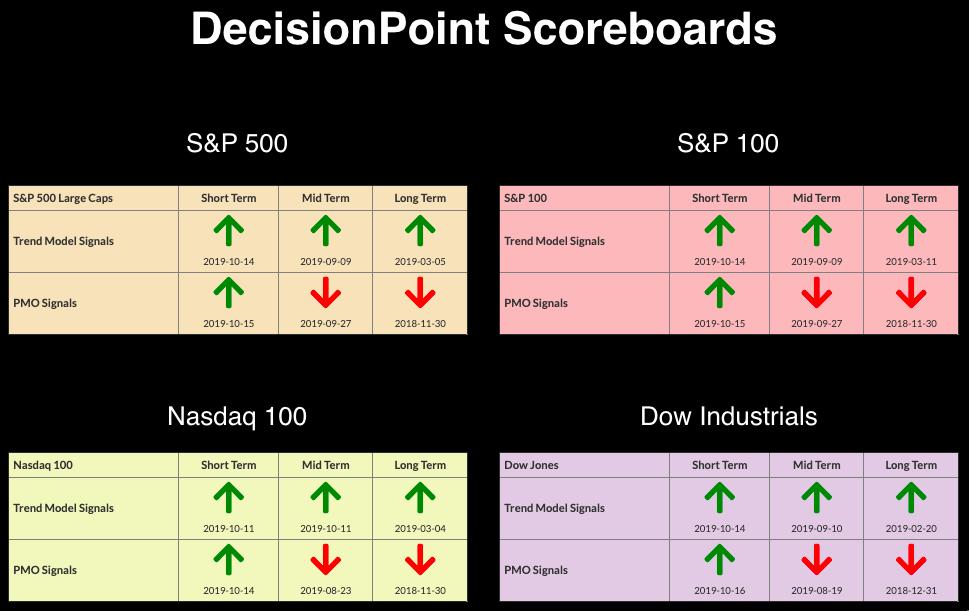
Market Environment: It is important to consider the "odds" for success. Here are the current percentages on the Silver and Golden Cross Indexes:
- Silver Cross: 58.8% SPX ITTM Buy Signals (20-EMA > 50-EMA)
- Golden Cross: 64.6% SPX LTTM Buy Signals (50-EMA > 200-EMA)
Diamond Index:
- Diamond Scan Results: 32
- Diamond Dog Scan Results: 14
- Diamond Bull/Bear Ratio: 2.29
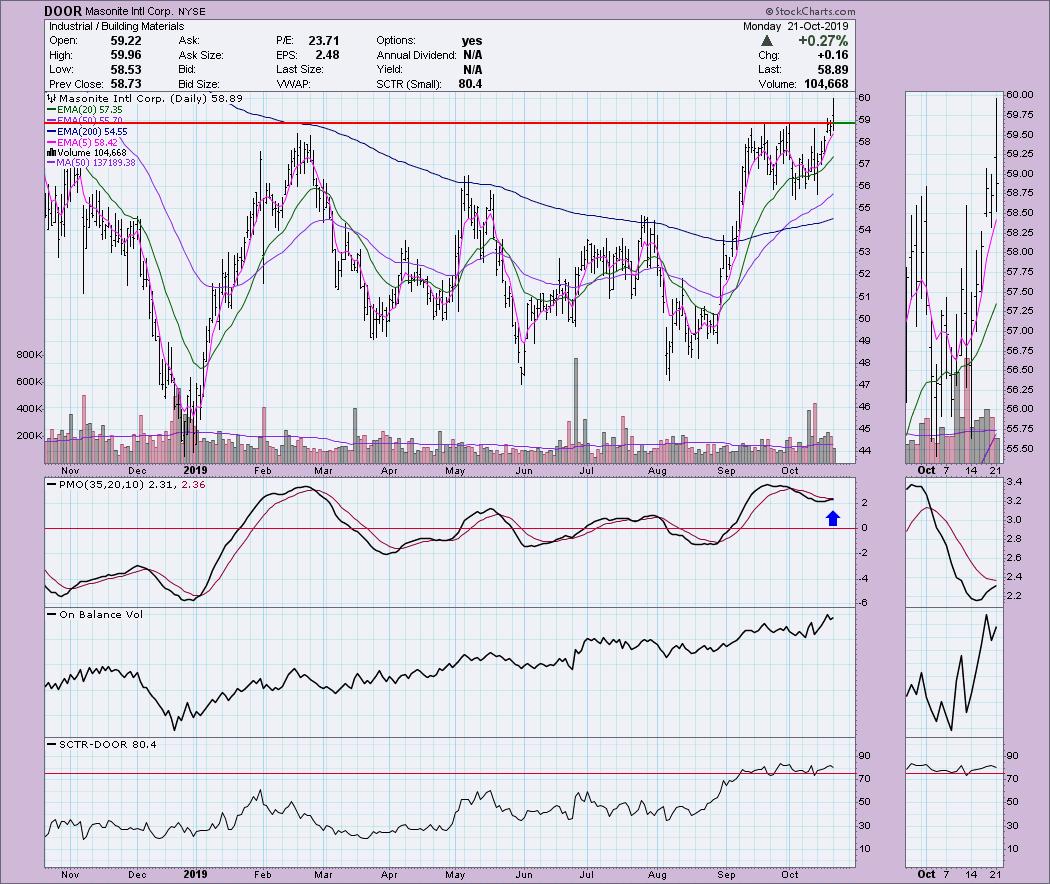
Masonite Int'l Corp (DOOR) - Earnings: 11/4/2019
Today, DOOR had a strong intraday breakout. Although it closed beneath the support line, you'll notice, if you look in the thumbnail, that it did close on the high for the year. I look at this as a breakout with a pullback to the breakout point. The PMO looks overbought, but note that the range has seen lows around -5 and -6. This tells me that we could see the PMO make higher highs. The OBV is showing higher highs, which is positive when you see a breakout.
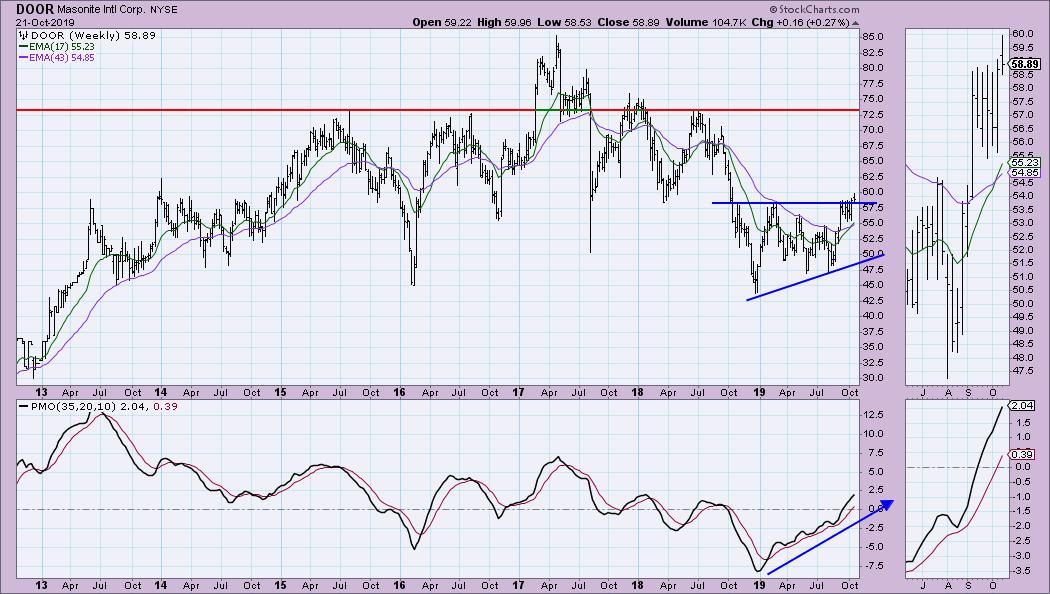
I like the weekly chart best. We have a bullish ascending triangle formation; today's trading was the breakout and possible execution of the pattern. Note also that the 17-week EMA just had a positive crossover above the 43-week EMA. I would look for a move to overhead resistance at $72.50.
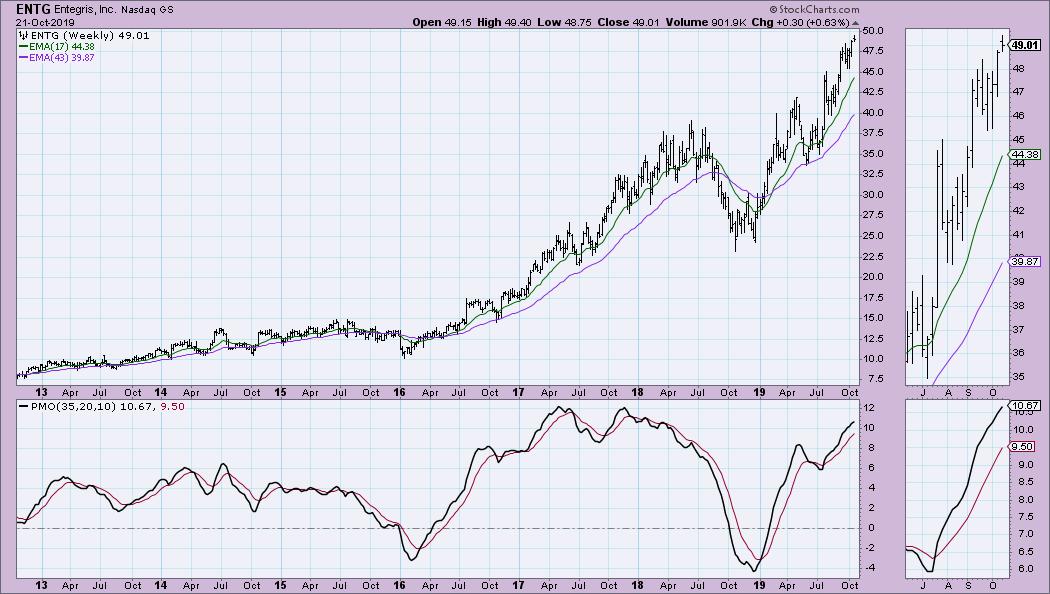
Entegris Inc (ENTG) - Earnings: 10/24/2019
Earnings are going to be reported this week, and Zack's was suggesting it might not go well. If this is enticing to you, and you wish to get in before earnings, I would set a tight stop. However, this might be one to watch up until earnings. That said, I still like the breakout on volume and the close at an annual price high. The PMO is ready for a BUY signal and the OBV is confirming the rally.
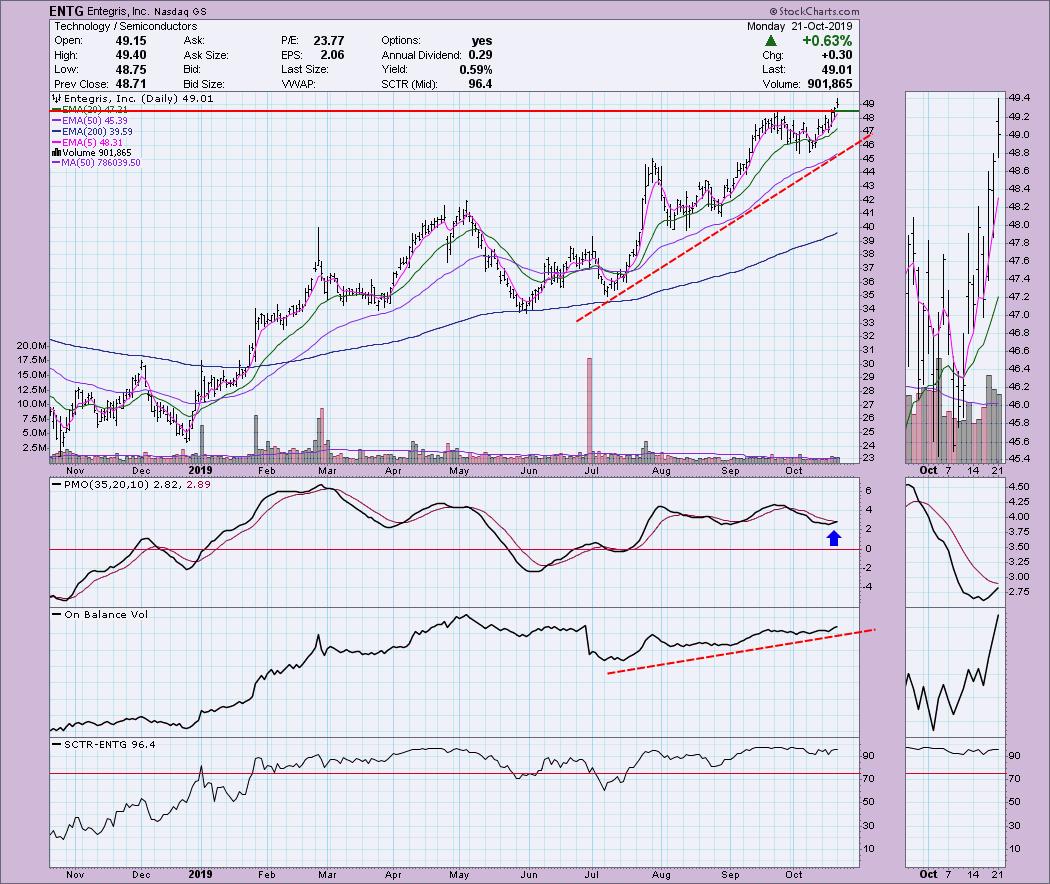
One thing to note is that, currently, ENTG is trading at all-time highs and the weekly PMO is on the overbought side.
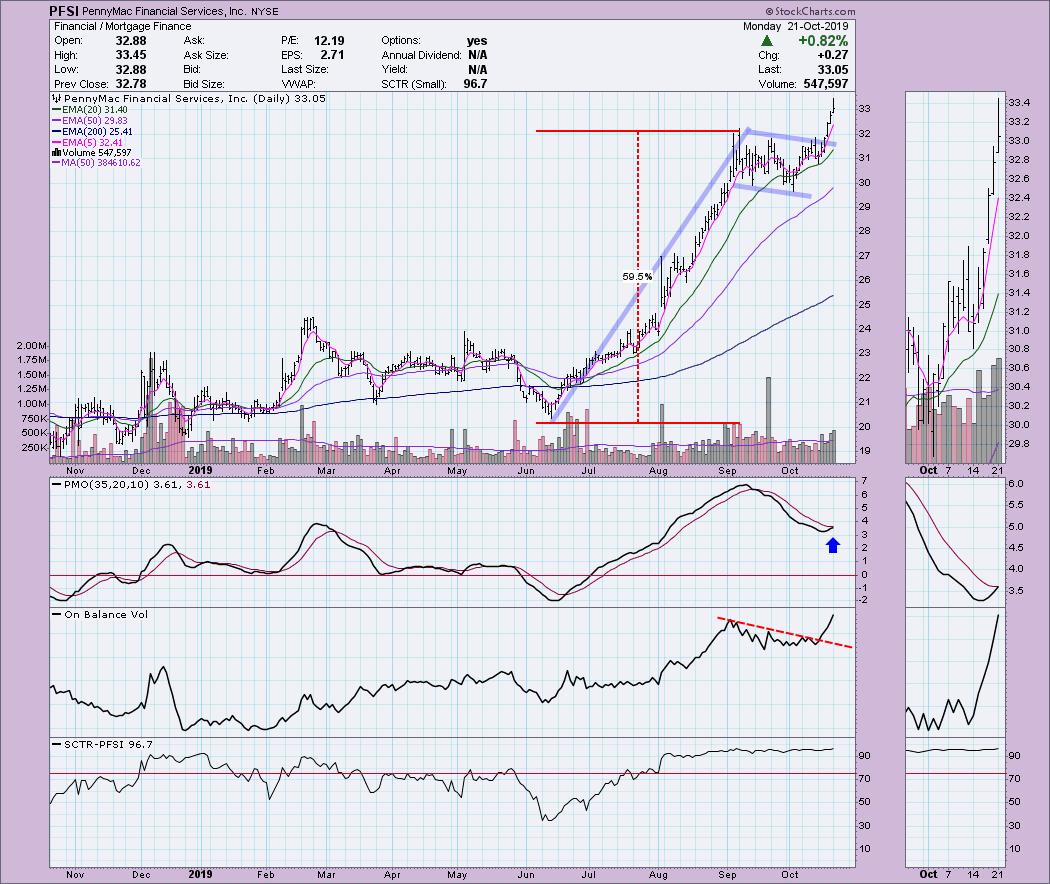
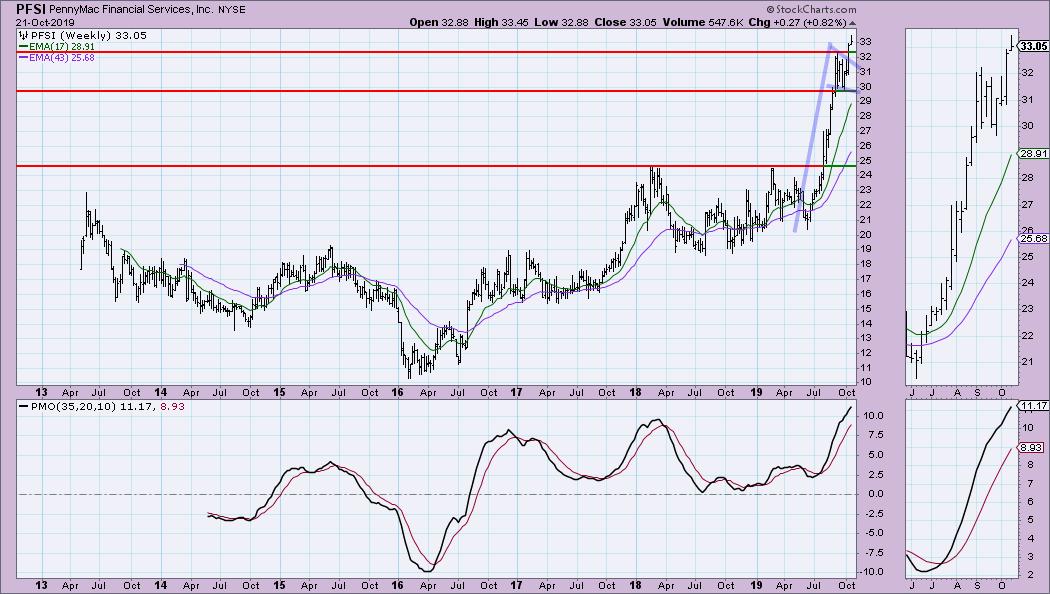
PennyMac Financial Services Inc (PFSI) - Earnings: N/A - Last reported earnings (11/5/2018)
This is a very enticing flag formation. Last week, the pattern was "activated" with the breakout from the flag. The minimum upside target is calculated by taking the height of the flagpole and adding it to the breakout point. I am not going to sit here and say you should expect a 60% move to the upside, but these are continuation patterns and it does suggest higher prices to come. The PMO is just about ready for the crossover BUY signal. The volume coming in on this breakout is impressive.
The flag is on the weekly chart. The back data makes it somewhat difficult to say that the PMO is overbought, but, given what data we do have, it is overbought. It is still rising strongly, so it is bullish.
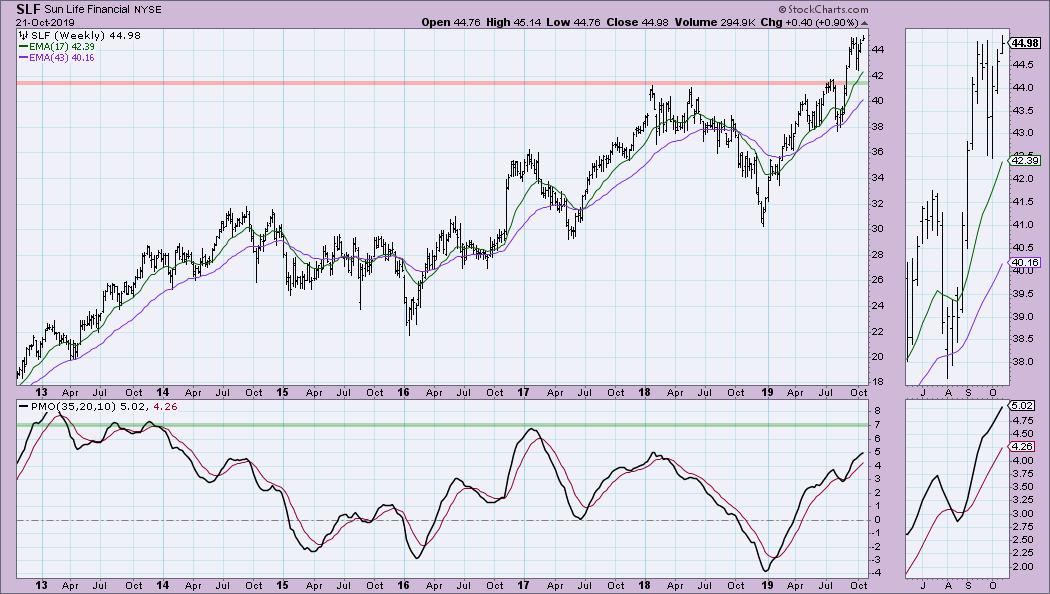
Sun Life Financial (SLF) - Earnings: N/A (Last reported 2/8/2017 on Yahoo!)
We had a breakout today, and a close that is a high for the year. I would be somewhat cautious given the double-tops that have been appearing on many of the broad market indexes, but the PMO is nearing a BUY signal and the OBV is rising. Volume has been tapering off on this rally, which means you should exercise caution or a tight stop.
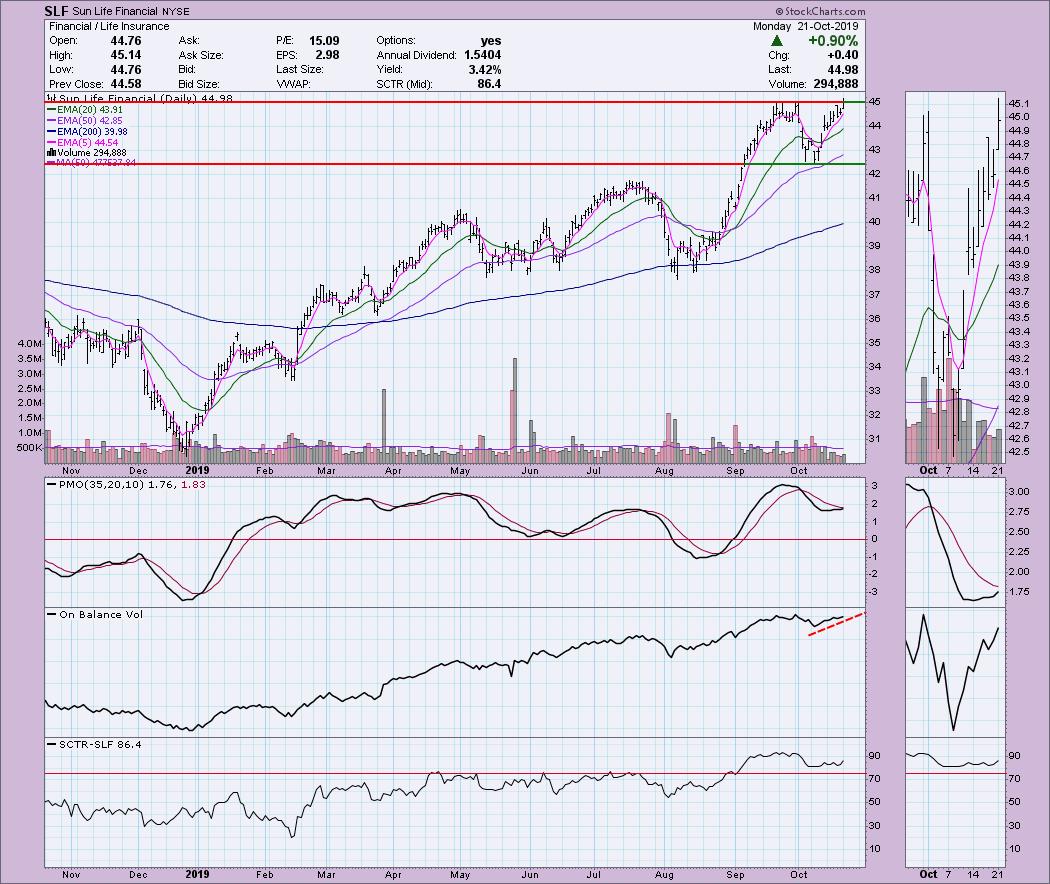
The weekly PMO is rising strongly and isn't overbought.
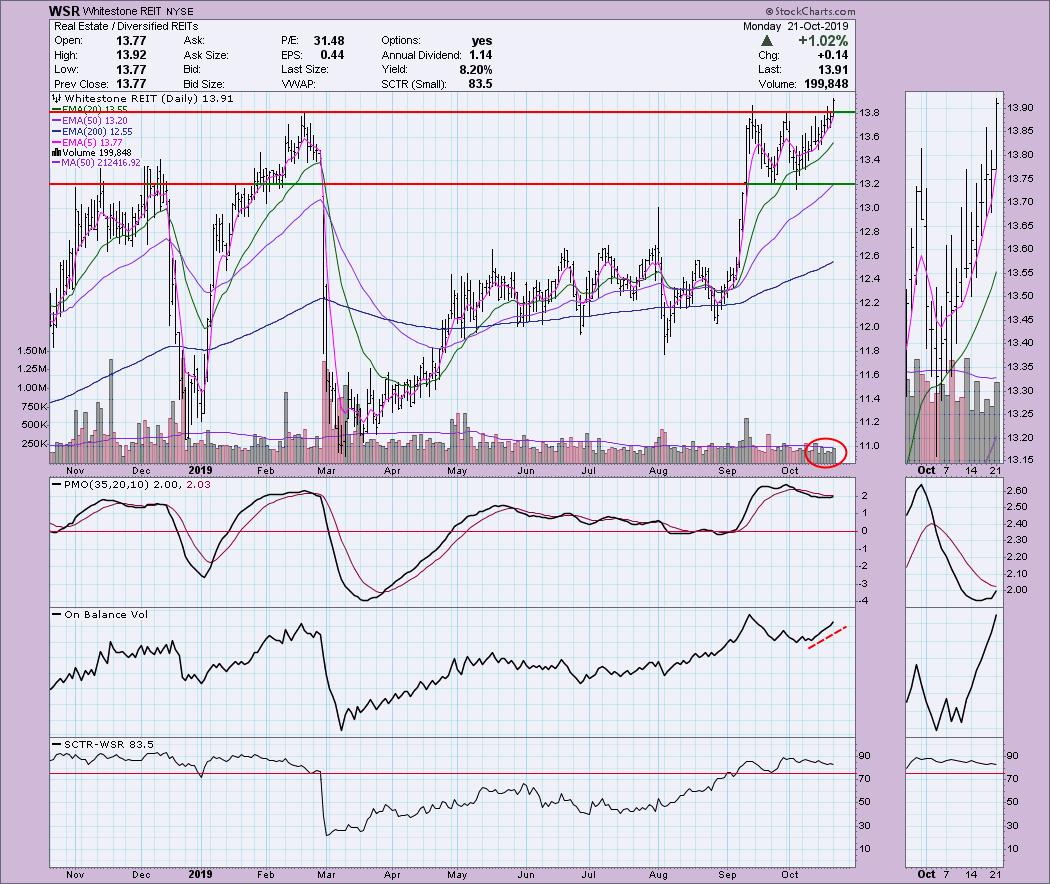
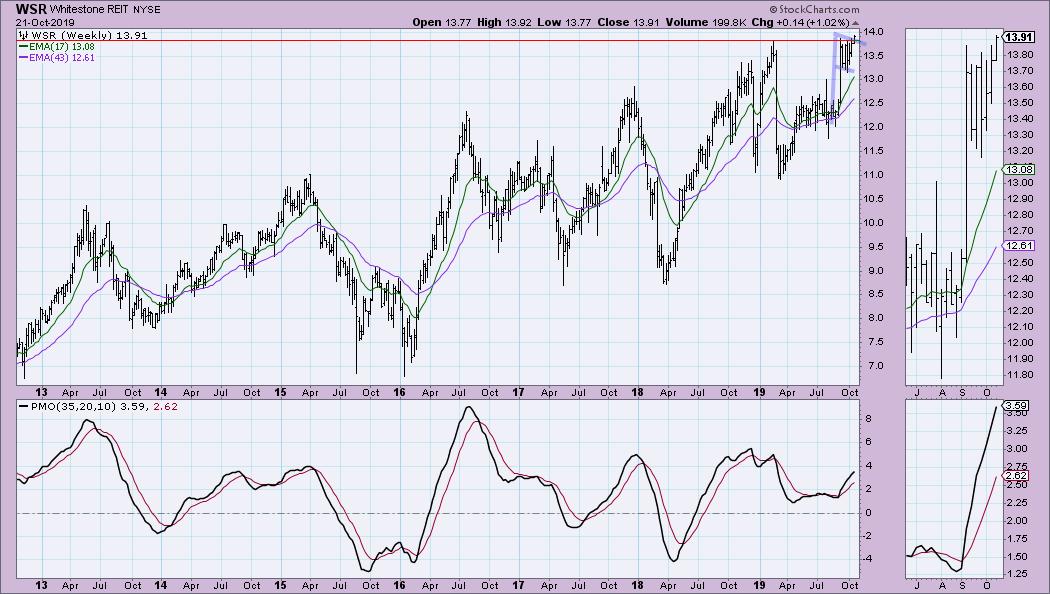
Whitestone REIT (WSR) - Earnings: 10/30/2019
I didn't annotate it, but you can see a possible flag formation that executed today on the breakout. Many would point out the double-bottom, but, technically, those are reversal patterns, not continuation patterns, so I prefer to look at as a flag. The breakout came on strong volume, so the OBV is definitely confirming this rally.
You can see the bull flag formation on the weekly chart. The important features of this weekly chart are the rising and not overbought weekly PMO and the new all-time high logged today.
Full Disclosure: I do not own any of the stocks above and I am not purchasing any. I'm currently about 60% in cash.

SAVE THE DATE!!
Erin Swenlin will be presenting at the TradersExpo in New York City on March 15-17, 2020! You'll have an opportunity to meet Erin and discuss the latest DecisionPoint news and Diamond Scans. The conference is free to attend or view online!
Watch the latest episode of DecisionPoint with Carl & Erin Swenlin LIVE on Mondays 5:00p EST or on the StockCharts TV YouTube channel here!
Technical Analysis is a windsock, not a crystal ball.
Happy Charting!
- Erin
erinh@stockcharts.com
NOTE: The stocks reported herein are from mechanical trading model scans that are based upon moving average relationships, momentum and volume. DecisionPoint analysis is then applied to get five selections from the scans. The selections given should prompt readers to do a chart review using their own analysis process. This letter is not a call for a specific action to buy, sell or short any of the stocks provided. There are NO sure things or guaranteed returns on the daily selection of "diamonds in the rough."
Helpful DecisionPoint Links:
DecisionPoint Shared ChartList and DecisionPoint Chart Gallery
Price Momentum Oscillator (PMO)
Swenlin Trading Oscillators (STO-B and STO-V)
**Don't miss DecisionPoint Commentary! Add your email below to be notified of new updates"**


