
The "Chart Breakouts" Scan returned about nine different home builder stocks. I didn't care for all of them, but I did pick out three for your review. This scan generally pulls stocks that had monster days. Consequently, you may need to wait for a pullback to the breakout point so you don't have to "chase."
Don't miss the latest DecisionPoint episode with Carl and Erin. Find it on the DecisionPoint playlist on the StockCharts YouTube channel.
Welcome to "DecisionPoint Daily Diamonds," a newsletter in which we highlight five "diamonds in the rough" taken from the results of one of my DecisionPoint scans. Remember, these are not recommendations to buy or sell, but simply stocks that I found interesting. The objective is to save you the work of the initial, tedious culling process, but you need to apply your own analysis and to see if these stocks pique your interest. There are no guaranteed winners here.
Current Market Outlook:
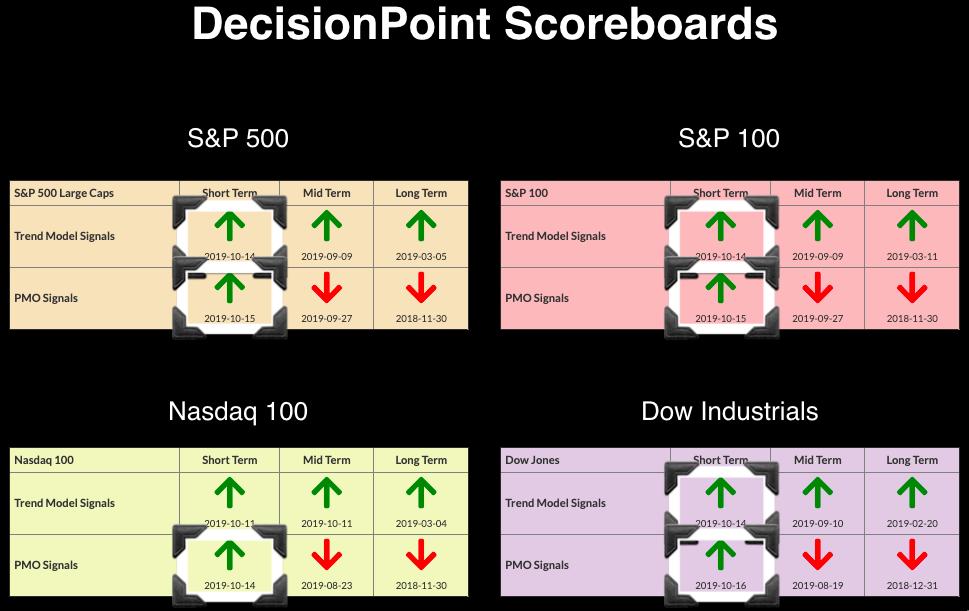
Market Trend: Currently, we have Trend Model BUY signals in all three timeframes on the DP Scoreboard Indexes.
Market Condition: The market is overbought and struggling to reach all-time highs despite Price Momentum Oscillator (PMO) BUY signals appearing this week on the DP Scoreboards.
Market Environment: It is important to consider the "odds" for success. Here are the current percentages on the Silver and Golden Cross Indexes:
- Silver Cross: 54.8% SPX ITTM Buy Signals (20-EMA > 50-EMA)
- Golden Cross: 64.2% SPX LTTM Buy Signals (50-EMA > 200-EMA)
Diamond Index:
- Diamond Scan Results: 40
- Diamond Dog Scan Results: 4
- Diamond Bull/Bear Ratio: 10.0
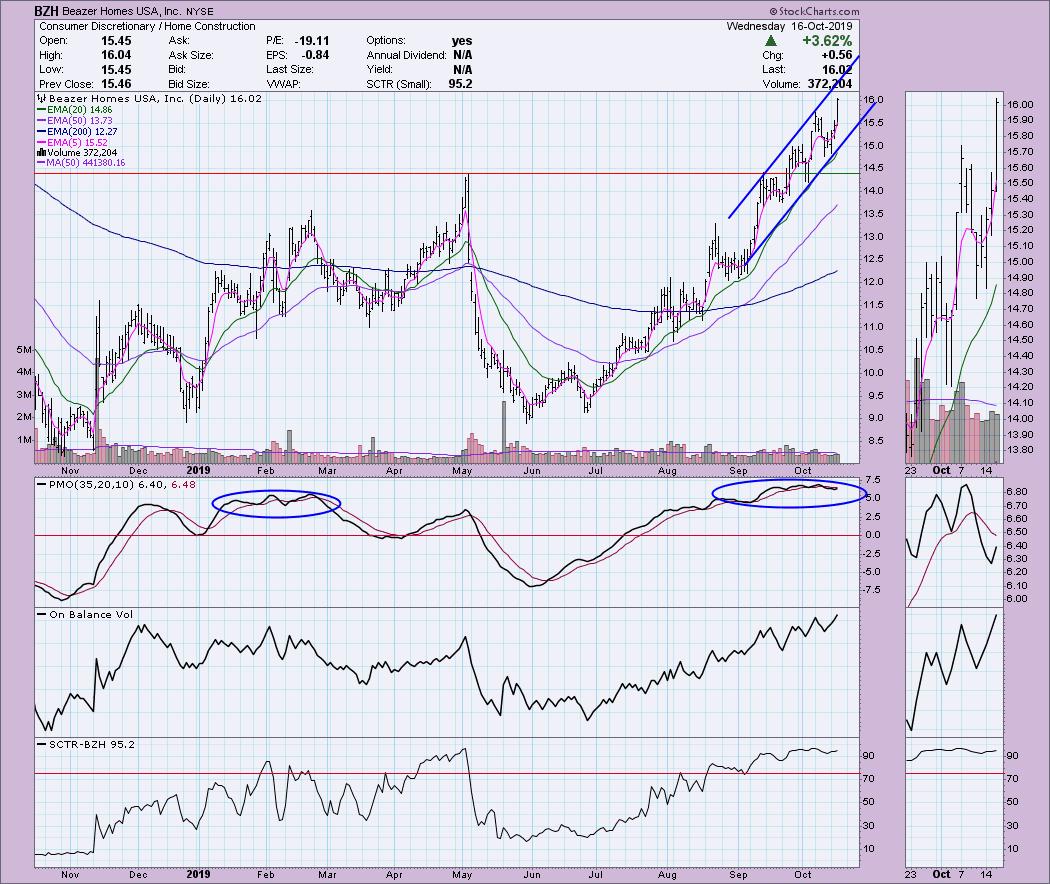
Beazer Homes USA Inc (BZH) - Earnings: 11/11 - 11/15/2019
Granted, BZH has been in a pretty steep rising trend that could burn us when it fails. The PMO is in overbought territory, but it could remain there for some time during a steady rising trend. Note the Jan/Feb overbought readings. It's hard to argue with an OBV that is confirming this rally and a very high SCTR.
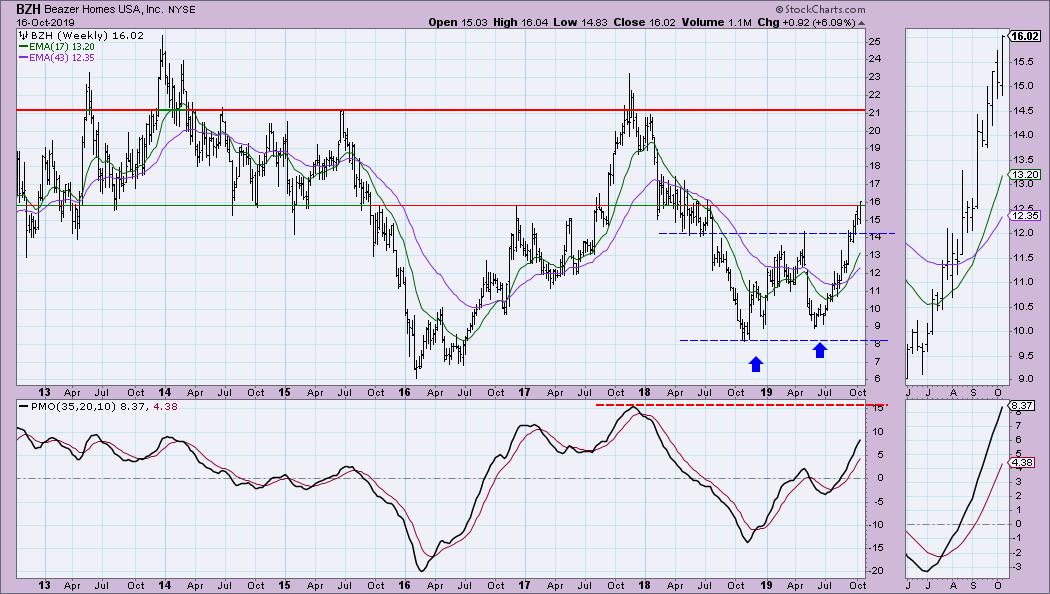
The weekly chart looks very nice, with a double-bottom pattern that executed and a rising PMO that is not overbought. The minimum upside target of this pattern is calculated by taking the height of the pattern and adding it to the confirmation line price. In this case, it matches up with overhead resistance at the 2015 high.
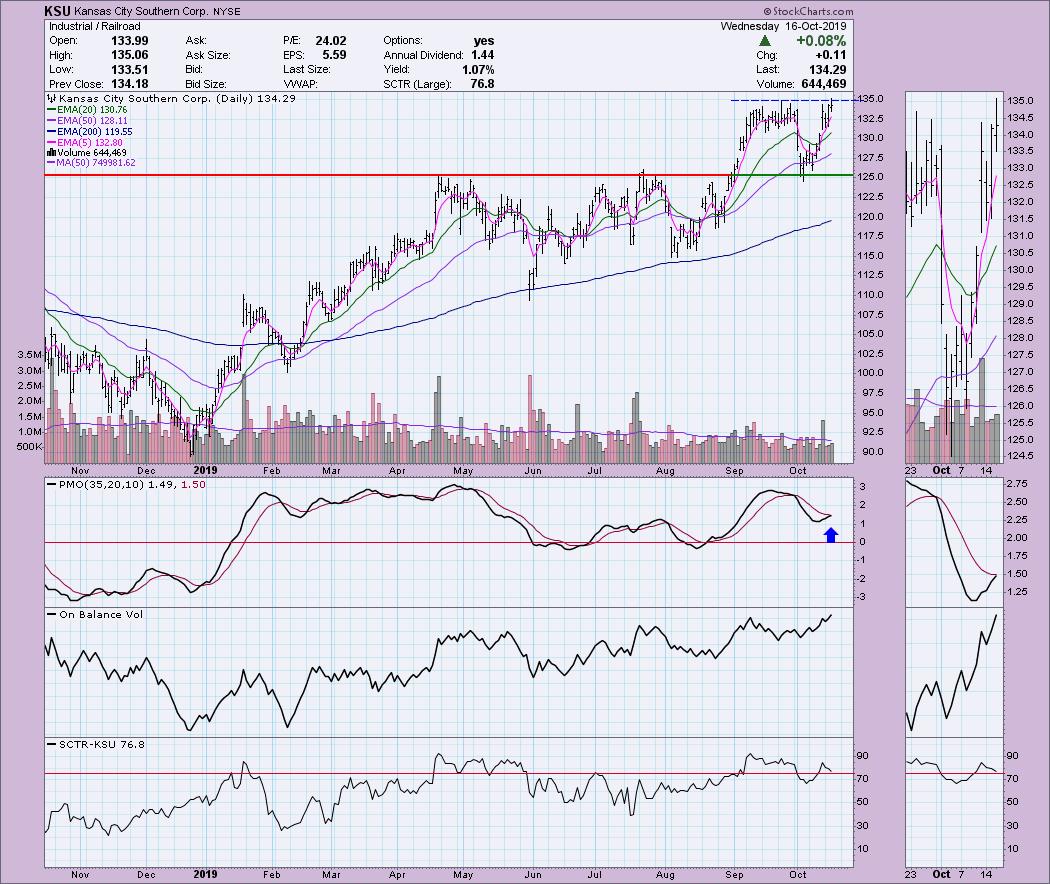
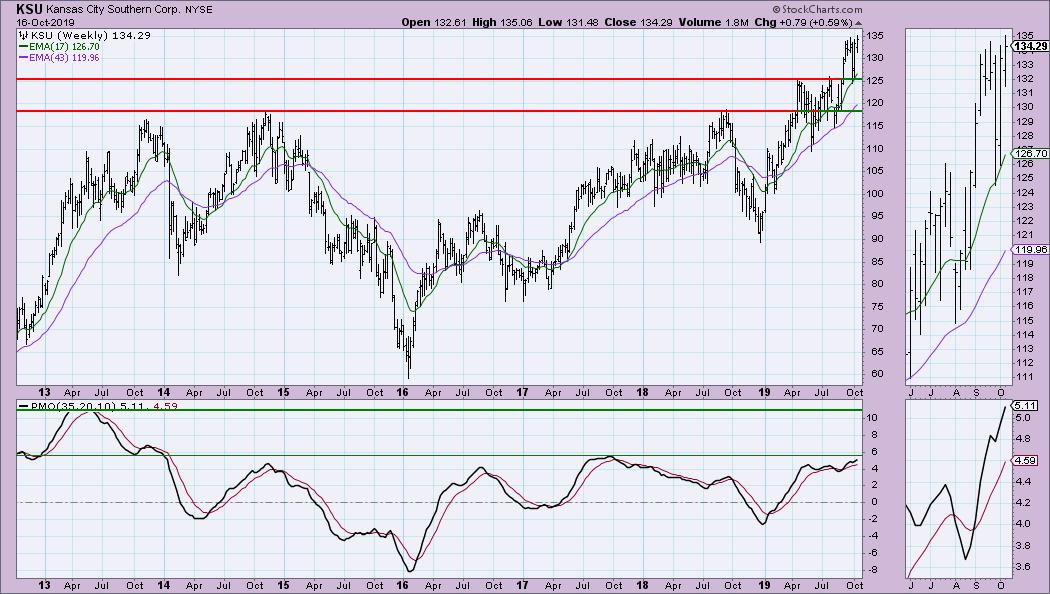
Kansas City Southern (KSU) - Earnings: 10/18/2019
This one is reporting earnings pretty soon, so be aware of that. Price nearly broke and closed above the September top. The PMO is nearing a BUY signal and OBV is rising; both are confirming the current rally and likely breakout.
The weekly chart looks pretty good, with a rising PMO that is not that overbought when you compare it to readings from 2013.
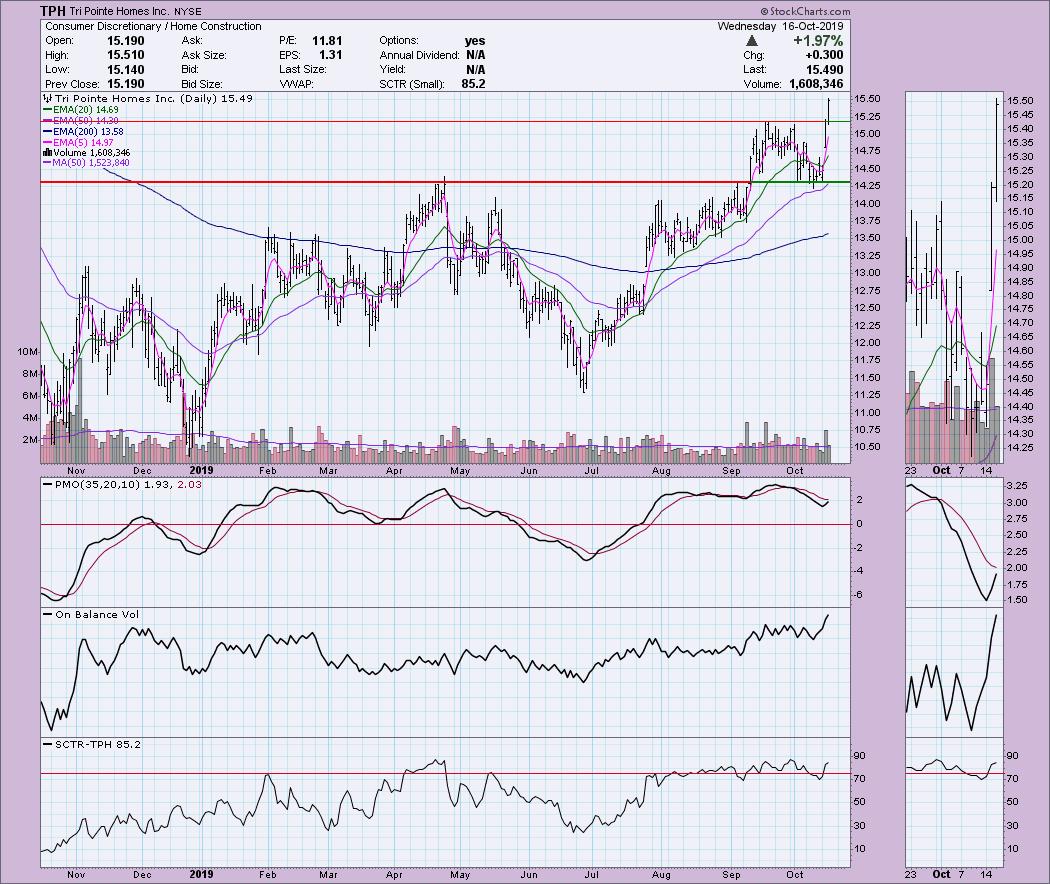
Tri Pointe Homes Inc (TPH) - Earnings: 10/31/2019
The past two days have been spectacular for TPH, so I would consider watching for a pullback to the breakout point. The PMO is somewhat overbought, but let's notice it reached a low -6 last year. This means the top of the PMO range is higher than it appears. I looked at a longer-term daily chart and the normal range appears to be between +5 and -5. Excellent volume came in on this rally, with the OBV confirming the breakout.
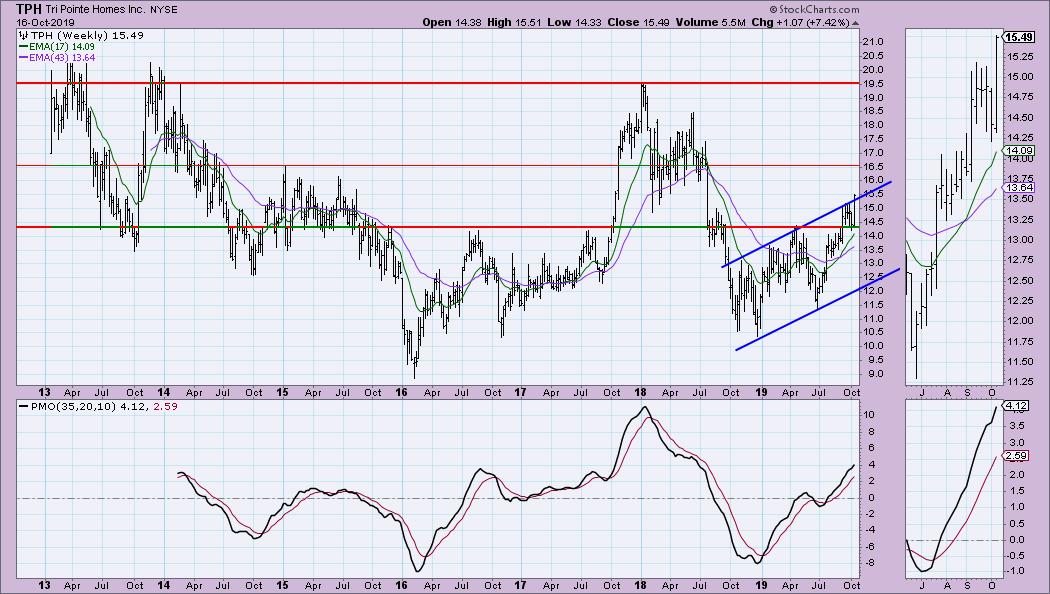
The weekly chart is bullish with a rising trend channel. Support is being held at $14.50. The PMO is rising and not overbought.
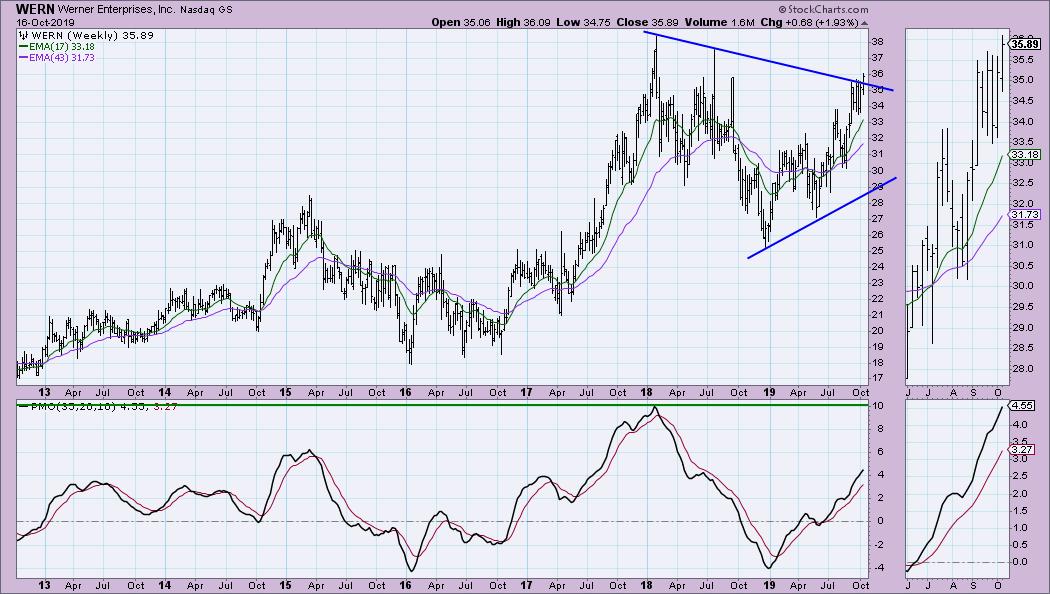
Werner Enterprises Inc (WERN) - Earnings: 10/24/2019
Some might point out a double-bottom pattern, but that is a reversal pattern. More likely, we have a flag with a great breakout today. The main negative to this chart is the reverse divergence between the OBV tops and price tops. We don't want this kind of disparity between the two. So why is it a Diamond? The PMO looks great and I do think we are looking at a bull flag here. The internal and relative strength are also confirmed by a high SCTR score.
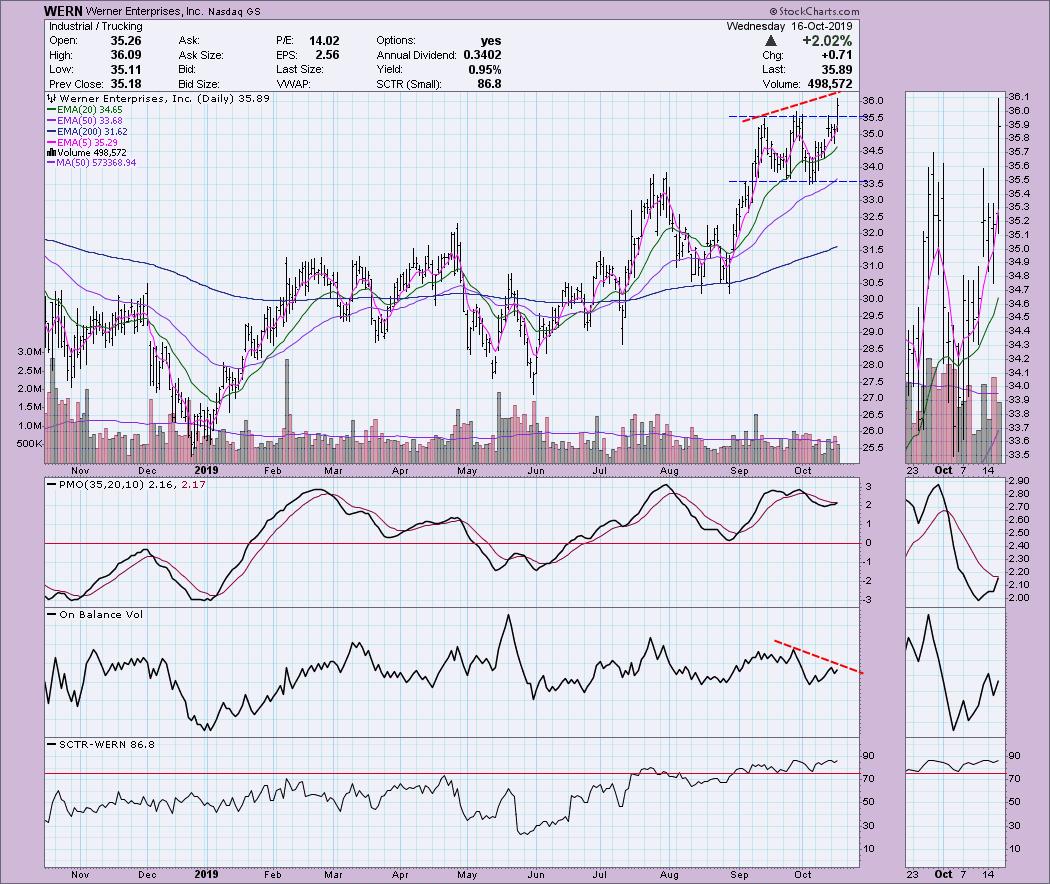
Upside potential is favorable on the weekly chart, with a rising and not overbought weekly PMO and a breakout from a declining trend line.
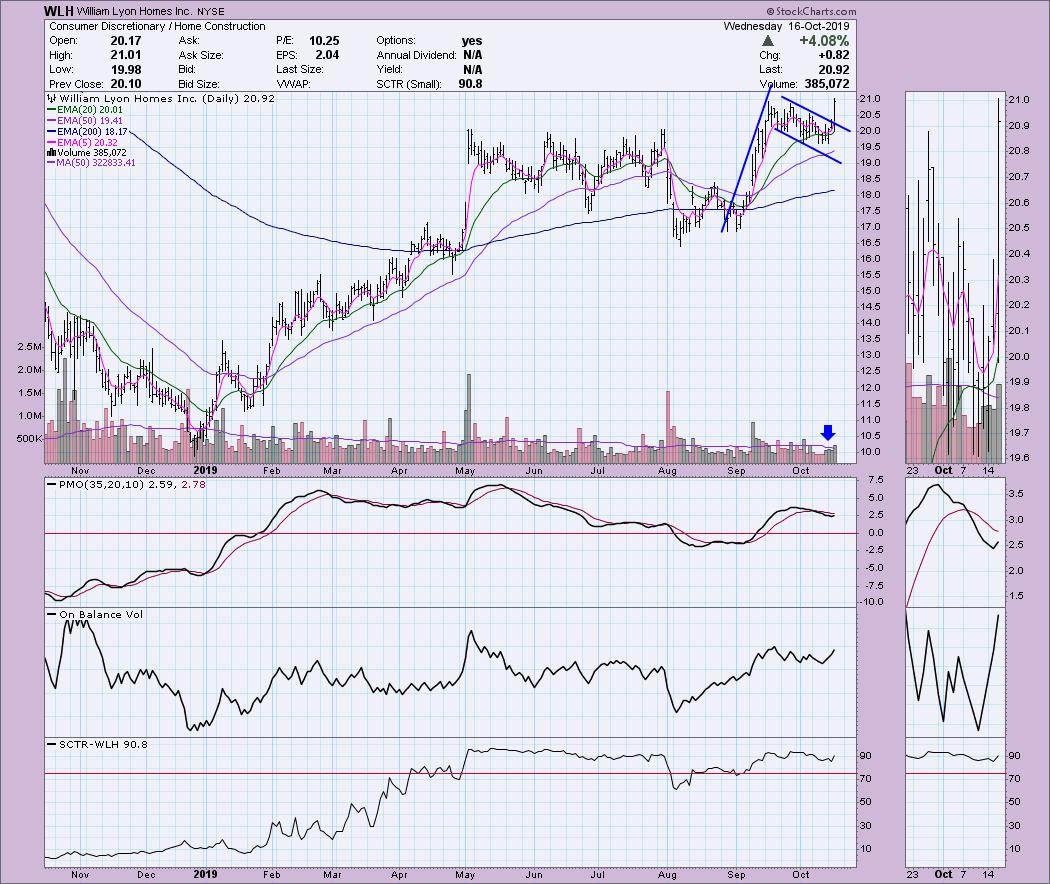
William Lyon Homes Inc (WLH) - Earnings: 10/28 - 11/1/2019
I see a pretty convincing bull flag pattern that was executed with today's blowout breakout. The close surpassed the previous two tops. The positive volume that has come in on the breakout is very encouraging. The minimum upside target would be around $24.
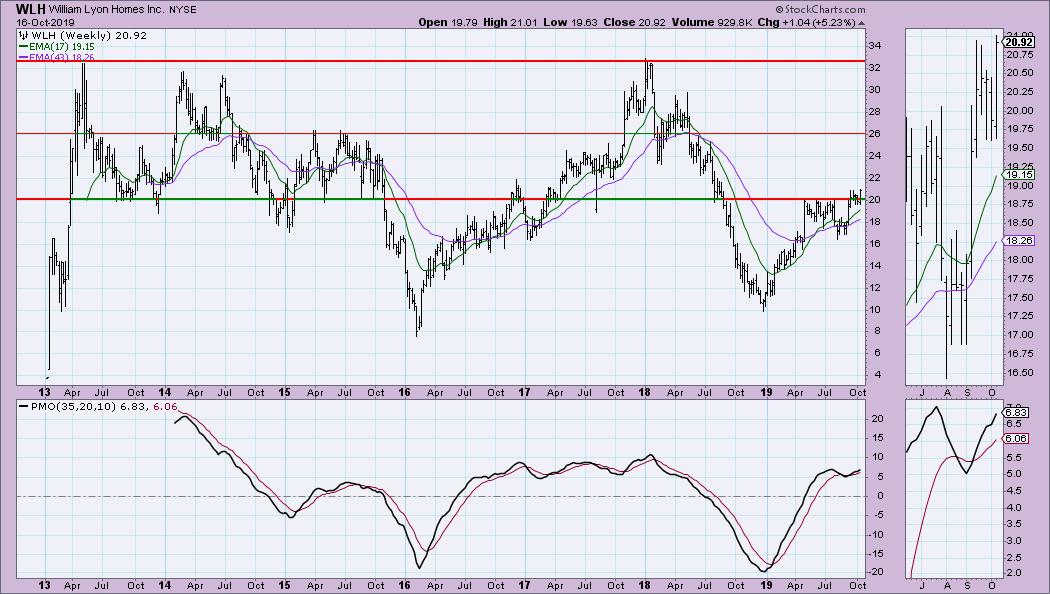
The flag is visible on the weekly chart as well. Overhead resistance doesn't really come into play until we reach that minimum upside target of the flag at $24. However, I don't think that will pose a problem. I believe a rally to $24 is reasonable, but there is a possibility of a move to $26.
Full Disclosure: I do not own any of the stocks above and I am not planning on purchasing these or any additional stocks at this time. I'm currently about 60% in cash and watching my stops closely.

SAVE THE DATE!!
Erin Swenlin will be presenting at the TradersExpo in New York City on March 15-17, 2020! You'll have an opportunity to meet Erin and discuss the latest DecisionPoint news and Diamond Scans. The conference is free to attend or view online!
Watch the latest episode of DecisionPoint with Carl & Erin Swenlin LIVE on Mondays 5:00p EST or on the StockCharts TV YouTube channel here!
Technical Analysis is a windsock, not a crystal ball.
Happy Charting!
- Erin
erinh@stockcharts.com
NOTE: The stocks reported herein are from mechanical trading model scans that are based upon moving average relationships, momentum and volume. DecisionPoint analysis is then applied to get five selections from the scans. The selections given should prompt readers to do a chart review using their own analysis process. This letter is not a call for a specific action to buy, sell or short any of the stocks provided. There are NO sure things or guaranteed returns on the daily selection of "diamonds in the rough."
Helpful DecisionPoint Links:
DecisionPoint Shared ChartList and DecisionPoint Chart Gallery
Price Momentum Oscillator (PMO)
Swenlin Trading Oscillators (STO-B and STO-V)
**Don't miss DecisionPoint Commentary! Add your email below to be notified of new updates"**


