
In yesterday's DP Alert Mid-Week, I discussing the bullish prospects for Gold moving forward. Consequently, it was not surprising to see some Gold stocks on my various scans. I have a couple of these listed below, along with a semiconductor and solar company. The market is still quite weak, so I am keeping my portfolio mostly in defensive areas of the market. Currently, I am 60% in cash. As a side note, I do not "track" the symbols of the Diamonds I present; if I recognize that I wrote about it recently, I won't include it, but sometimes you may see repeats as my memory isn't what it used to be. I also think that if a symbol is repeated, it tells you that there is a lot of internal strength.
Welcome to "DecisionPoint Daily Diamonds", a newsletter in which we highlight five "diamonds in the rough" taken from the results of one of my DecisionPoint scans. Remember, these are not recommendations to buy or sell, but simply stocks that I found interesting. The objective is to save you the work of the initial, tedious culling process, but you need to apply your own analysis and to see if these stocks pique your interest. There are no guaranteed winners here.
Current Market Outlook:
Market Trend: Currently have Short-Term Trend Model Neutral signals for the DP Scoreboard Indexes. The NDX triggered an IT Trend Model Neutral signal yesterday, when the 20-EMA dropped below the 50-EMA. The SPX, OEX and Dow are all in line to do the same, although today's rally slowed the descent.
Market Condition: Weak internals, with Price Momentum Oscillator SELL Signals on DP Scoreboard Indexes in all timeframes.
Market Environment: It is important to consider the "odds" for success. Here are the current percentages on the Silver and Golden Cross Indexes:
- Silver Cross: 49.6% SPX ITTM Buy Signals (20-EMA > 50-EMA)
- Golden Cross: 64.4% SPX LTTM Buy Signals (50-EMA > 200-EMA)
Diamond Index:
- Diamond Scan Results: 10
- Diamond Dog Scan Results: 12
- Diamond Bull/Bear Ratio: .83
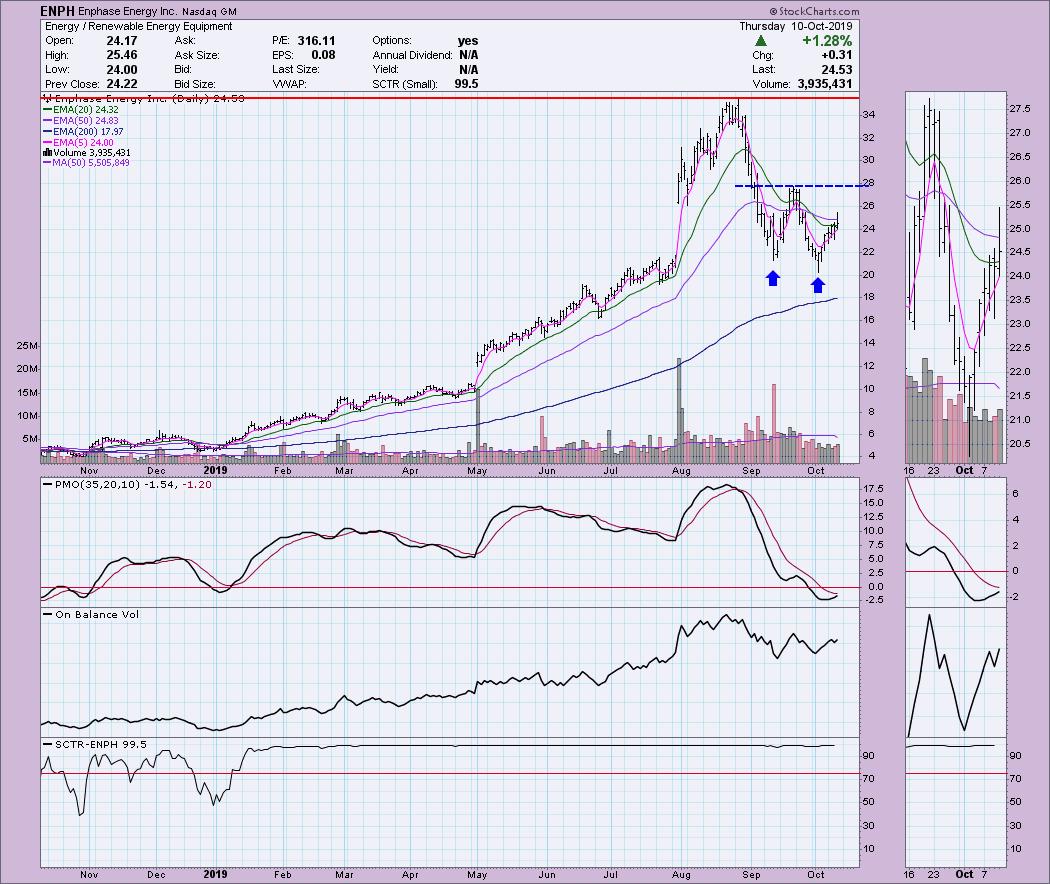
Enphase Energy Inc (ENPH) - Earnings: Last 7/30/19 with no listing for next report
You'll note a couple of double-bottom patterns forming on some of the stocks I've listed today. In this case, the pattern hasn't formed, and it technically isn't a "pattern" until it executes. In this case, price would need to break above $28, which is the "confirmation line" that basically "confirms" the pattern. To calculate the minimum upside target of the pattern, you take the height of the pattern to the confirmation line and add it. In this case, and in many you'll find, the minimum upside target is at overhead resistance at the all-time high. I like this stock, and I believe a reader recently forwarded me a chart to look at that turned up in today's scan. The PMO is rising again and is ready for a BUY signal to trigger. It's hard to beat that SCTR, which tells you there is relative strength in addition to internal strength.
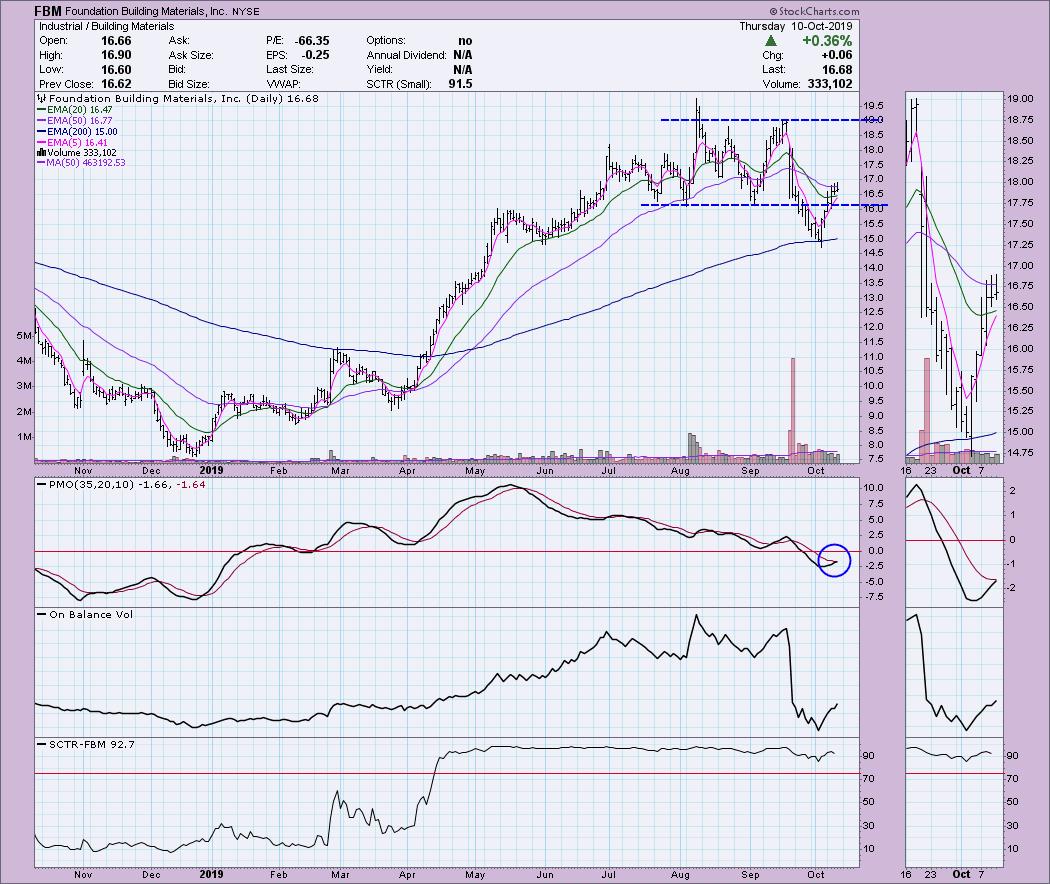
Foundation Building Materials Inc (FBM) - Earnings: 10/30 - 11/4/2019
FBM broke down from a trading range at the end of last month, but then promptly bounced off the 200-EMA. That's a good sign. The PMO is just about ready to trigger a BUY signal and positive volume has been coming in for a week. Today, it stayed above the 20-EMA as it did yesterday, which is healthy. If it trades and closes above the 50-EMA tomorrow, that should be a decent entry with an upside target around $19. That would be a nice gain.
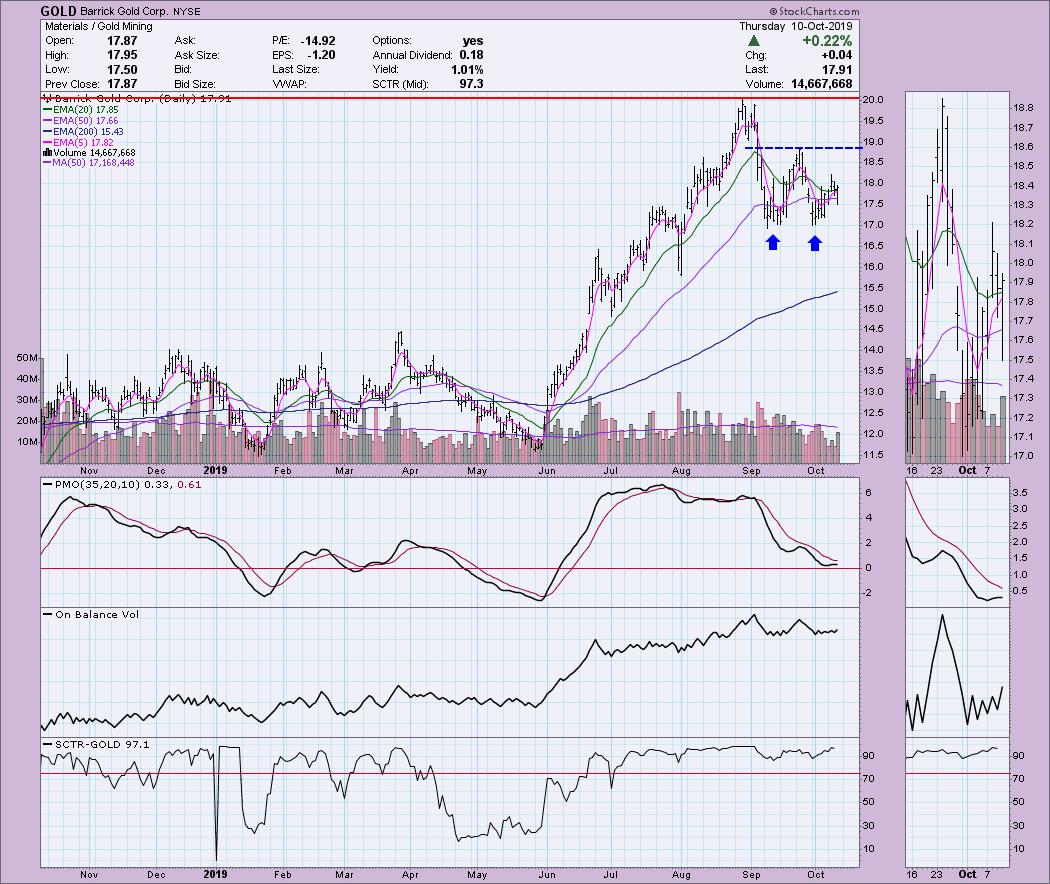
Barrick Gold Corp (GOLD) - Earnings: N/A
Here's our first gold stock. This one is a heavy hitter - notice all that volume. I see another double-bottom formation coming together. I don't like that Tuesday's intraday hasn't been challenged the last two days, but the rest of the chart looks pretty good. Given that I am bullish on Gold going forward, this could be a good vehicle to trade. Just remember that Gold Miners do not necessarily mimic Gold prices. They are companies, with company problems and advantages that weigh on or help the stock price.
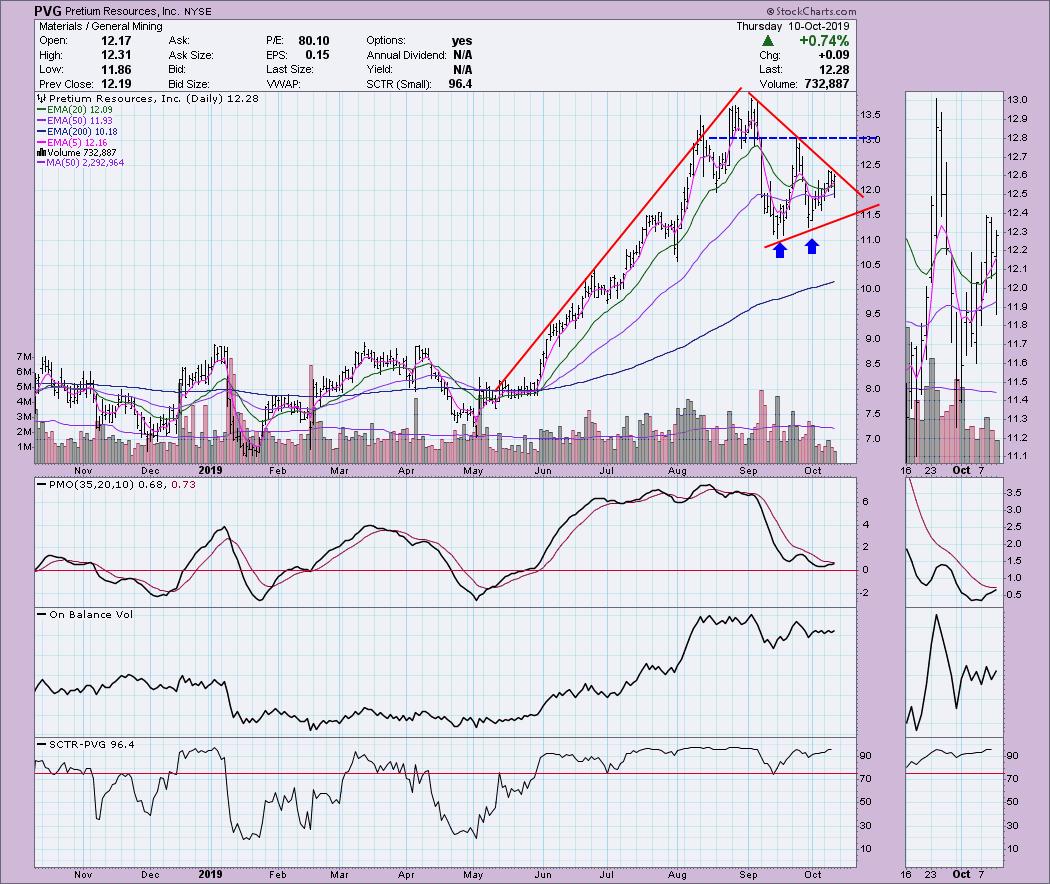
Pretium Resources Inc (PVG) - Earnings: N/A
The next is a general mining company. I've traded this one before and I did pretty well. I'm wishing I'd traded it back in June! I see a similar double-bottom brewing on PVG and a bullish flag formation. The symmetrical triangle that makes up the pennant on the flag is a continuation pattern as well, which suggests an upside breakout. My caution here is that it hasn't executed the symmetrical triangle and technically remains in a declining trend.
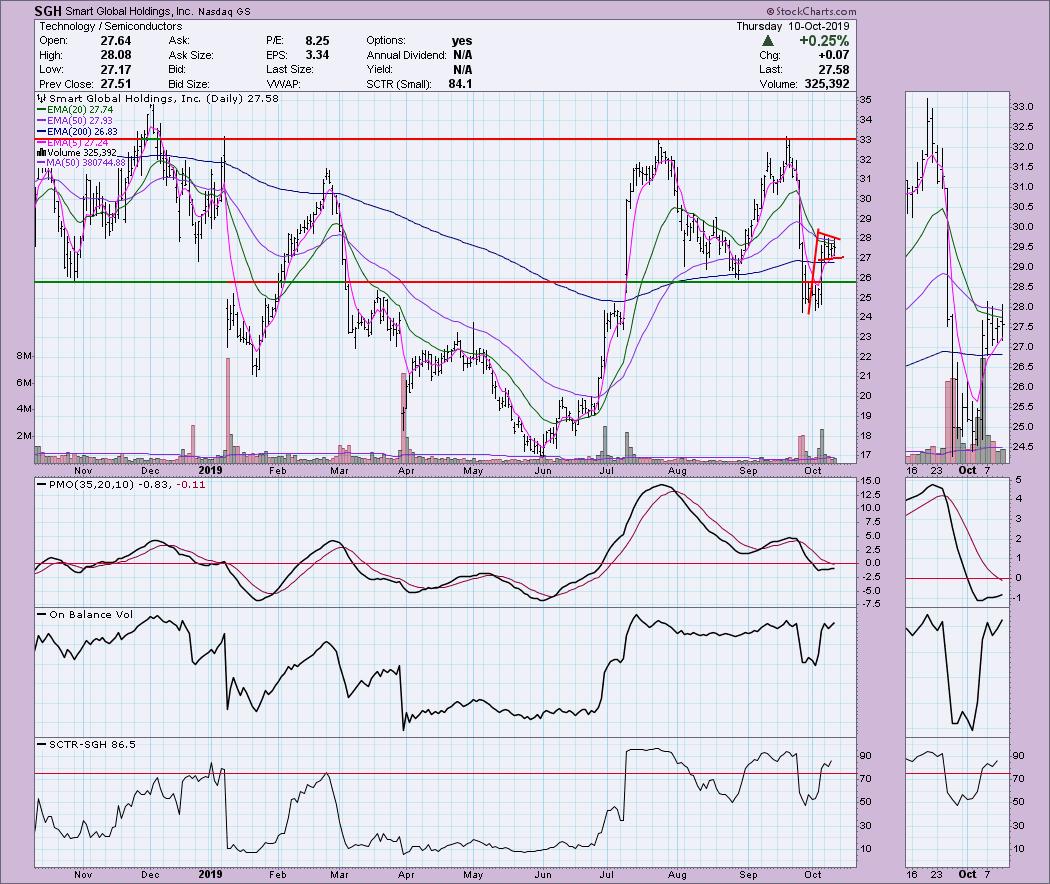
Smart Global Holdings Inc (SGH) - Earnings: 10/3/2019, None Listed After this Date
This one managed to close the July gap and promptly bounce back to life. It has now formed a short-term bull flag, with the minimum upside target hitting just below the overhead resistance at $33. Wait for the breakout, or at least a close above the 20/50-EMAs. Of course, an easy stop at $26 or $25.50 could protect you in the shorter term as you await the fulfillment of the flag pattern.
Full Disclosure: I do not own any of the stocks above and I am not planning on purchasing these or any additional stocks at this time. I'm currently about 60% in cash and watching my stops closely.
Watch the latest episode of DecisionPoint with Carl & Erin Swenlin LIVE on Mondays 5:00p EST or on the StockCharts TV YouTube channel here!
Technical Analysis is a windsock, not a crystal ball.
Happy Charting!
- Erin
erinh@stockcharts.com
NOTE: The stocks reported herein are from mechanical trading model scans that are based upon moving average relationships, momentum and volume. DecisionPoint analysis is then applied to get five selections from the scans. The selections given should prompt readers to do a chart review using their own analysis process. This letter is not a call for a specific action to buy, sell or short any of the stocks provided. There are NO sure things or guaranteed returns on the daily selection of "diamonds in the rough."
Helpful DecisionPoint Links:
DecisionPoint Shared ChartList and DecisionPoint Chart Gallery
Price Momentum Oscillator (PMO)
Swenlin Trading Oscillators (STO-B and STO-V)
**Don't miss DecisionPoint Commentary! Add your email below to be notified of new updates"**


